
|
|||||
|
 | |
| |
| |
| |
| |
| |
|
Gene: IFI30 |
Gene summary for IFI30 |
| Gene information | Species | Human | Gene symbol | IFI30 | Gene ID | 10437 |
| Gene name | IFI30 lysosomal thiol reductase | |
| Gene Alias | GILT | |
| Cytomap | 19p13.11 | |
| Gene Type | protein-coding | GO ID | GO:0002376 | UniProtAcc | A0A024R7N7 |
Top |
Malignant transformation analysis |
| Identification of the aberrant gene expression in precancerous and cancerous lesions by comparing the gene expression of stem-like cells in diseased tissues with normal stem cells |
| Entrez ID | Symbol | Replicates | Species | Organ | Tissue | Adj P-value | Log2FC | Malignancy |
| 10437 | IFI30 | LZE4T | Human | Esophagus | ESCC | 1.44e-22 | 7.66e-01 | 0.0811 |
| 10437 | IFI30 | LZE5T | Human | Esophagus | ESCC | 3.15e-15 | 2.02e+00 | 0.0514 |
| 10437 | IFI30 | LZE7T | Human | Esophagus | ESCC | 6.28e-20 | 8.06e-01 | 0.0667 |
| 10437 | IFI30 | LZE8T | Human | Esophagus | ESCC | 6.71e-04 | 3.22e-01 | 0.067 |
| 10437 | IFI30 | LZE20T | Human | Esophagus | ESCC | 3.87e-19 | 1.58e+00 | 0.0662 |
| 10437 | IFI30 | LZE22D1 | Human | Esophagus | HGIN | 4.30e-07 | 4.21e-01 | 0.0595 |
| 10437 | IFI30 | LZE22T | Human | Esophagus | ESCC | 1.00e-09 | 8.12e-01 | 0.068 |
| 10437 | IFI30 | LZE24D1 | Human | Esophagus | HGIN | 3.66e-03 | 1.13e+00 | 0.054 |
| 10437 | IFI30 | LZE24T | Human | Esophagus | ESCC | 2.58e-44 | 1.34e+00 | 0.0596 |
| 10437 | IFI30 | LZE22D3 | Human | Esophagus | HGIN | 1.73e-02 | 3.58e-01 | 0.0653 |
| 10437 | IFI30 | LZE21T | Human | Esophagus | ESCC | 1.97e-09 | 5.43e-01 | 0.0655 |
| 10437 | IFI30 | LZE6T | Human | Esophagus | ESCC | 5.21e-27 | 1.18e+00 | 0.0845 |
| 10437 | IFI30 | P2T-E | Human | Esophagus | ESCC | 9.44e-07 | 1.67e-01 | 0.1177 |
| 10437 | IFI30 | P4T-E | Human | Esophagus | ESCC | 9.47e-14 | 3.11e-01 | 0.1323 |
| 10437 | IFI30 | P5T-E | Human | Esophagus | ESCC | 1.77e-22 | 4.09e-01 | 0.1327 |
| 10437 | IFI30 | P8T-E | Human | Esophagus | ESCC | 3.28e-14 | 2.83e-01 | 0.0889 |
| 10437 | IFI30 | P9T-E | Human | Esophagus | ESCC | 1.78e-21 | 4.08e-01 | 0.1131 |
| 10437 | IFI30 | P10T-E | Human | Esophagus | ESCC | 3.50e-02 | 8.05e-02 | 0.116 |
| 10437 | IFI30 | P11T-E | Human | Esophagus | ESCC | 4.50e-19 | 6.36e-01 | 0.1426 |
| 10437 | IFI30 | P12T-E | Human | Esophagus | ESCC | 3.28e-14 | 2.37e-01 | 0.1122 |
| Page: 1 2 3 4 5 |
| Tissue | Expression Dynamics | Abbreviation |
| Esophagus | 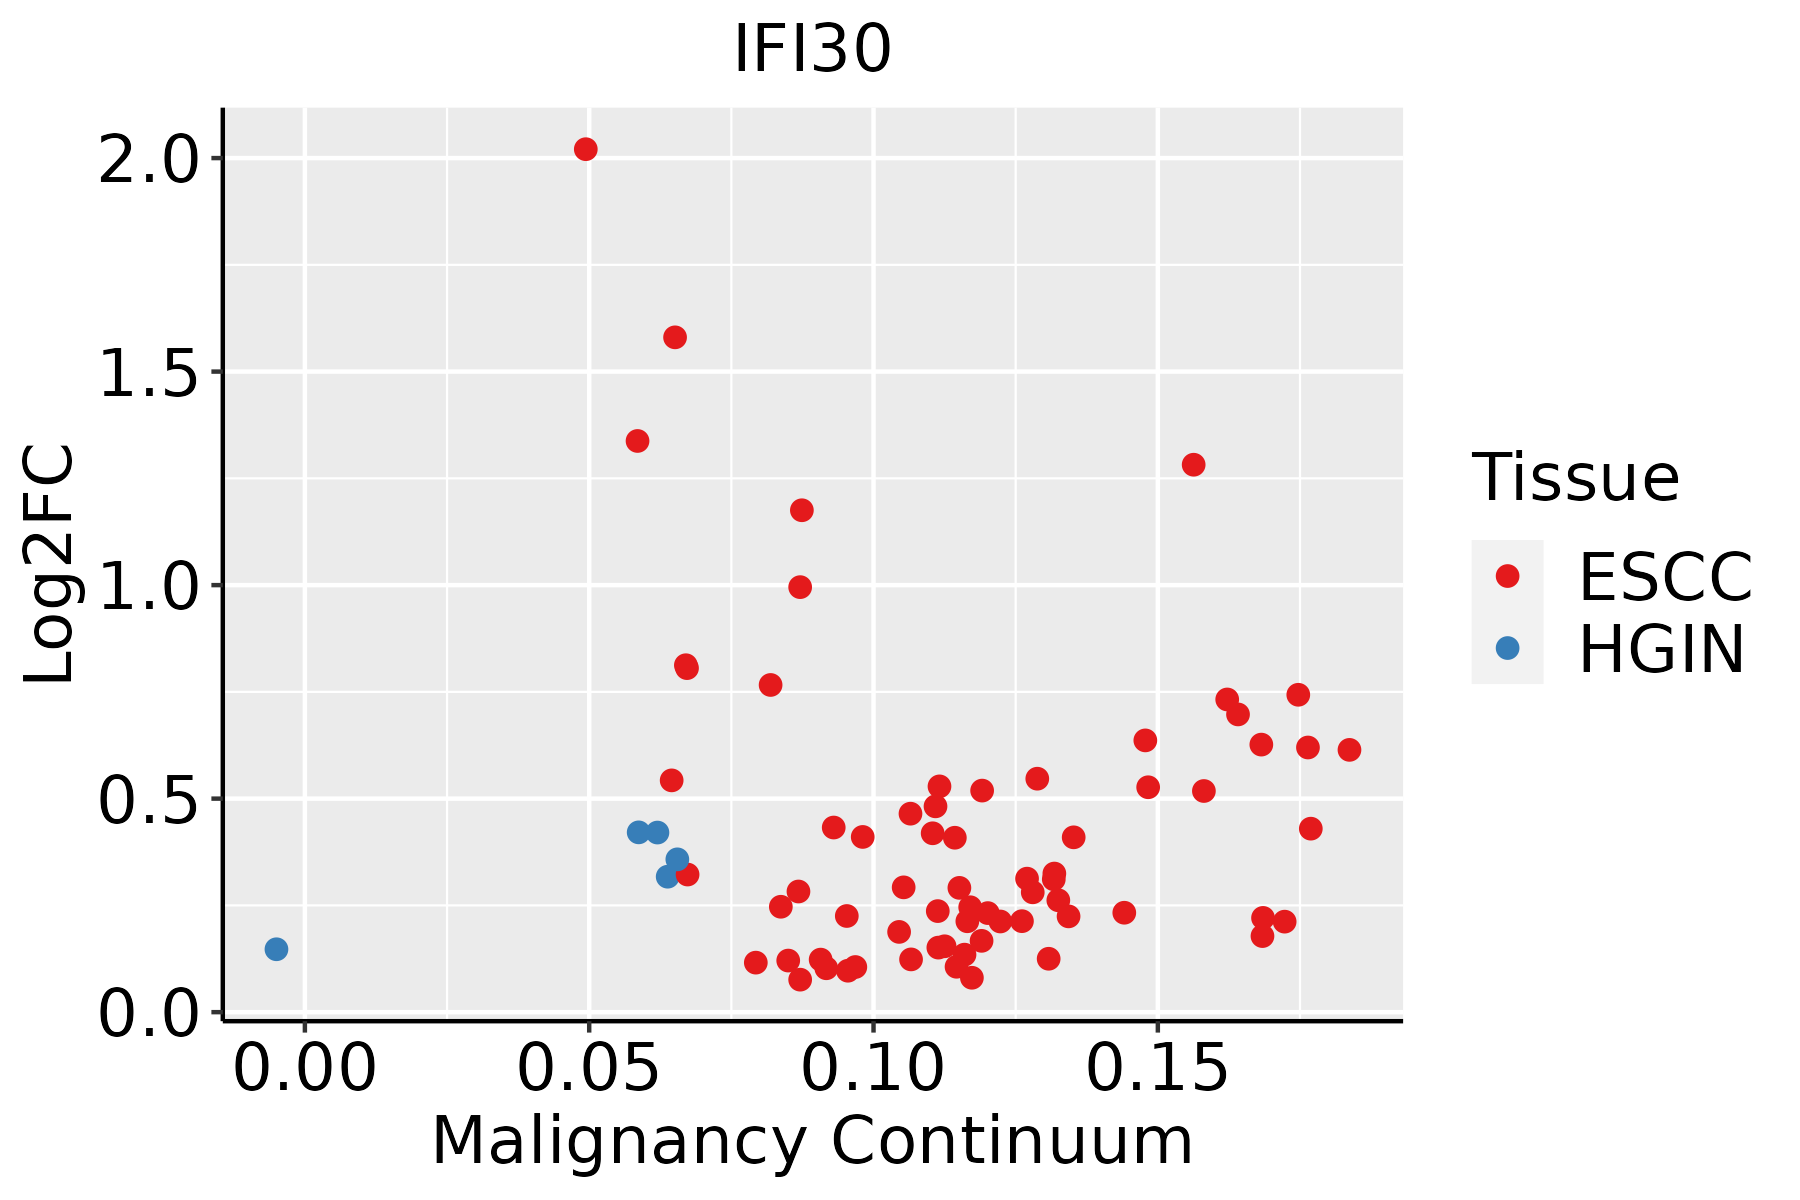 | ESCC: Esophageal squamous cell carcinoma |
| HGIN: High-grade intraepithelial neoplasias | ||
| LGIN: Low-grade intraepithelial neoplasias | ||
| GC | 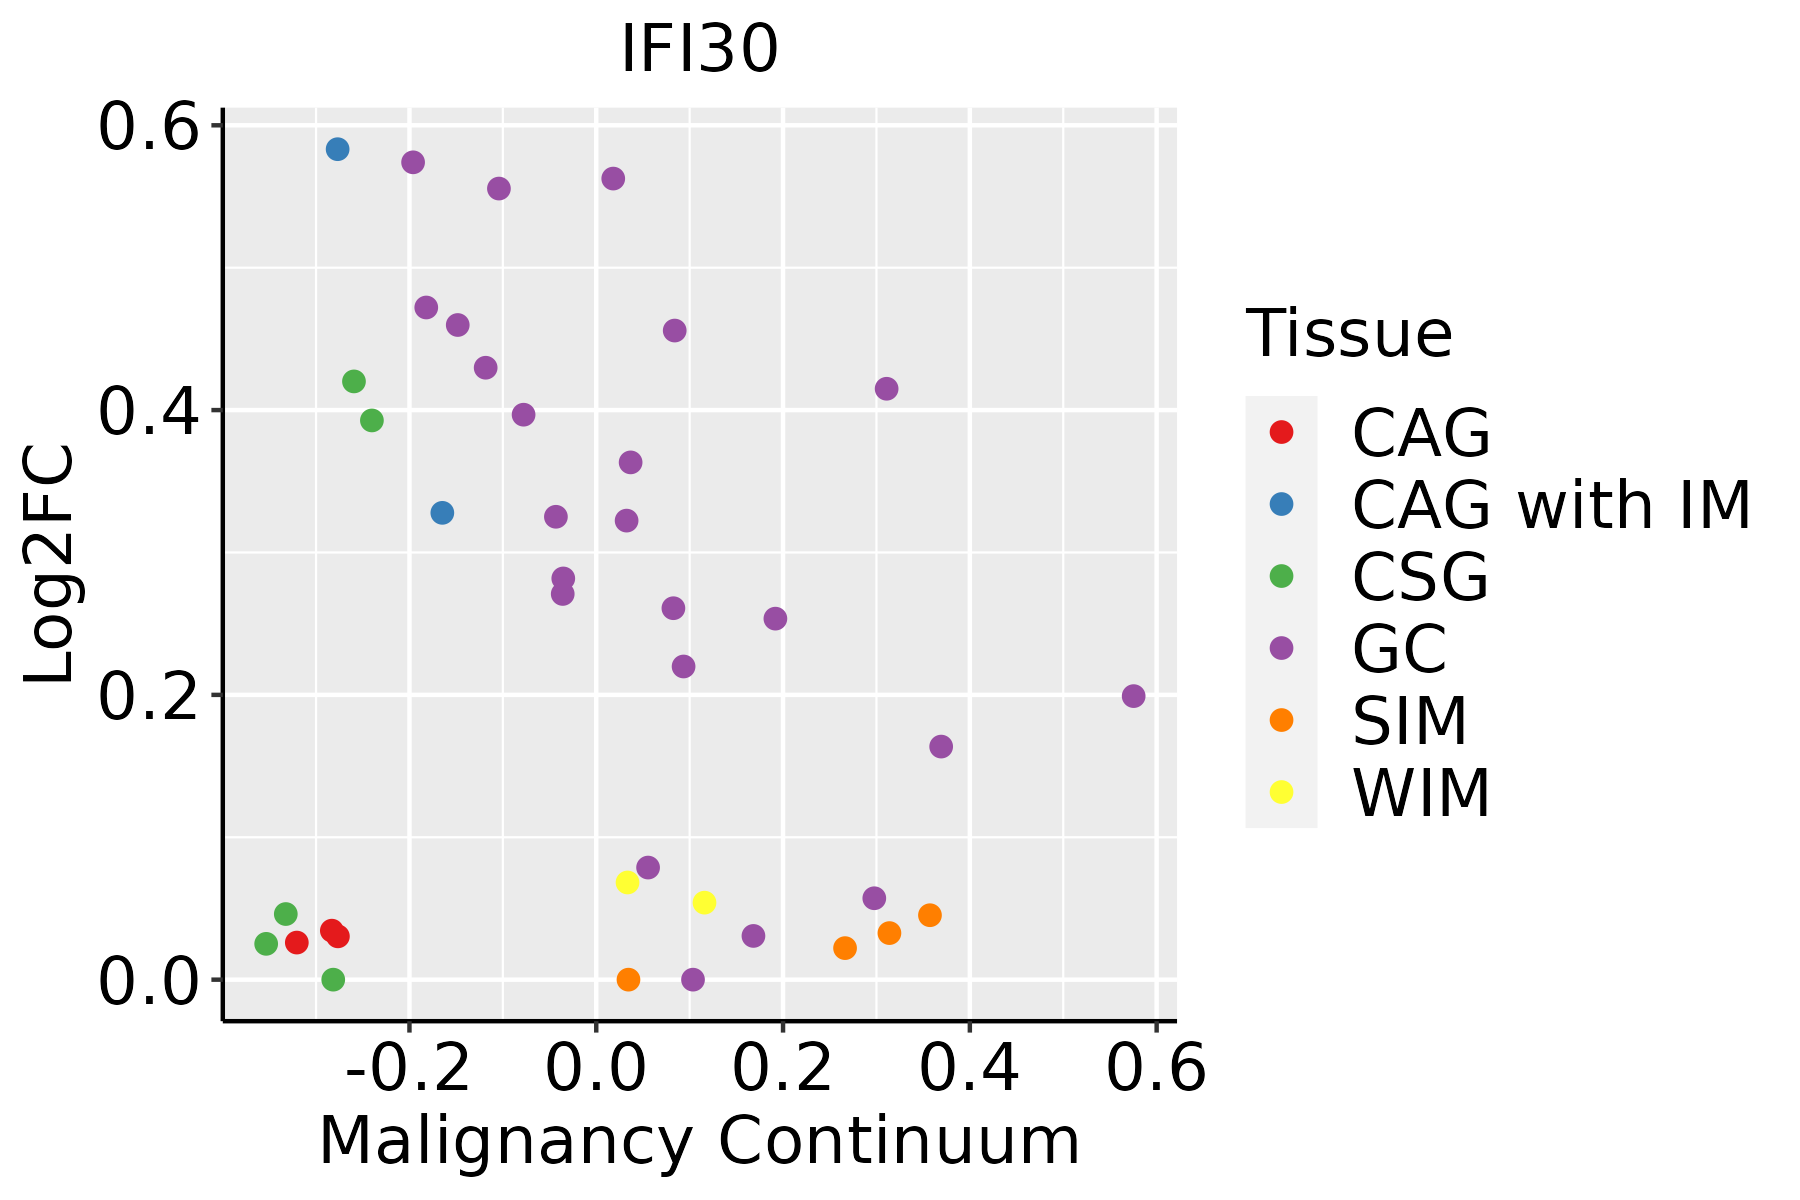 | CAG: Chronic atrophic gastritis |
| CAG with IM: Chronic atrophic gastritis with intestinal metaplasia | ||
| CSG: Chronic superficial gastritis | ||
| GC: Gastric cancer | ||
| SIM: Severe intestinal metaplasia | ||
| WIM: Wild intestinal metaplasia | ||
| Liver | 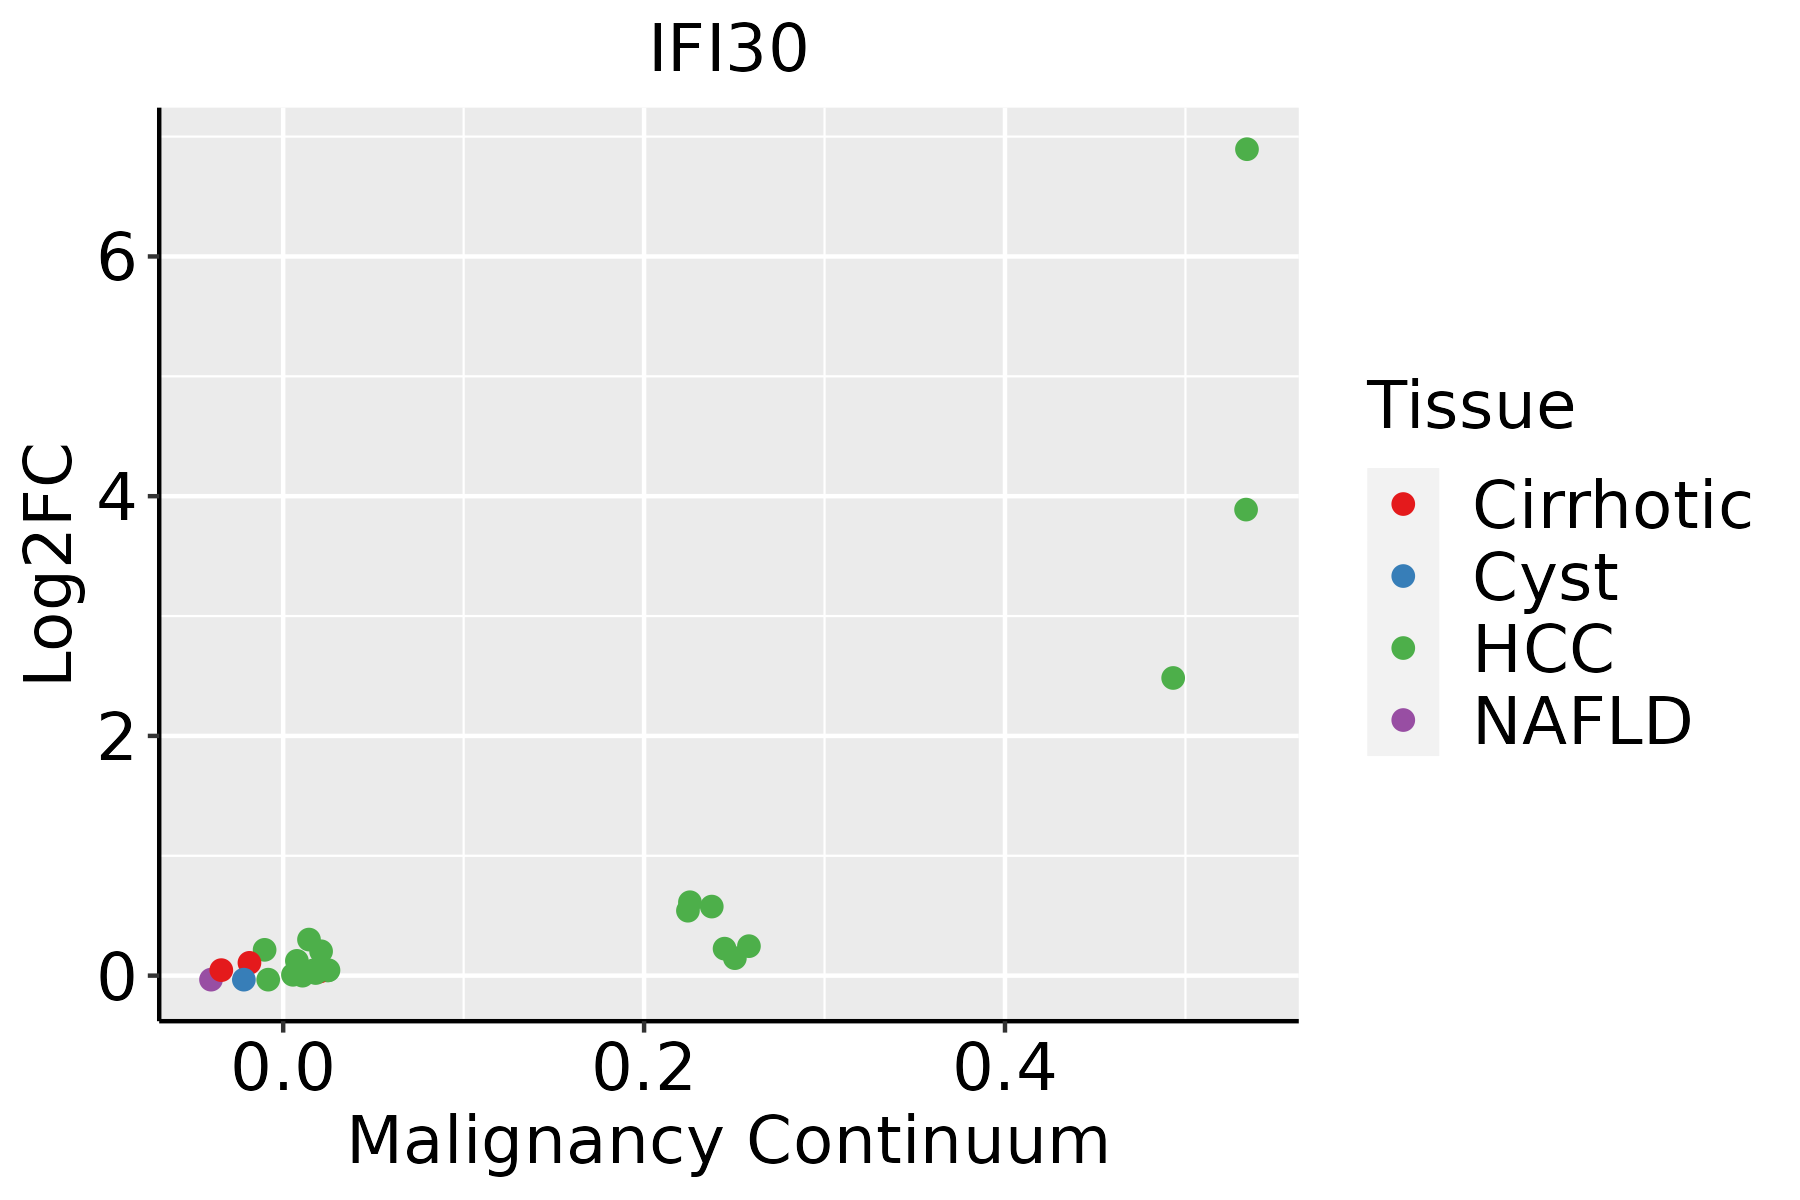 | HCC: Hepatocellular carcinoma |
| NAFLD: Non-alcoholic fatty liver disease | ||
| Lung |  | AAH: Atypical adenomatous hyperplasia |
| AIS: Adenocarcinoma in situ | ||
| IAC: Invasive lung adenocarcinoma | ||
| MIA: Minimally invasive adenocarcinoma |
| ∗log2FC in expression of this searched gene in stem-like cells from each diseased tissue sample relative to stem-like cells in normal samples in each tissue plotted against the malignancy continuum. Samples are colored based on if they are from different disease stage. |
Top |
Malignant transformation related pathway analysis |
| Find out the enriched GO biological processes and KEGG pathways involved in transition from healthy to precancer to cancer |
| Tissue | Disease Stage | Enriched GO biological Processes |
| Colorectum | AD |  |
| Colorectum | SER |  |
| Colorectum | MSS |  |
| Colorectum | MSI-H |  |
| Colorectum | FAP |  |
| ∗Top 15 enriched GO BP terms are showed in the bar plot of each disease state in each tissue. Each row represents a significant GO biological process which is colored according to the -log10(p.adjust). |
| Page: 1 2 3 4 5 6 7 8 9 |
| GO ID | Tissue | Disease Stage | Description | Gene Ratio | Bg Ratio | pvalue | p.adjust | Count |
| GO:003164727 | Esophagus | HGIN | regulation of protein stability | 96/2587 | 298/18723 | 2.21e-16 | 5.76e-14 | 96 |
| GO:005082127 | Esophagus | HGIN | protein stabilization | 64/2587 | 191/18723 | 3.11e-12 | 4.24e-10 | 64 |
| GO:00481458 | Esophagus | HGIN | regulation of fibroblast proliferation | 23/2587 | 80/18723 | 3.71e-04 | 5.77e-03 | 23 |
| GO:00481447 | Esophagus | HGIN | fibroblast proliferation | 23/2587 | 81/18723 | 4.52e-04 | 6.62e-03 | 23 |
| GO:00481472 | Esophagus | HGIN | negative regulation of fibroblast proliferation | 10/2587 | 30/18723 | 5.36e-03 | 4.40e-02 | 10 |
| GO:0031647111 | Esophagus | ESCC | regulation of protein stability | 223/8552 | 298/18723 | 5.76e-25 | 1.52e-22 | 223 |
| GO:0050821111 | Esophagus | ESCC | protein stabilization | 140/8552 | 191/18723 | 6.50e-15 | 3.61e-13 | 140 |
| GO:004814414 | Esophagus | ESCC | fibroblast proliferation | 57/8552 | 81/18723 | 5.83e-06 | 6.03e-05 | 57 |
| GO:004814514 | Esophagus | ESCC | regulation of fibroblast proliferation | 56/8552 | 80/18723 | 9.08e-06 | 8.71e-05 | 56 |
| GO:004800220 | Esophagus | ESCC | antigen processing and presentation of peptide antigen | 44/8552 | 62/18723 | 4.81e-05 | 3.78e-04 | 44 |
| GO:000247820 | Esophagus | ESCC | antigen processing and presentation of exogenous peptide antigen | 29/8552 | 38/18723 | 1.18e-04 | 8.13e-04 | 29 |
| GO:001988225 | Esophagus | ESCC | antigen processing and presentation | 67/8552 | 106/18723 | 2.03e-04 | 1.28e-03 | 67 |
| GO:000247418 | Esophagus | ESCC | antigen processing and presentation of peptide antigen via MHC class I | 22/8552 | 28/18723 | 3.95e-04 | 2.26e-03 | 22 |
| GO:001988420 | Esophagus | ESCC | antigen processing and presentation of exogenous antigen | 33/8552 | 47/18723 | 5.77e-04 | 3.14e-03 | 33 |
| GO:000250417 | Esophagus | ESCC | antigen processing and presentation of peptide or polysaccharide antigen via MHC class II | 26/8552 | 36/18723 | 1.14e-03 | 5.66e-03 | 26 |
| GO:001988618 | Esophagus | ESCC | antigen processing and presentation of exogenous peptide antigen via MHC class II | 22/8552 | 30/18723 | 1.98e-03 | 8.90e-03 | 22 |
| GO:00481471 | Esophagus | ESCC | negative regulation of fibroblast proliferation | 22/8552 | 30/18723 | 1.98e-03 | 8.90e-03 | 22 |
| GO:000249517 | Esophagus | ESCC | antigen processing and presentation of peptide antigen via MHC class II | 24/8552 | 34/18723 | 2.90e-03 | 1.22e-02 | 24 |
| GO:003164722 | Liver | HCC | regulation of protein stability | 211/7958 | 298/18723 | 2.29e-23 | 5.01e-21 | 211 |
| GO:005082122 | Liver | HCC | protein stabilization | 139/7958 | 191/18723 | 1.61e-17 | 1.71e-15 | 139 |
| Page: 1 2 3 4 |
| Pathway ID | Tissue | Disease Stage | Description | Gene Ratio | Bg Ratio | pvalue | p.adjust | qvalue | Count |
| hsa0461230 | Esophagus | ESCC | Antigen processing and presentation | 51/4205 | 78/8465 | 3.57e-03 | 9.34e-03 | 4.78e-03 | 51 |
| hsa04612114 | Esophagus | ESCC | Antigen processing and presentation | 51/4205 | 78/8465 | 3.57e-03 | 9.34e-03 | 4.78e-03 | 51 |
| hsa0461212 | Stomach | GC | Antigen processing and presentation | 28/708 | 78/8465 | 8.70e-12 | 2.53e-10 | 1.78e-10 | 28 |
| hsa0461213 | Stomach | GC | Antigen processing and presentation | 28/708 | 78/8465 | 8.70e-12 | 2.53e-10 | 1.78e-10 | 28 |
| hsa0461221 | Stomach | CAG with IM | Antigen processing and presentation | 28/640 | 78/8465 | 7.38e-13 | 1.68e-11 | 1.18e-11 | 28 |
| hsa0461231 | Stomach | CAG with IM | Antigen processing and presentation | 28/640 | 78/8465 | 7.38e-13 | 1.68e-11 | 1.18e-11 | 28 |
| hsa0461241 | Stomach | CSG | Antigen processing and presentation | 28/633 | 78/8465 | 5.62e-13 | 1.27e-11 | 9.13e-12 | 28 |
| hsa0461251 | Stomach | CSG | Antigen processing and presentation | 28/633 | 78/8465 | 5.62e-13 | 1.27e-11 | 9.13e-12 | 28 |
| Page: 1 |
Top |
Cell-cell communication analysis |
| Identification of potential cell-cell interactions between two cell types and their ligand-receptor pairs for different disease states |
| Ligand | Receptor | LRpair | Pathway | Tissue | Disease Stage |
| Page: 1 |
Top |
Single-cell gene regulatory network inference analysis |
| Find out the significant the regulons (TFs) and the target genes of each regulon across cell types for different disease states |
| TF | Cell Type | Tissue | Disease Stage | Target Gene | RSS | Regulon Activity |
| ∗The dot plots of a searched regulon are shown for all cell subpopulations in each disease state of each tissue based on the regulon specific score inferred using pySCENIC and by calculating the average expression. |
| Page: 1 |
Top |
Somatic mutation of malignant transformation related genes |
| Annotation of somatic variants for genes involved in malignant transformation |
| Hugo Symbol | Variant Class | Variant Classification | dbSNP RS | HGVSc | HGVSp | HGVSp Short | SWISSPROT | BIOTYPE | SIFT | PolyPhen | Tumor Sample Barcode | Tissue | Histology | Sex | Age | Stage | Therapy Types | Drugs | Outcome |
| IFI30 | SNV | Missense_Mutation | rs773697080 | c.453N>C | p.Glu151Asp | p.E151D | P13284 | protein_coding | tolerated(0.15) | possibly_damaging(0.891) | TCGA-AR-A256-01 | Breast | breast invasive carcinoma | Female | <65 | I/II | Chemotherapy | doxorubicin | PD |
| IFI30 | SNV | Missense_Mutation | novel | c.530N>C | p.Glu177Ala | p.E177A | P13284 | protein_coding | tolerated(0.73) | benign(0.005) | TCGA-OL-A66L-01 | Breast | breast invasive carcinoma | Female | >=65 | I/II | Unknown | Unknown | SD |
| IFI30 | insertion | Frame_Shift_Ins | novel | c.451_452insGAGAAACCCTGTCTCTACTAAAAATACAAAAATT | p.Glu151GlyfsTer14 | p.E151Gfs*14 | P13284 | protein_coding | TCGA-A8-A07P-01 | Breast | breast invasive carcinoma | Female | >=65 | I/II | Chemotherapy | 5-fluorouracil | SD | ||
| IFI30 | insertion | In_Frame_Ins | novel | c.672_673insCCTATAATCCCAGCTACTCAGGAGGCTGAG | p.Leu224_Val225insProIleIleProAlaThrGlnGluAlaGlu | p.L224_V225insPIIPATQEAE | P13284 | protein_coding | TCGA-AN-A03X-01 | Breast | breast invasive carcinoma | Female | >=65 | I/II | Unknown | Unknown | SD | ||
| IFI30 | SNV | Missense_Mutation | novel | c.68N>T | p.Ala23Val | p.A23V | P13284 | protein_coding | deleterious_low_confidence(0.03) | benign(0.003) | TCGA-2W-A8YY-01 | Cervix | cervical & endocervical cancer | Female | <65 | I/II | Chemotherapy | cisplatin | CR |
| IFI30 | SNV | Missense_Mutation | c.721N>G | p.Thr241Ala | p.T241A | P13284 | protein_coding | tolerated(1) | benign(0.001) | TCGA-UC-A7PF-01 | Cervix | cervical & endocervical cancer | Female | <65 | I/II | Unknown | Unknown | SD | |
| IFI30 | SNV | Missense_Mutation | rs764192398 | c.581G>A | p.Arg194Gln | p.R194Q | P13284 | protein_coding | tolerated(0.28) | benign(0.147) | TCGA-AA-3864-01 | Colorectum | colon adenocarcinoma | Male | >=65 | I/II | Unknown | Unknown | SD |
| IFI30 | SNV | Missense_Mutation | rs533404165 | c.628N>A | p.Val210Ile | p.V210I | P13284 | protein_coding | tolerated(0.59) | benign(0.003) | TCGA-AZ-4313-01 | Colorectum | colon adenocarcinoma | Female | <65 | I/II | Unknown | Unknown | SD |
| IFI30 | SNV | Missense_Mutation | novel | c.671N>G | p.Leu224Arg | p.L224R | P13284 | protein_coding | deleterious(0) | possibly_damaging(0.497) | TCGA-AZ-4315-01 | Colorectum | colon adenocarcinoma | Male | <65 | I/II | Unknown | Unknown | SD |
| IFI30 | SNV | Missense_Mutation | novel | c.102C>A | p.Phe34Leu | p.F34L | P13284 | protein_coding | tolerated_low_confidence(0.77) | benign(0) | TCGA-CA-6717-01 | Colorectum | colon adenocarcinoma | Male | <65 | I/II | Chemotherapy | oxaliplatin | CR |
| Page: 1 2 3 |
Top |
Related drugs of malignant transformation related genes |
| Identification of chemicals and drugs interact with genes involved in malignant transfromation |
| (DGIdb 4.0) |
| Entrez ID | Symbol | Category | Interaction Types | Drug Claim Name | Drug Name | PMIDs |
| Page: 1 |

Copyright 2023-Present -The University of Texas Health Science Center at Houston |