
|
|||||
|
 | |
| |
| |
| |
| |
| |
|
Gene: IFI27L2 |
Gene summary for IFI27L2 |
| Gene information | Species | Human | Gene symbol | IFI27L2 | Gene ID | 83982 |
| Gene name | interferon alpha inducible protein 27 like 2 | |
| Gene Alias | FAM14A | |
| Cytomap | 14q32.12 | |
| Gene Type | protein-coding | GO ID | GO:0006915 | UniProtAcc | Q9H2X8 |
Top |
Malignant transformation analysis |
| Identification of the aberrant gene expression in precancerous and cancerous lesions by comparing the gene expression of stem-like cells in diseased tissues with normal stem cells |
| Entrez ID | Symbol | Replicates | Species | Organ | Tissue | Adj P-value | Log2FC | Malignancy |
| 83982 | IFI27L2 | CA_HPV_1 | Human | Cervix | CC | 4.84e-05 | -1.64e-01 | 0.0264 |
| 83982 | IFI27L2 | CA_HPV_3 | Human | Cervix | CC | 4.77e-03 | 1.75e-01 | 0.0414 |
| 83982 | IFI27L2 | N_HPV_2 | Human | Cervix | N_HPV | 6.76e-05 | 2.00e-01 | -0.0131 |
| 83982 | IFI27L2 | CCI_1 | Human | Cervix | CC | 8.24e-06 | -5.16e-01 | 0.528 |
| 83982 | IFI27L2 | CCI_3 | Human | Cervix | CC | 2.17e-03 | -4.54e-01 | 0.516 |
| 83982 | IFI27L2 | CCII_1 | Human | Cervix | CC | 3.33e-09 | -5.05e-01 | 0.3249 |
| 83982 | IFI27L2 | Tumor | Human | Cervix | CC | 4.15e-12 | 4.46e-01 | 0.1241 |
| 83982 | IFI27L2 | sample3 | Human | Cervix | CC | 3.55e-11 | 4.35e-01 | 0.1387 |
| 83982 | IFI27L2 | L1 | Human | Cervix | CC | 1.33e-02 | -2.85e-01 | 0.0802 |
| 83982 | IFI27L2 | T3 | Human | Cervix | CC | 2.72e-10 | 4.31e-01 | 0.1389 |
| 83982 | IFI27L2 | AEH-subject1 | Human | Endometrium | AEH | 5.06e-15 | -4.59e-01 | -0.3059 |
| 83982 | IFI27L2 | AEH-subject2 | Human | Endometrium | AEH | 1.80e-23 | -5.21e-01 | -0.2525 |
| 83982 | IFI27L2 | AEH-subject3 | Human | Endometrium | AEH | 7.16e-17 | -4.93e-01 | -0.2576 |
| 83982 | IFI27L2 | AEH-subject4 | Human | Endometrium | AEH | 3.06e-17 | -4.92e-01 | -0.2657 |
| 83982 | IFI27L2 | AEH-subject5 | Human | Endometrium | AEH | 8.54e-27 | -6.02e-01 | -0.2953 |
| 83982 | IFI27L2 | EEC-subject1 | Human | Endometrium | EEC | 3.96e-26 | -5.54e-01 | -0.2682 |
| 83982 | IFI27L2 | EEC-subject2 | Human | Endometrium | EEC | 1.20e-29 | -6.08e-01 | -0.2607 |
| 83982 | IFI27L2 | EEC-subject3 | Human | Endometrium | EEC | 5.35e-45 | -5.61e-01 | -0.2525 |
| 83982 | IFI27L2 | EEC-subject4 | Human | Endometrium | EEC | 1.02e-17 | -4.88e-01 | -0.2571 |
| 83982 | IFI27L2 | EEC-subject5 | Human | Endometrium | EEC | 6.97e-22 | -5.22e-01 | -0.249 |
| Page: 1 2 3 4 5 6 7 8 9 |
| Tissue | Expression Dynamics | Abbreviation |
| Cervix | 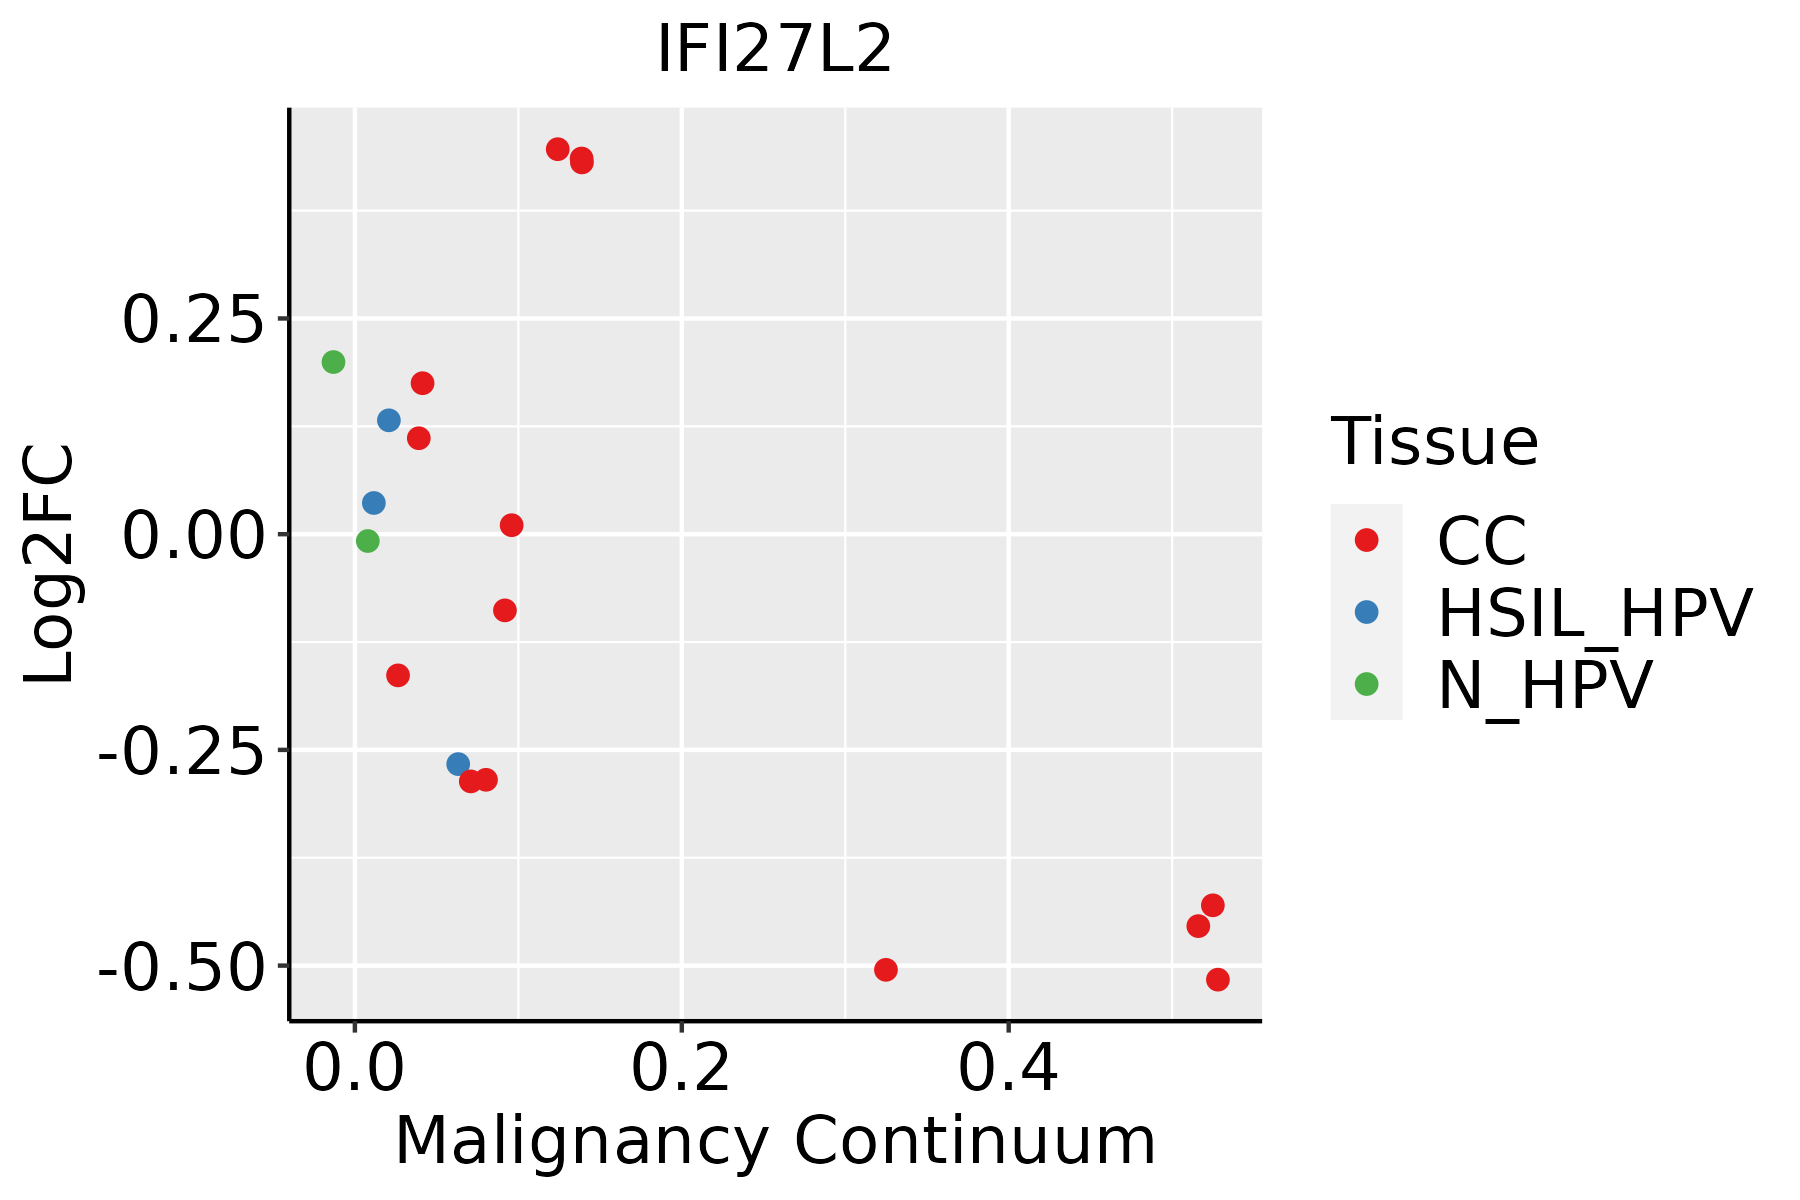 | CC: Cervix cancer |
| HSIL_HPV: HPV-infected high-grade squamous intraepithelial lesions | ||
| N_HPV: HPV-infected normal cervix | ||
| Endometrium | 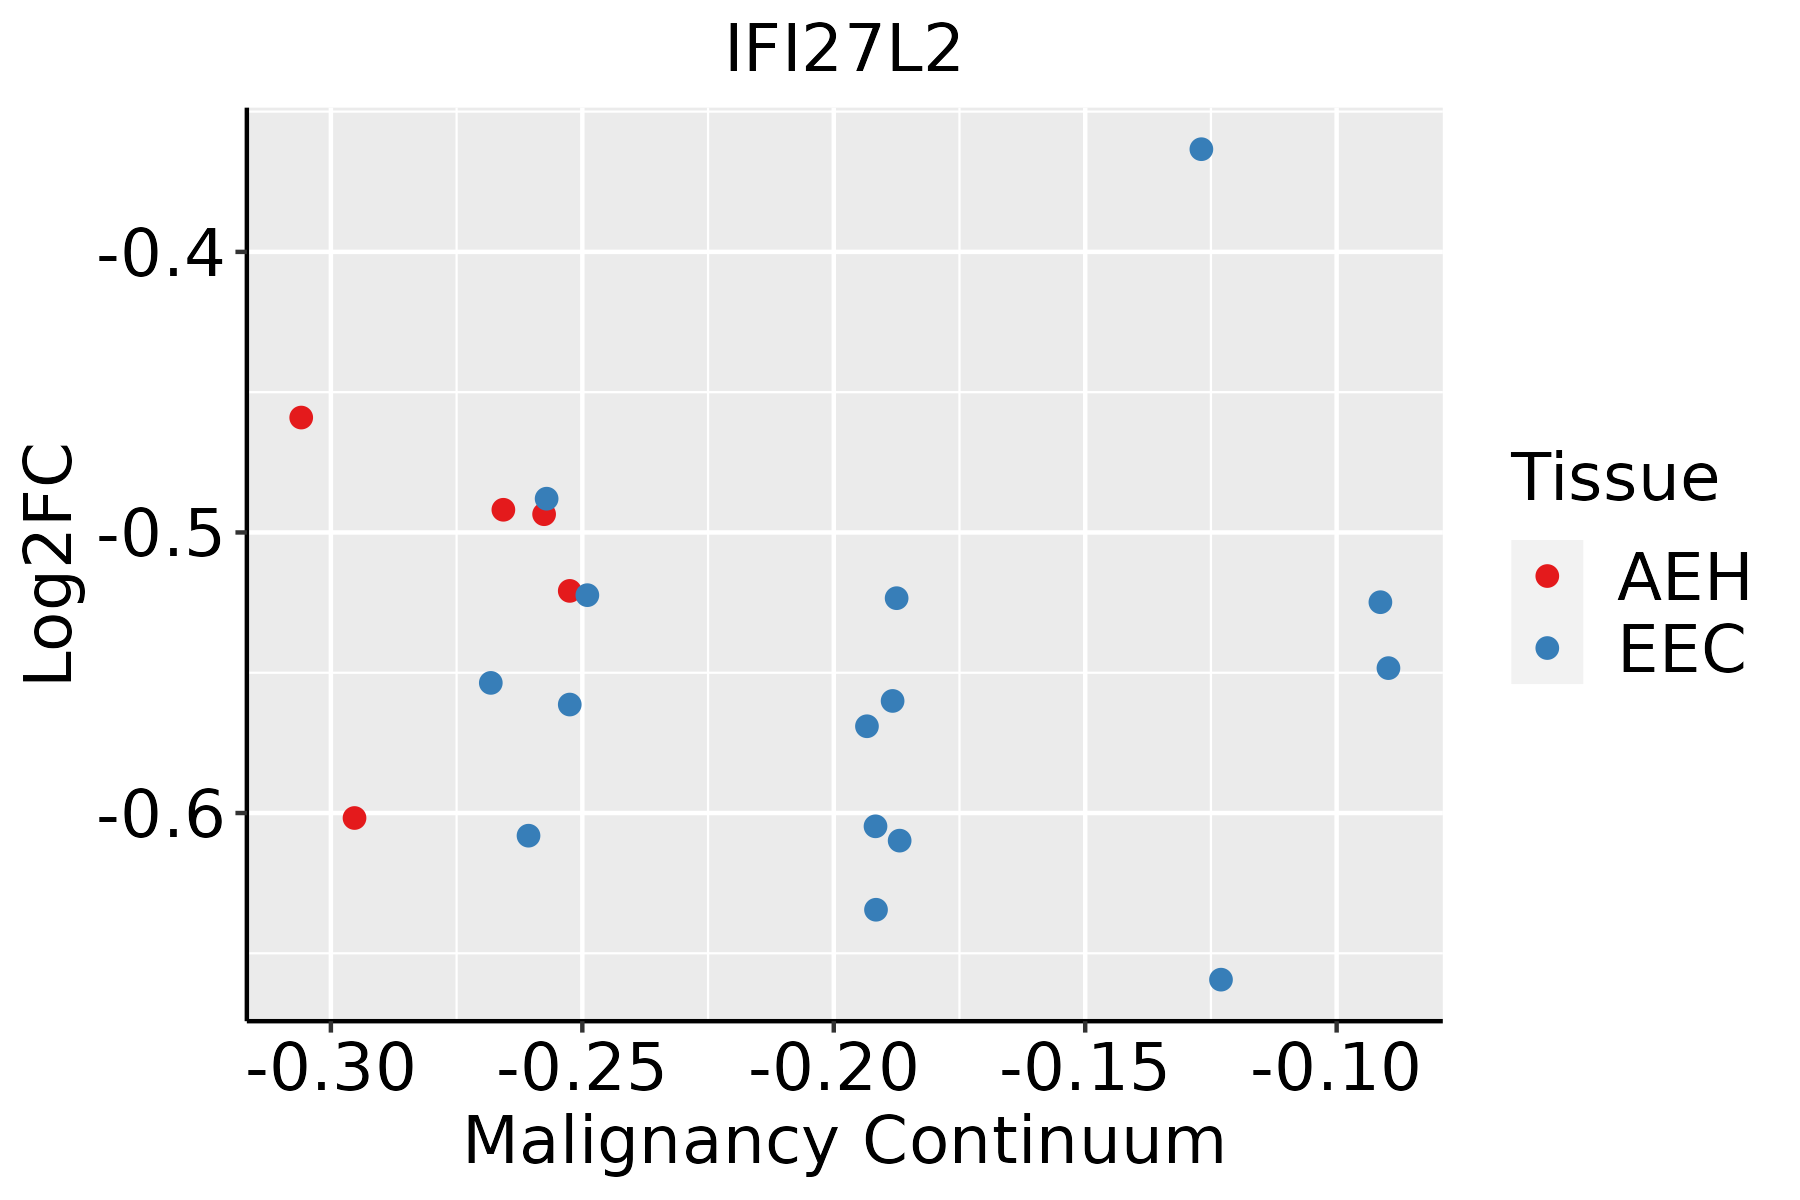 | AEH: Atypical endometrial hyperplasia |
| EEC: Endometrioid Cancer | ||
| Esophagus | 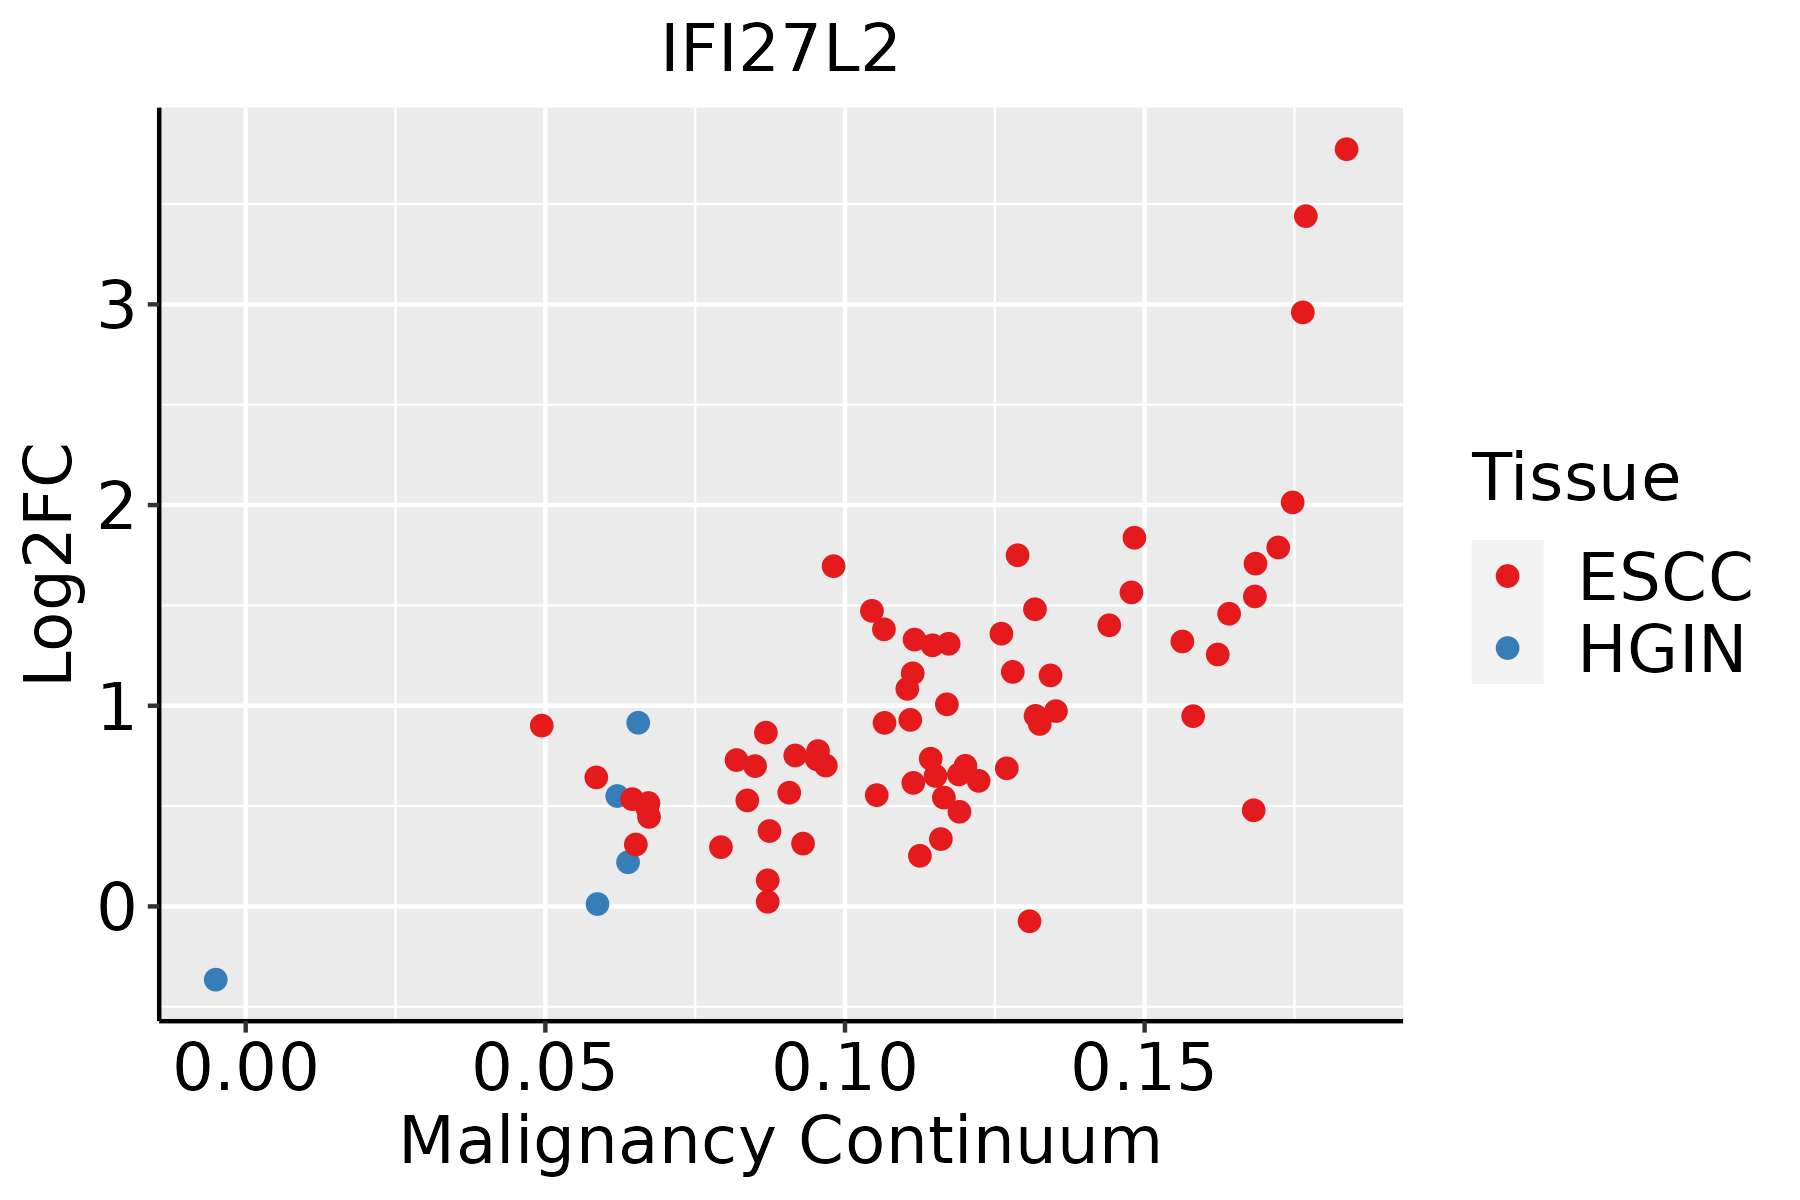 | ESCC: Esophageal squamous cell carcinoma |
| HGIN: High-grade intraepithelial neoplasias | ||
| LGIN: Low-grade intraepithelial neoplasias | ||
| GC | 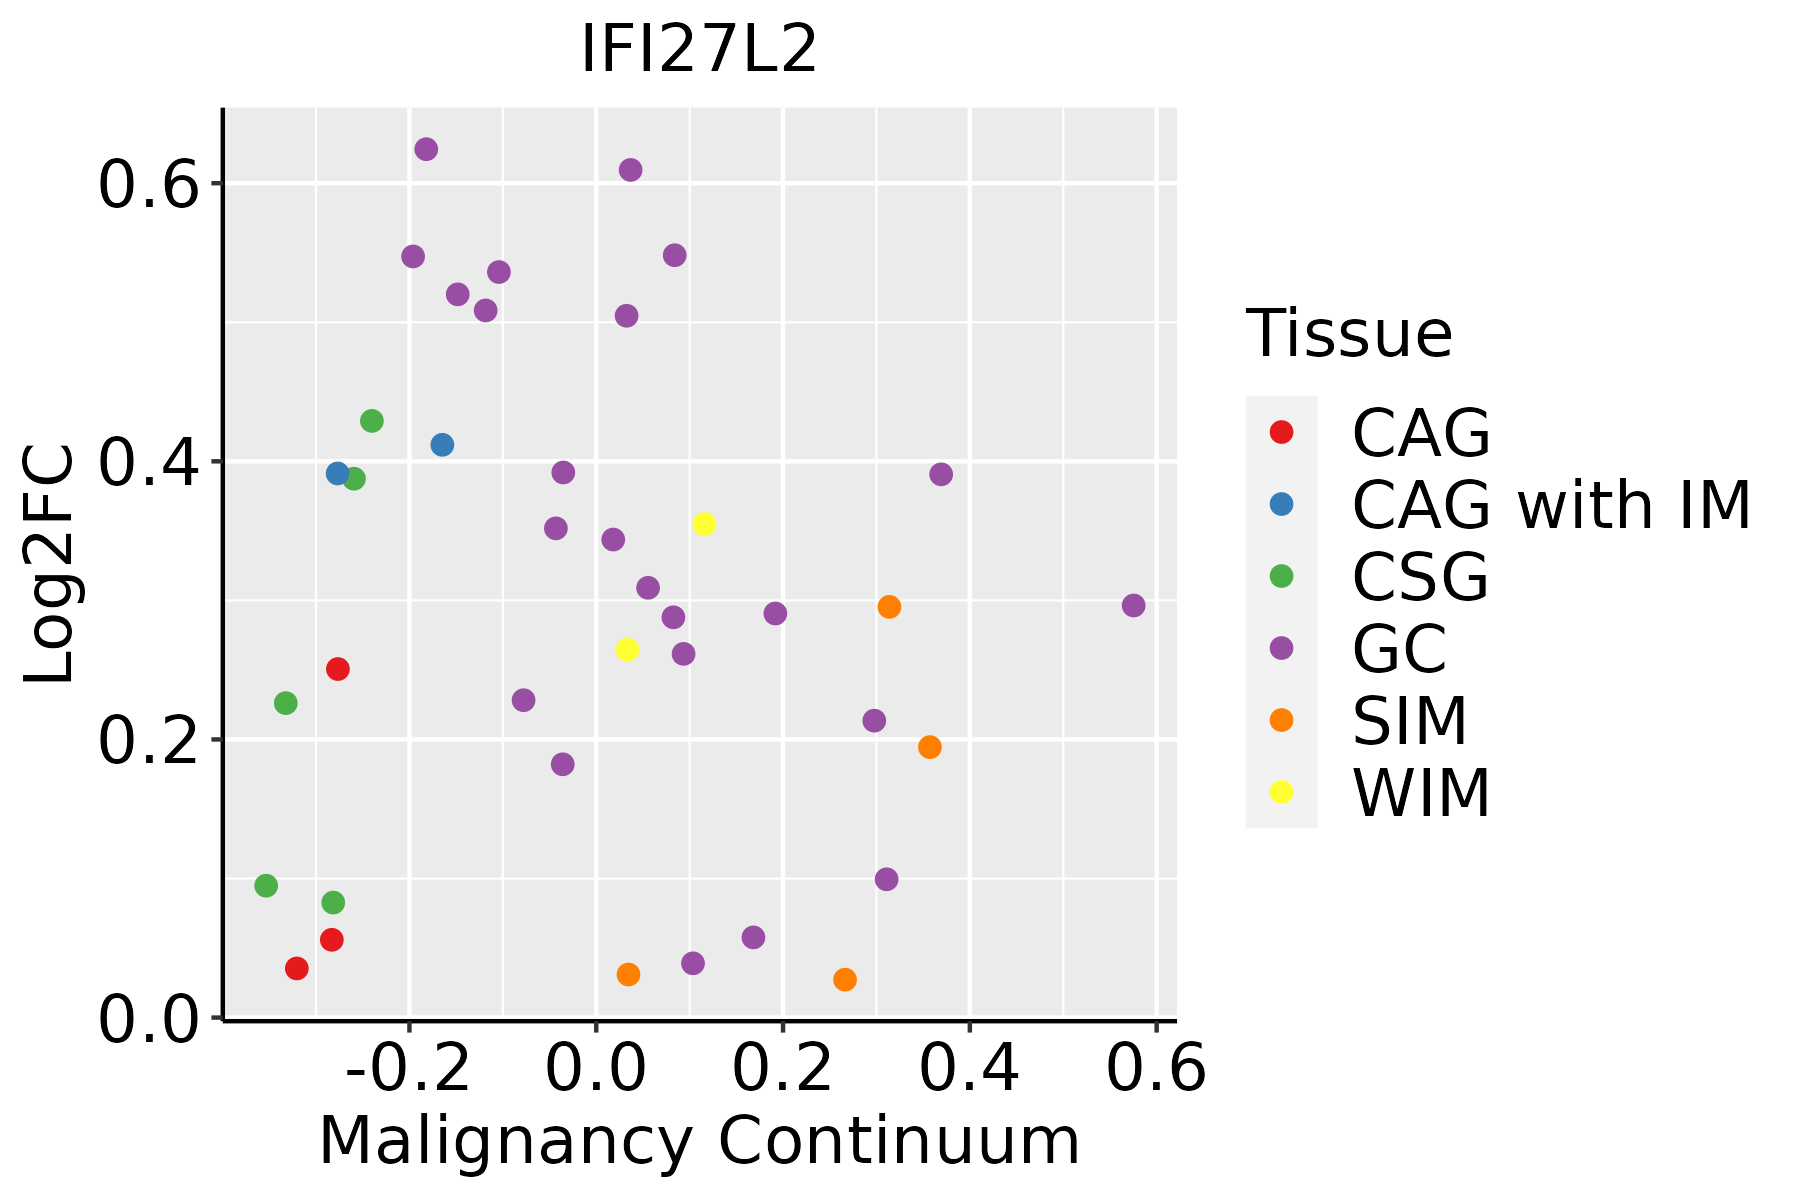 | CAG: Chronic atrophic gastritis |
| CAG with IM: Chronic atrophic gastritis with intestinal metaplasia | ||
| CSG: Chronic superficial gastritis | ||
| GC: Gastric cancer | ||
| SIM: Severe intestinal metaplasia | ||
| WIM: Wild intestinal metaplasia | ||
| Liver |  | HCC: Hepatocellular carcinoma |
| NAFLD: Non-alcoholic fatty liver disease | ||
| Oral Cavity | 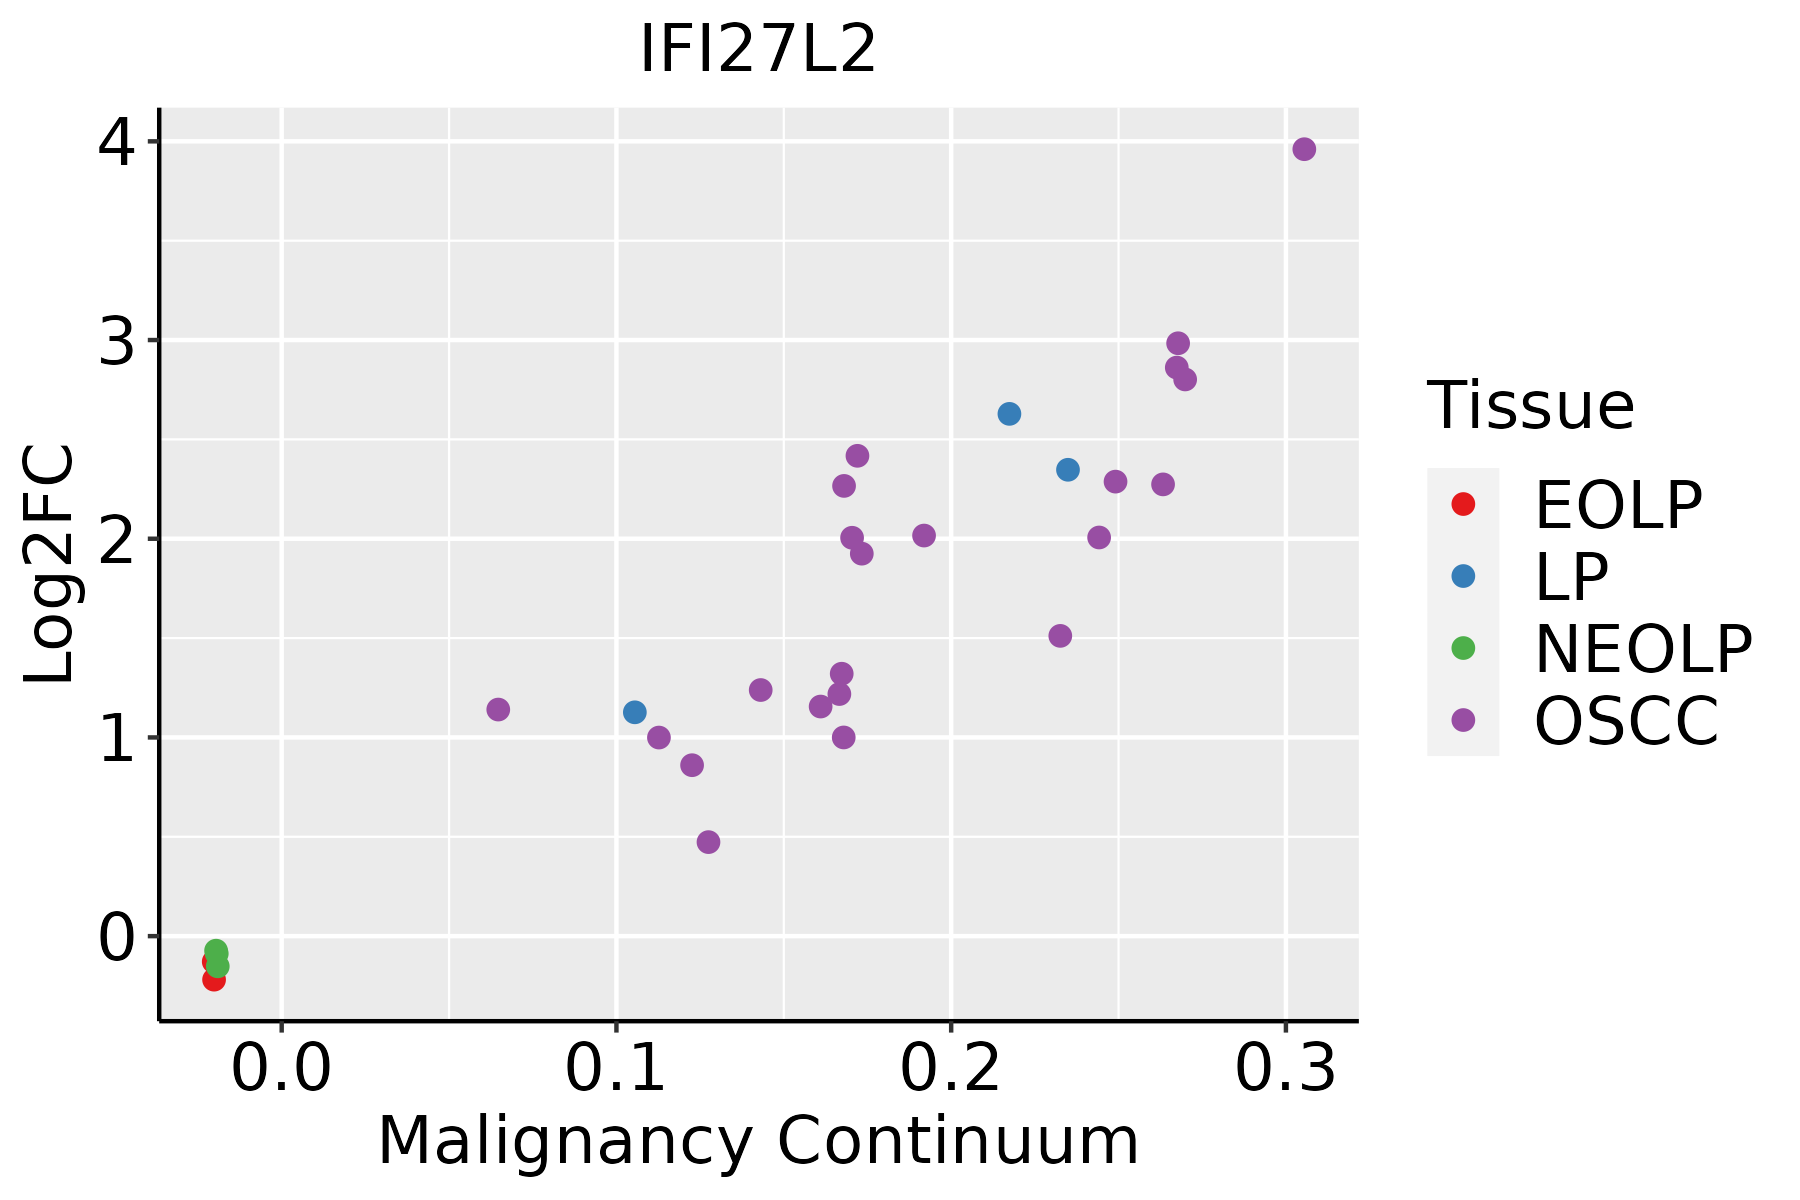 | EOLP: Erosive Oral lichen planus |
| LP: leukoplakia | ||
| NEOLP: Non-erosive oral lichen planus | ||
| OSCC: Oral squamous cell carcinoma | ||
| Skin | 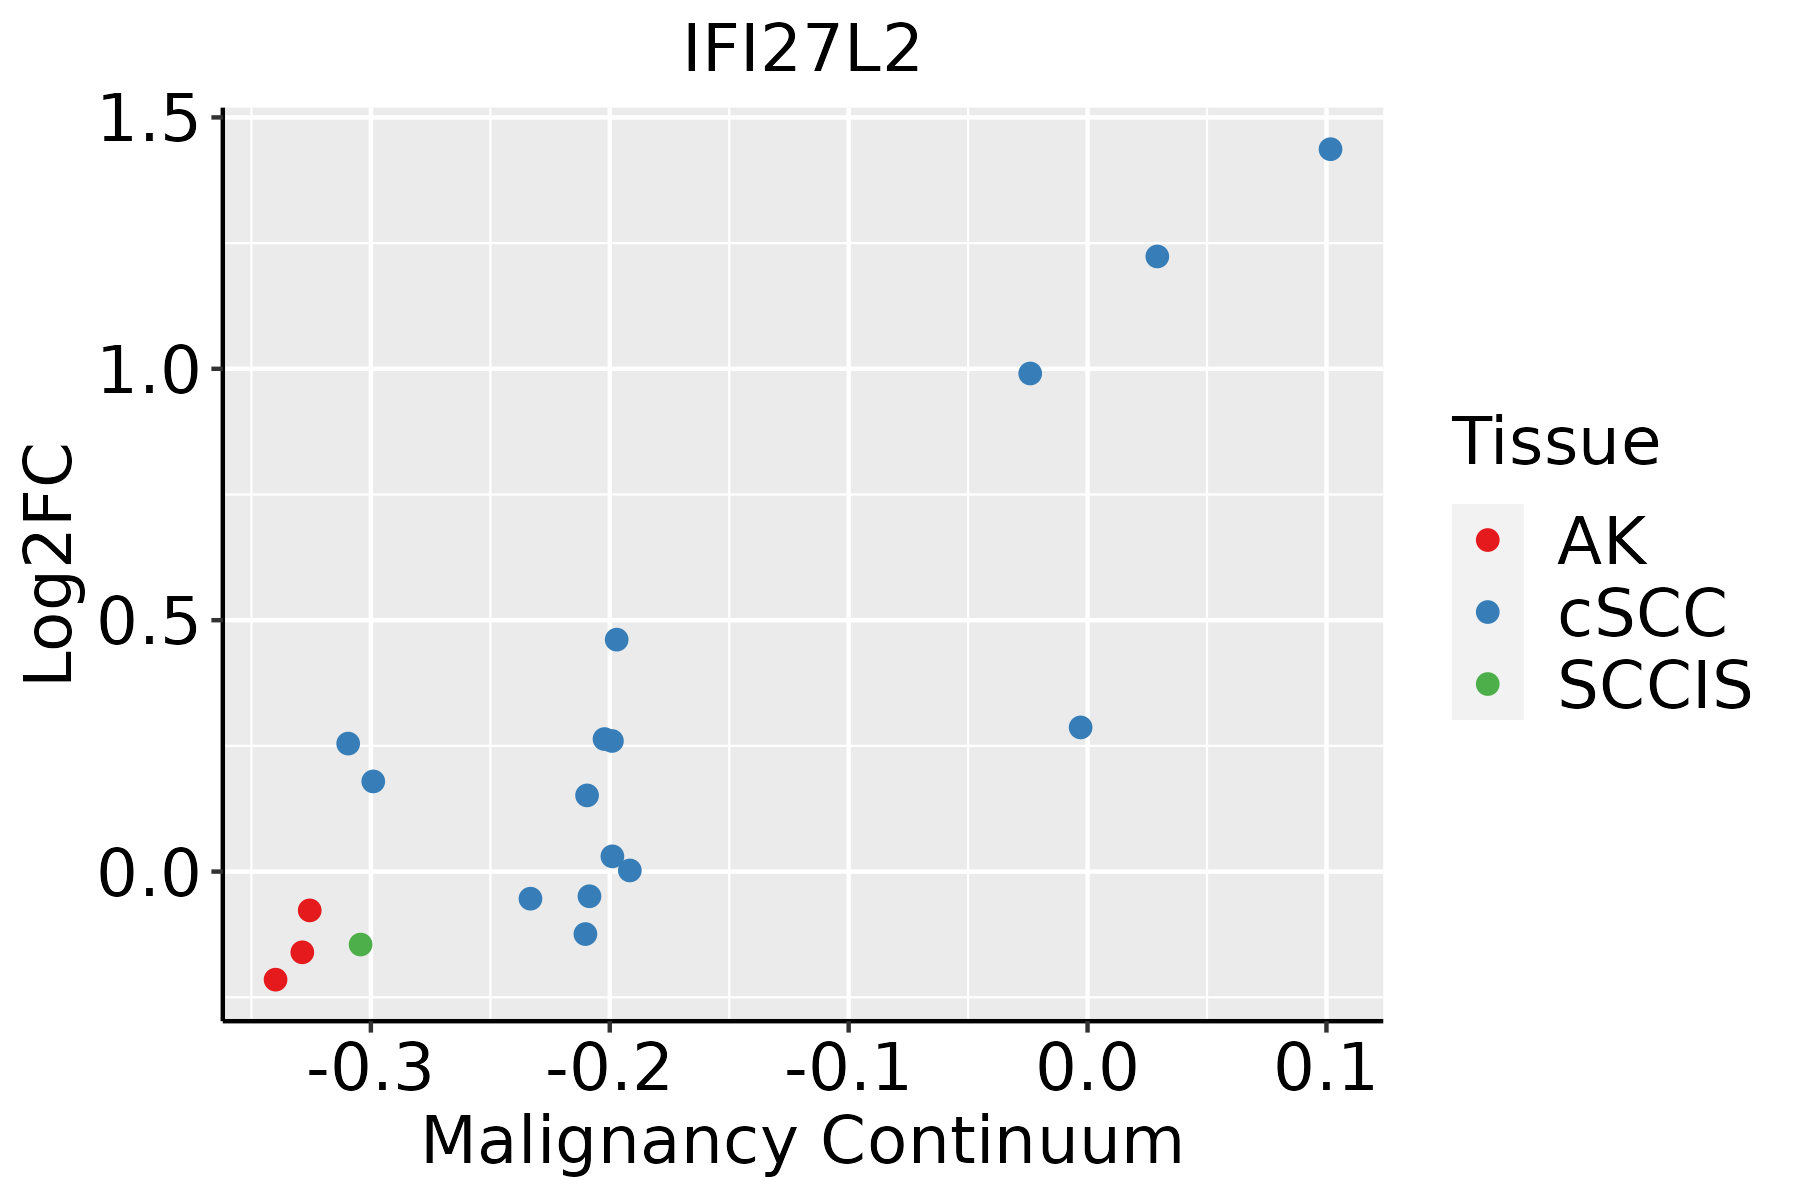 | AK: Actinic keratosis |
| cSCC: Cutaneous squamous cell carcinoma | ||
| SCCIS:squamous cell carcinoma in situ | ||
| Thyroid | 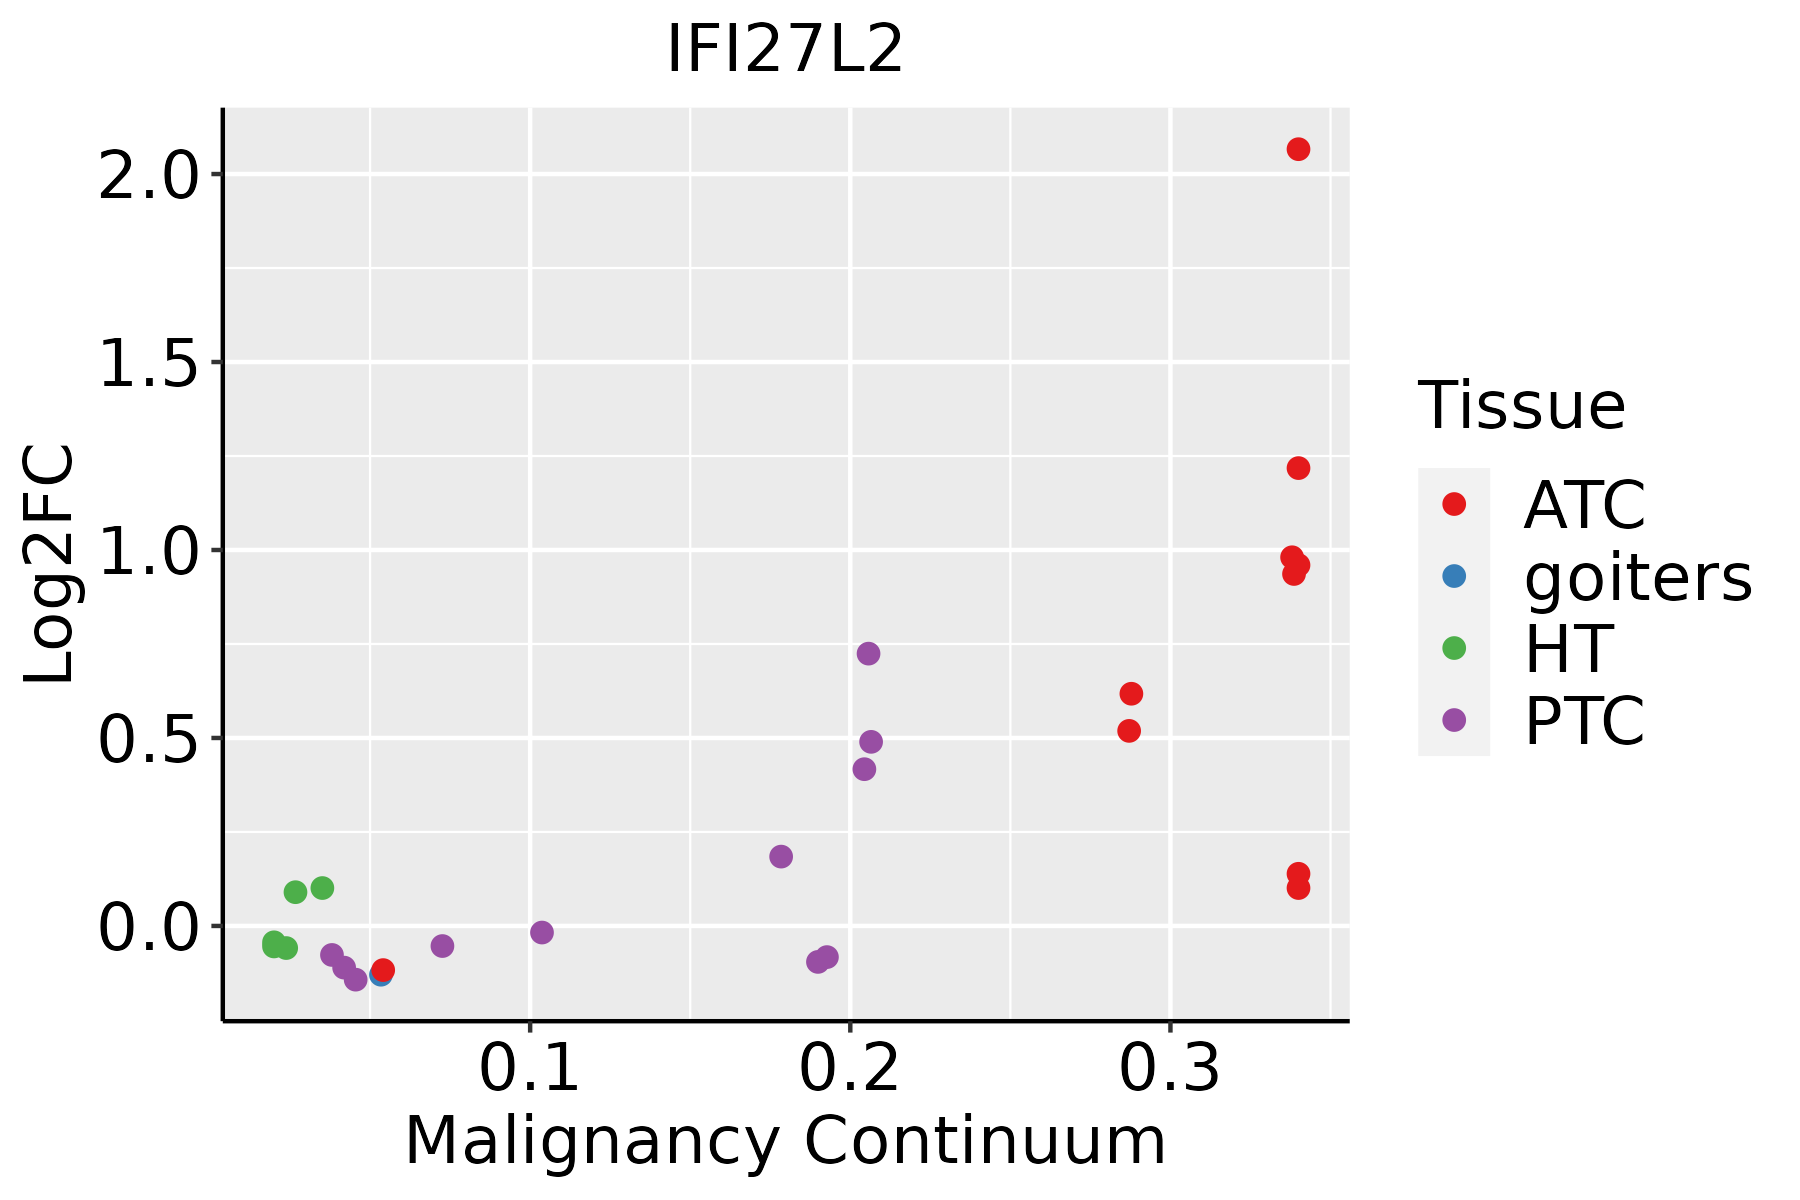 | ATC: Anaplastic thyroid cancer |
| HT: Hashimoto's thyroiditis | ||
| PTC: Papillary thyroid cancer |
| ∗log2FC in expression of this searched gene in stem-like cells from each diseased tissue sample relative to stem-like cells in normal samples in each tissue plotted against the malignancy continuum. Samples are colored based on if they are from different disease stage. |
Top |
Malignant transformation related pathway analysis |
| Find out the enriched GO biological processes and KEGG pathways involved in transition from healthy to precancer to cancer |
| Tissue | Disease Stage | Enriched GO biological Processes |
| Colorectum | AD |  |
| Colorectum | SER |  |
| Colorectum | MSS |  |
| Colorectum | MSI-H |  |
| Colorectum | FAP |  |
| ∗Top 15 enriched GO BP terms are showed in the bar plot of each disease state in each tissue. Each row represents a significant GO biological process which is colored according to the -log10(p.adjust). |
| Page: 1 2 3 4 5 6 7 8 9 |
| GO ID | Tissue | Disease Stage | Description | Gene Ratio | Bg Ratio | pvalue | p.adjust | Count |
| Page: 1 |
| Pathway ID | Tissue | Disease Stage | Description | Gene Ratio | Bg Ratio | pvalue | p.adjust | qvalue | Count |
| Page: 1 |
Top |
Cell-cell communication analysis |
| Identification of potential cell-cell interactions between two cell types and their ligand-receptor pairs for different disease states |
| Ligand | Receptor | LRpair | Pathway | Tissue | Disease Stage |
| Page: 1 |
Top |
Single-cell gene regulatory network inference analysis |
| Find out the significant the regulons (TFs) and the target genes of each regulon across cell types for different disease states |
| TF | Cell Type | Tissue | Disease Stage | Target Gene | RSS | Regulon Activity |
| ∗The dot plots of a searched regulon are shown for all cell subpopulations in each disease state of each tissue based on the regulon specific score inferred using pySCENIC and by calculating the average expression. |
| Page: 1 |
Top |
Somatic mutation of malignant transformation related genes |
| Annotation of somatic variants for genes involved in malignant transformation |
| Hugo Symbol | Variant Class | Variant Classification | dbSNP RS | HGVSc | HGVSp | HGVSp Short | SWISSPROT | BIOTYPE | SIFT | PolyPhen | Tumor Sample Barcode | Tissue | Histology | Sex | Age | Stage | Therapy Types | Drugs | Outcome |
| IFI27L2 | SNV | Missense_Mutation | novel | c.50N>T | p.Gly17Val | p.G17V | Q9H2X8 | protein_coding | tolerated(0.13) | benign(0.012) | TCGA-DS-A1OA-01 | Cervix | cervical & endocervical cancer | Female | >=65 | I/II | Chemotherapy | carboplatin | PD |
| IFI27L2 | SNV | Missense_Mutation | rs765630307 | c.35N>A | p.Gly12Glu | p.G12E | Q9H2X8 | protein_coding | deleterious(0) | probably_damaging(0.998) | TCGA-VS-A94W-01 | Cervix | cervical & endocervical cancer | Female | <65 | I/II | Chemotherapy | cisplatin | CR |
| IFI27L2 | SNV | Missense_Mutation | novel | c.274N>G | p.Asn92Asp | p.N92D | Q9H2X8 | protein_coding | tolerated(0.55) | benign(0) | TCGA-AA-3966-01 | Colorectum | colon adenocarcinoma | Female | >=65 | I/II | Unknown | Unknown | SD |
| IFI27L2 | SNV | Missense_Mutation | c.320N>C | p.Asp107Ala | p.D107A | Q9H2X8 | protein_coding | tolerated(0.4) | benign(0.011) | TCGA-AD-6964-01 | Colorectum | colon adenocarcinoma | Male | <65 | III/IV | Chemotherapy | folfox | PD | |
| IFI27L2 | SNV | Missense_Mutation | rs763009285 | c.133N>A | p.Ala45Thr | p.A45T | Q9H2X8 | protein_coding | tolerated(0.18) | possibly_damaging(0.803) | TCGA-AD-A5EJ-01 | Colorectum | colon adenocarcinoma | Female | >=65 | I/II | Unknown | Unknown | SD |
| IFI27L2 | SNV | Missense_Mutation | novel | c.95G>A | p.Gly32Glu | p.G32E | Q9H2X8 | protein_coding | deleterious(0.01) | possibly_damaging(0.765) | TCGA-EI-6506-01 | Colorectum | rectum adenocarcinoma | Female | >=65 | I/II | Unknown | Unknown | SD |
| IFI27L2 | SNV | Missense_Mutation | rs774005783 | c.53C>T | p.Ala18Val | p.A18V | Q9H2X8 | protein_coding | deleterious(0.01) | benign(0.271) | TCGA-EI-6507-01 | Colorectum | rectum adenocarcinoma | Male | <65 | I/II | Unknown | Unknown | SD |
| IFI27L2 | SNV | Missense_Mutation | novel | c.263C>T | p.Ala88Val | p.A88V | Q9H2X8 | protein_coding | deleterious(0.01) | probably_damaging(0.945) | TCGA-EI-6917-01 | Colorectum | rectum adenocarcinoma | Male | <65 | III/IV | Chemotherapy | 5fluorouracil+oxaciplatina+l-folinian | SD |
| IFI27L2 | SNV | Missense_Mutation | rs755537199 | c.100G>A | p.Ala34Thr | p.A34T | Q9H2X8 | protein_coding | tolerated(0.27) | probably_damaging(0.999) | TCGA-A5-A0G2-01 | Endometrium | uterine corpus endometrioid carcinoma | Female | <65 | III/IV | Unknown | Unknown | SD |
| IFI27L2 | SNV | Missense_Mutation | rs200116572 | c.104C>T | p.Ala35Val | p.A35V | Q9H2X8 | protein_coding | deleterious(0.05) | probably_damaging(0.94) | TCGA-A5-A1OF-01 | Endometrium | uterine corpus endometrioid carcinoma | Female | <65 | I/II | Unknown | Unknown | SD |
| Page: 1 2 |
Top |
Related drugs of malignant transformation related genes |
| Identification of chemicals and drugs interact with genes involved in malignant transfromation |
| (DGIdb 4.0) |
| Entrez ID | Symbol | Category | Interaction Types | Drug Claim Name | Drug Name | PMIDs |
| Page: 1 |

Copyright 2023-Present -The University of Texas Health Science Center at Houston |