
|
|||||
|
 | |
| |
| |
| |
| |
| |
|
Gene: IFI27 |
Gene summary for IFI27 |
| Gene information | Species | Human | Gene symbol | IFI27 | Gene ID | 3429 |
| Gene name | interferon alpha inducible protein 27 | |
| Gene Alias | FAM14D | |
| Cytomap | 14q32.12 | |
| Gene Type | protein-coding | GO ID | GO:0000122 | UniProtAcc | A8K0H0 |
Top |
Malignant transformation analysis |
| Identification of the aberrant gene expression in precancerous and cancerous lesions by comparing the gene expression of stem-like cells in diseased tissues with normal stem cells |
| Entrez ID | Symbol | Replicates | Species | Organ | Tissue | Adj P-value | Log2FC | Malignancy |
| 3429 | IFI27 | GSM4909281 | Human | Breast | IDC | 3.10e-136 | 1.91e+00 | 0.21 |
| 3429 | IFI27 | GSM4909282 | Human | Breast | IDC | 7.31e-08 | 3.76e-01 | -0.0288 |
| 3429 | IFI27 | GSM4909285 | Human | Breast | IDC | 3.06e-05 | 3.84e-01 | 0.21 |
| 3429 | IFI27 | GSM4909287 | Human | Breast | IDC | 1.81e-51 | 1.30e+00 | 0.2057 |
| 3429 | IFI27 | GSM4909288 | Human | Breast | IDC | 4.22e-09 | 1.03e+00 | 0.0988 |
| 3429 | IFI27 | GSM4909290 | Human | Breast | IDC | 1.60e-66 | 1.55e+00 | 0.2096 |
| 3429 | IFI27 | GSM4909294 | Human | Breast | IDC | 1.65e-06 | 4.77e-01 | 0.2022 |
| 3429 | IFI27 | GSM4909297 | Human | Breast | IDC | 5.88e-03 | 4.21e-01 | 0.1517 |
| 3429 | IFI27 | GSM4909307 | Human | Breast | IDC | 9.24e-100 | 1.71e+00 | 0.1569 |
| 3429 | IFI27 | GSM4909308 | Human | Breast | IDC | 7.77e-108 | 1.76e+00 | 0.158 |
| 3429 | IFI27 | GSM4909309 | Human | Breast | IDC | 3.93e-44 | 1.27e+00 | 0.0483 |
| 3429 | IFI27 | GSM4909315 | Human | Breast | IDC | 1.60e-123 | 1.94e+00 | 0.21 |
| 3429 | IFI27 | GSM4909316 | Human | Breast | IDC | 6.23e-29 | 1.62e+00 | 0.21 |
| 3429 | IFI27 | GSM4909317 | Human | Breast | IDC | 7.85e-55 | 1.42e+00 | 0.1355 |
| 3429 | IFI27 | GSM4909318 | Human | Breast | IDC | 7.18e-38 | 1.99e+00 | 0.2031 |
| 3429 | IFI27 | GSM4909320 | Human | Breast | IDC | 5.69e-05 | 8.56e-01 | 0.1575 |
| 3429 | IFI27 | GSM4909321 | Human | Breast | IDC | 2.07e-160 | 2.15e+00 | 0.1559 |
| 3429 | IFI27 | M1 | Human | Breast | IDC | 4.51e-38 | 1.26e+00 | 0.1577 |
| 3429 | IFI27 | M2 | Human | Breast | IDC | 5.13e-07 | 9.94e-01 | 0.21 |
| 3429 | IFI27 | NCCBC5 | Human | Breast | DCIS | 3.41e-85 | 1.81e+00 | 0.2046 |
| Page: 1 2 3 4 5 6 7 8 9 10 11 12 13 14 |
| Tissue | Expression Dynamics | Abbreviation |
| Breast |  | IDC: Invasive ductal carcinoma |
| DCIS: Ductal carcinoma in situ | ||
| Precancer(BRCA1-mut): Precancerous lesion from BRCA1 mutation carriers | ||
| Cervix | 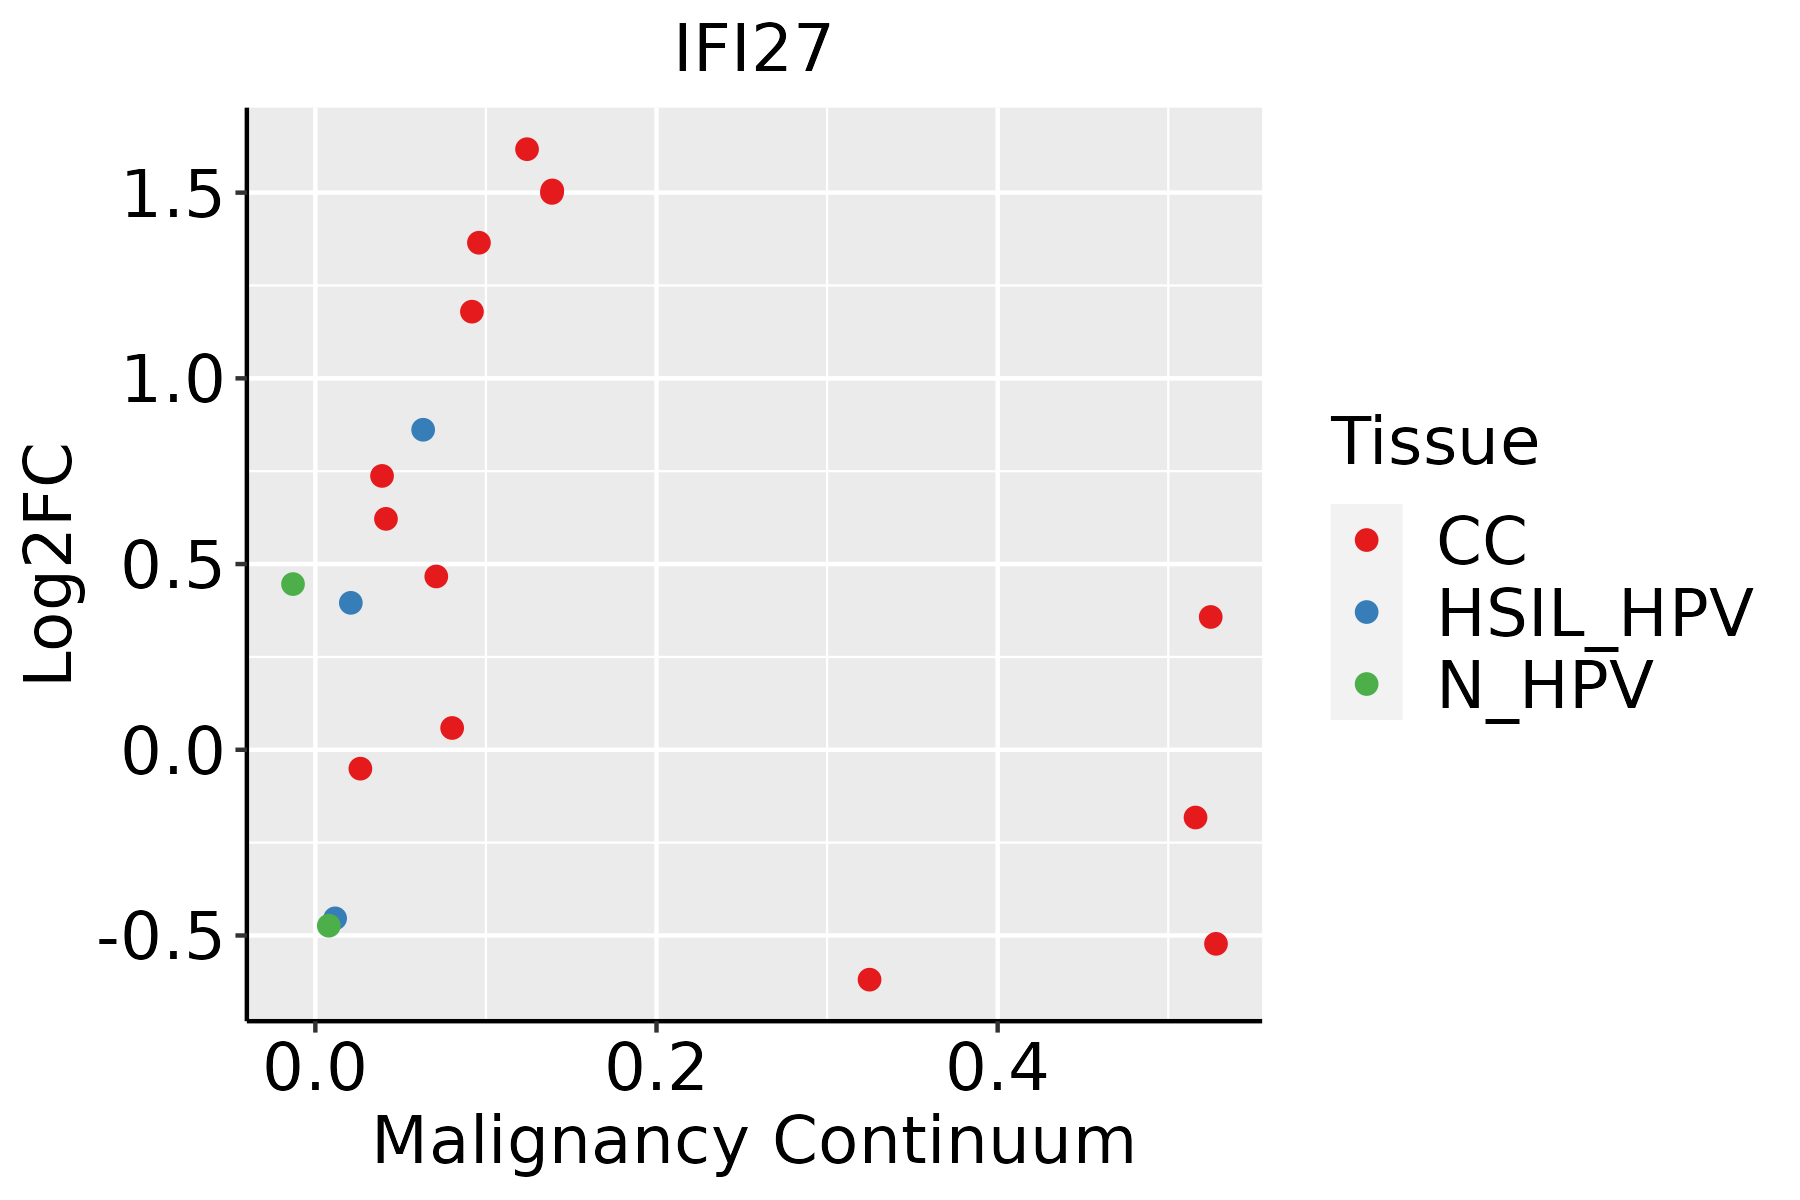 | CC: Cervix cancer |
| HSIL_HPV: HPV-infected high-grade squamous intraepithelial lesions | ||
| N_HPV: HPV-infected normal cervix | ||
| Colorectum (GSE201348) |  | FAP: Familial adenomatous polyposis |
| CRC: Colorectal cancer | ||
| Colorectum (HTA11) |  | AD: Adenomas |
| SER: Sessile serrated lesions | ||
| MSI-H: Microsatellite-high colorectal cancer | ||
| MSS: Microsatellite stable colorectal cancer | ||
| Endometrium | 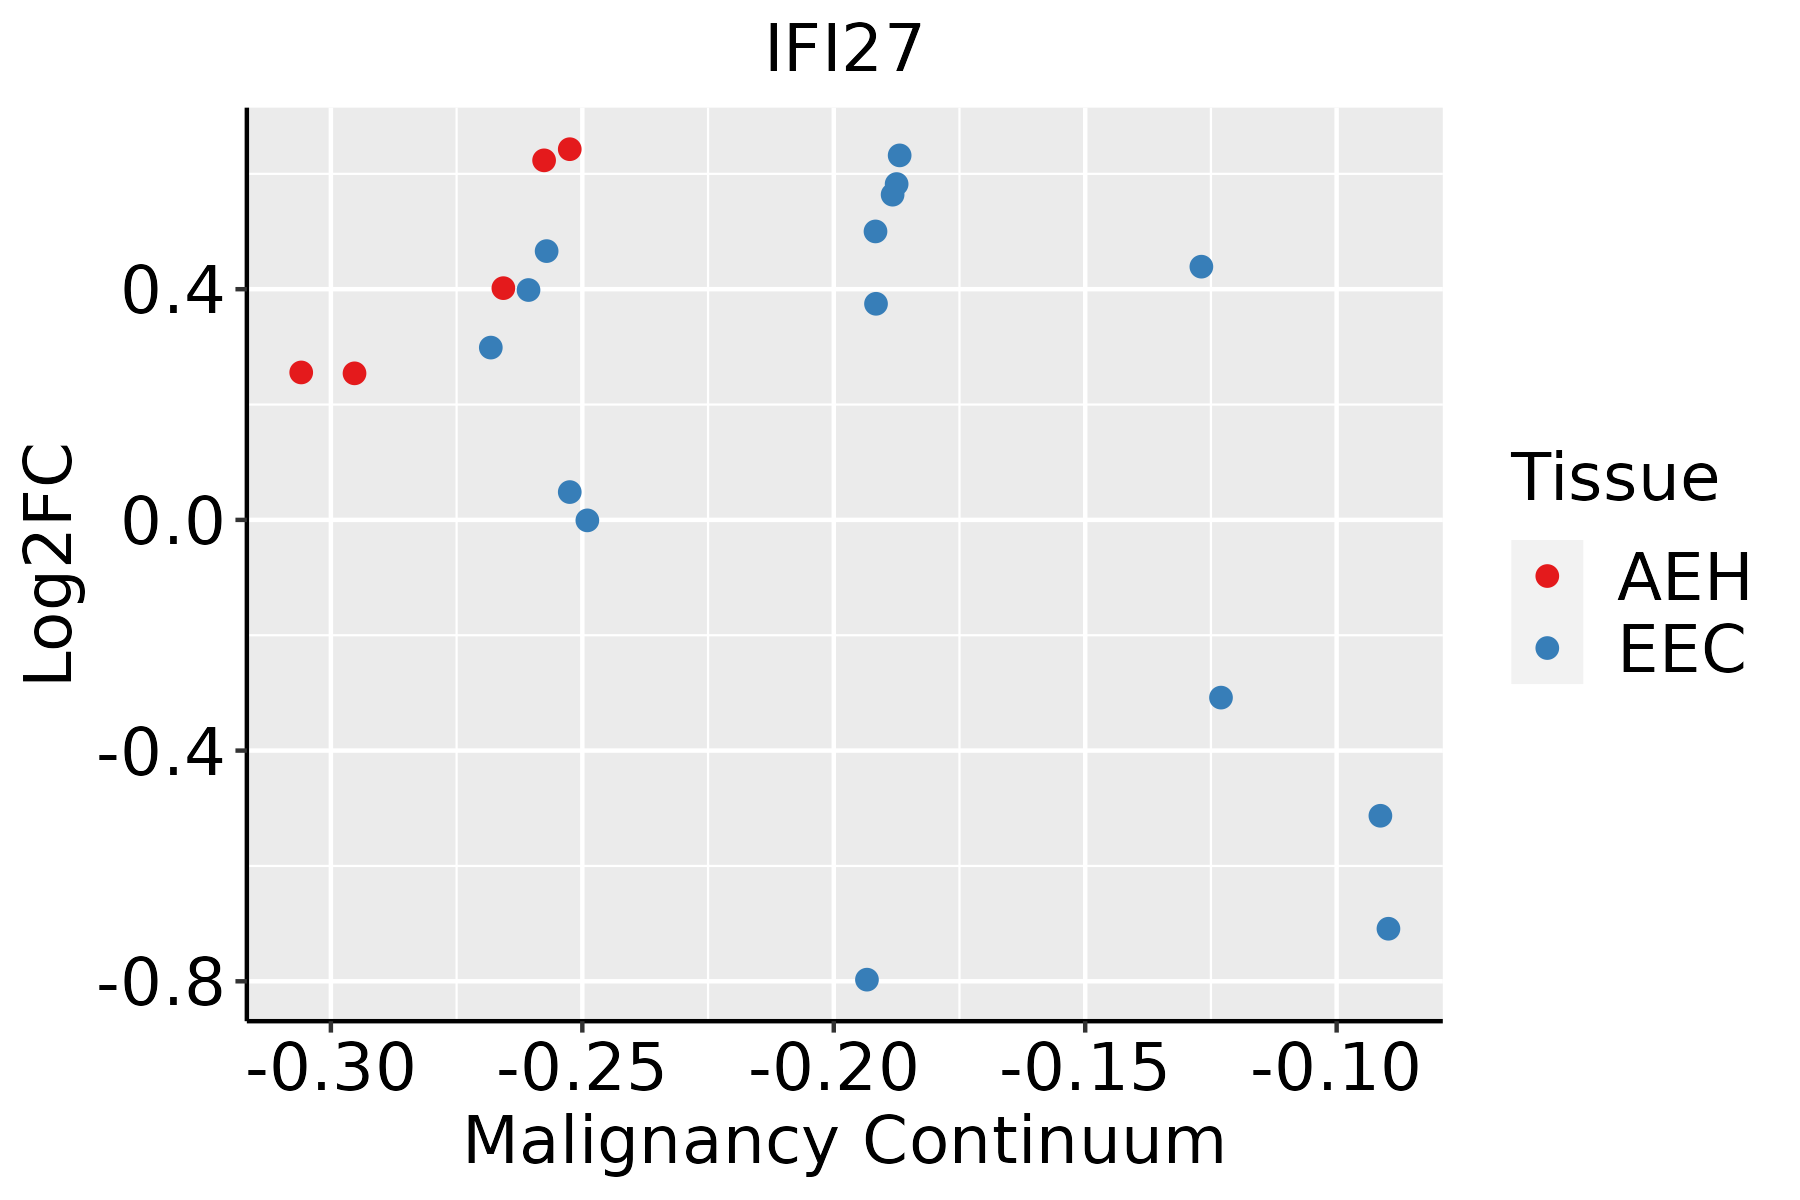 | AEH: Atypical endometrial hyperplasia |
| EEC: Endometrioid Cancer | ||
| Esophagus | 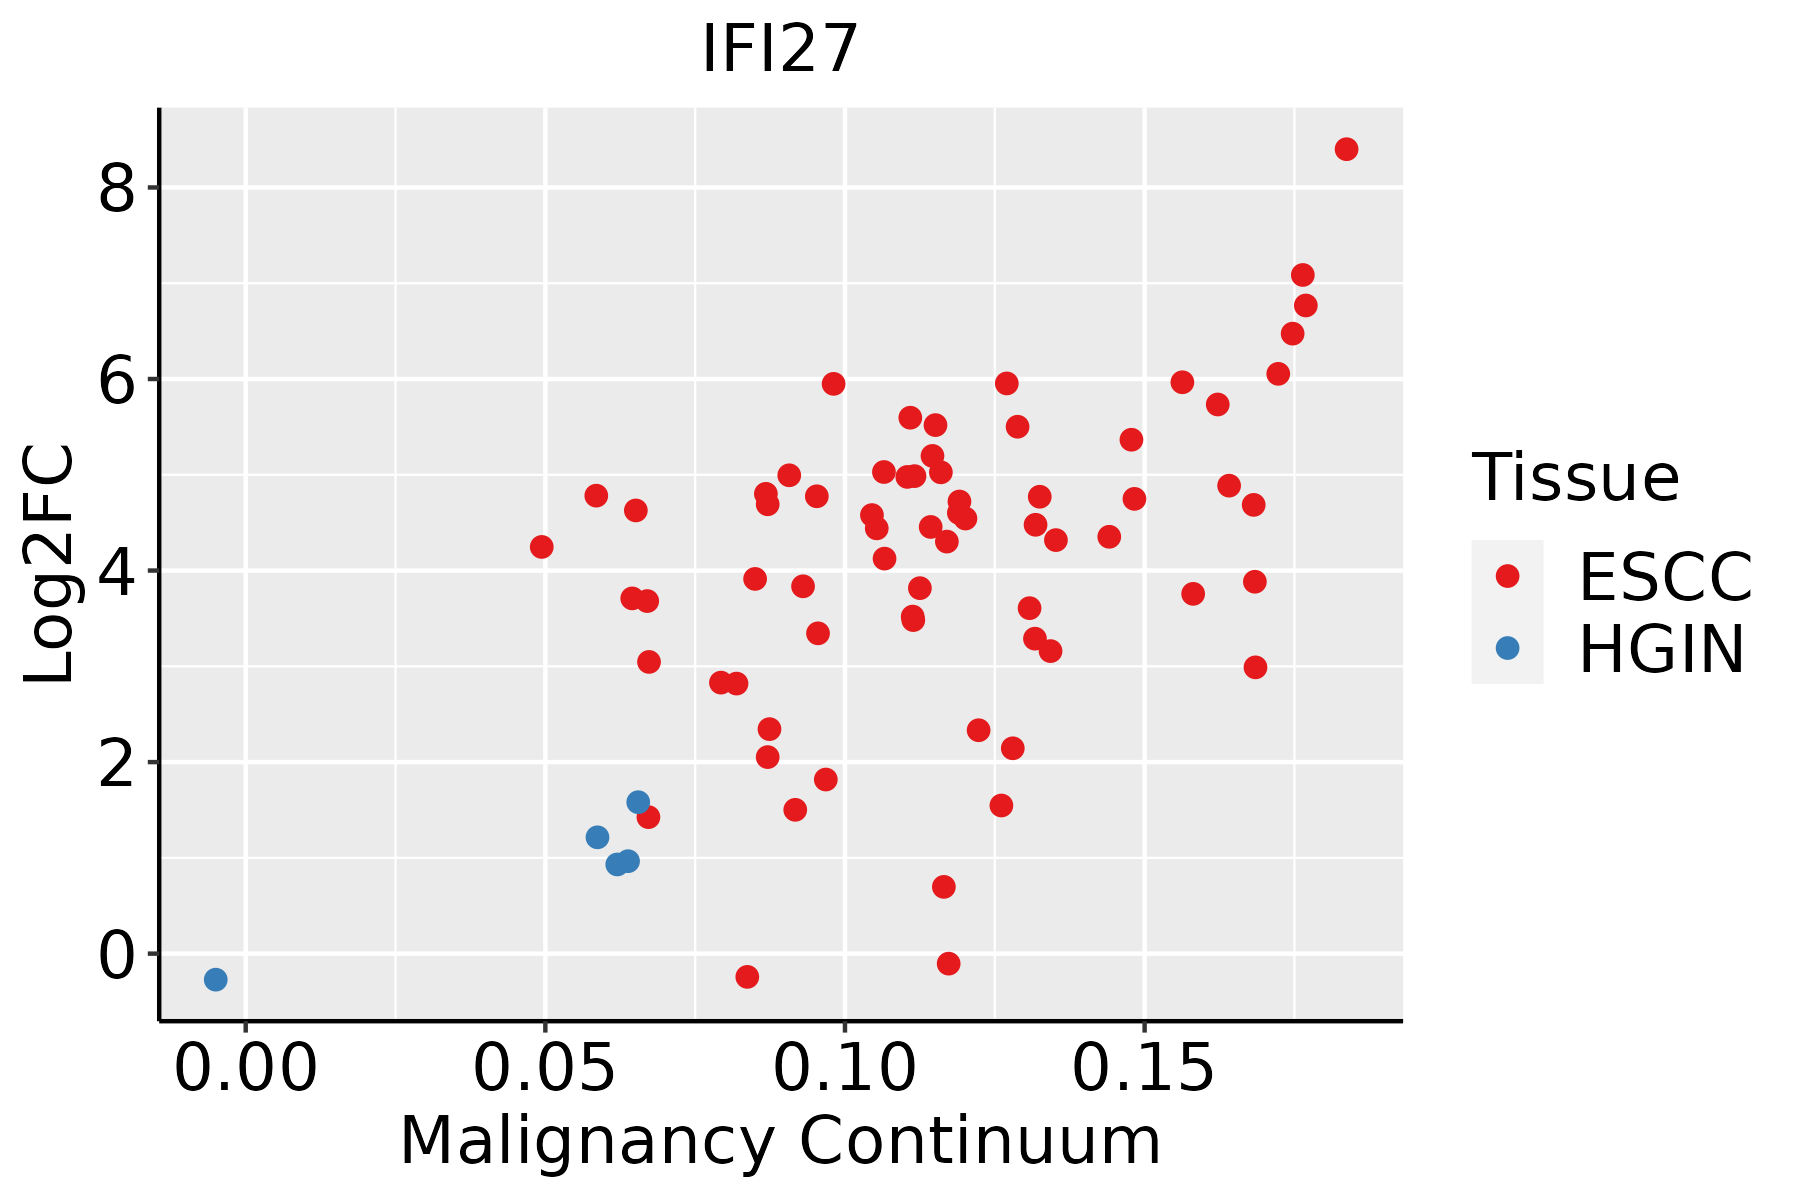 | ESCC: Esophageal squamous cell carcinoma |
| HGIN: High-grade intraepithelial neoplasias | ||
| LGIN: Low-grade intraepithelial neoplasias | ||
| GC | 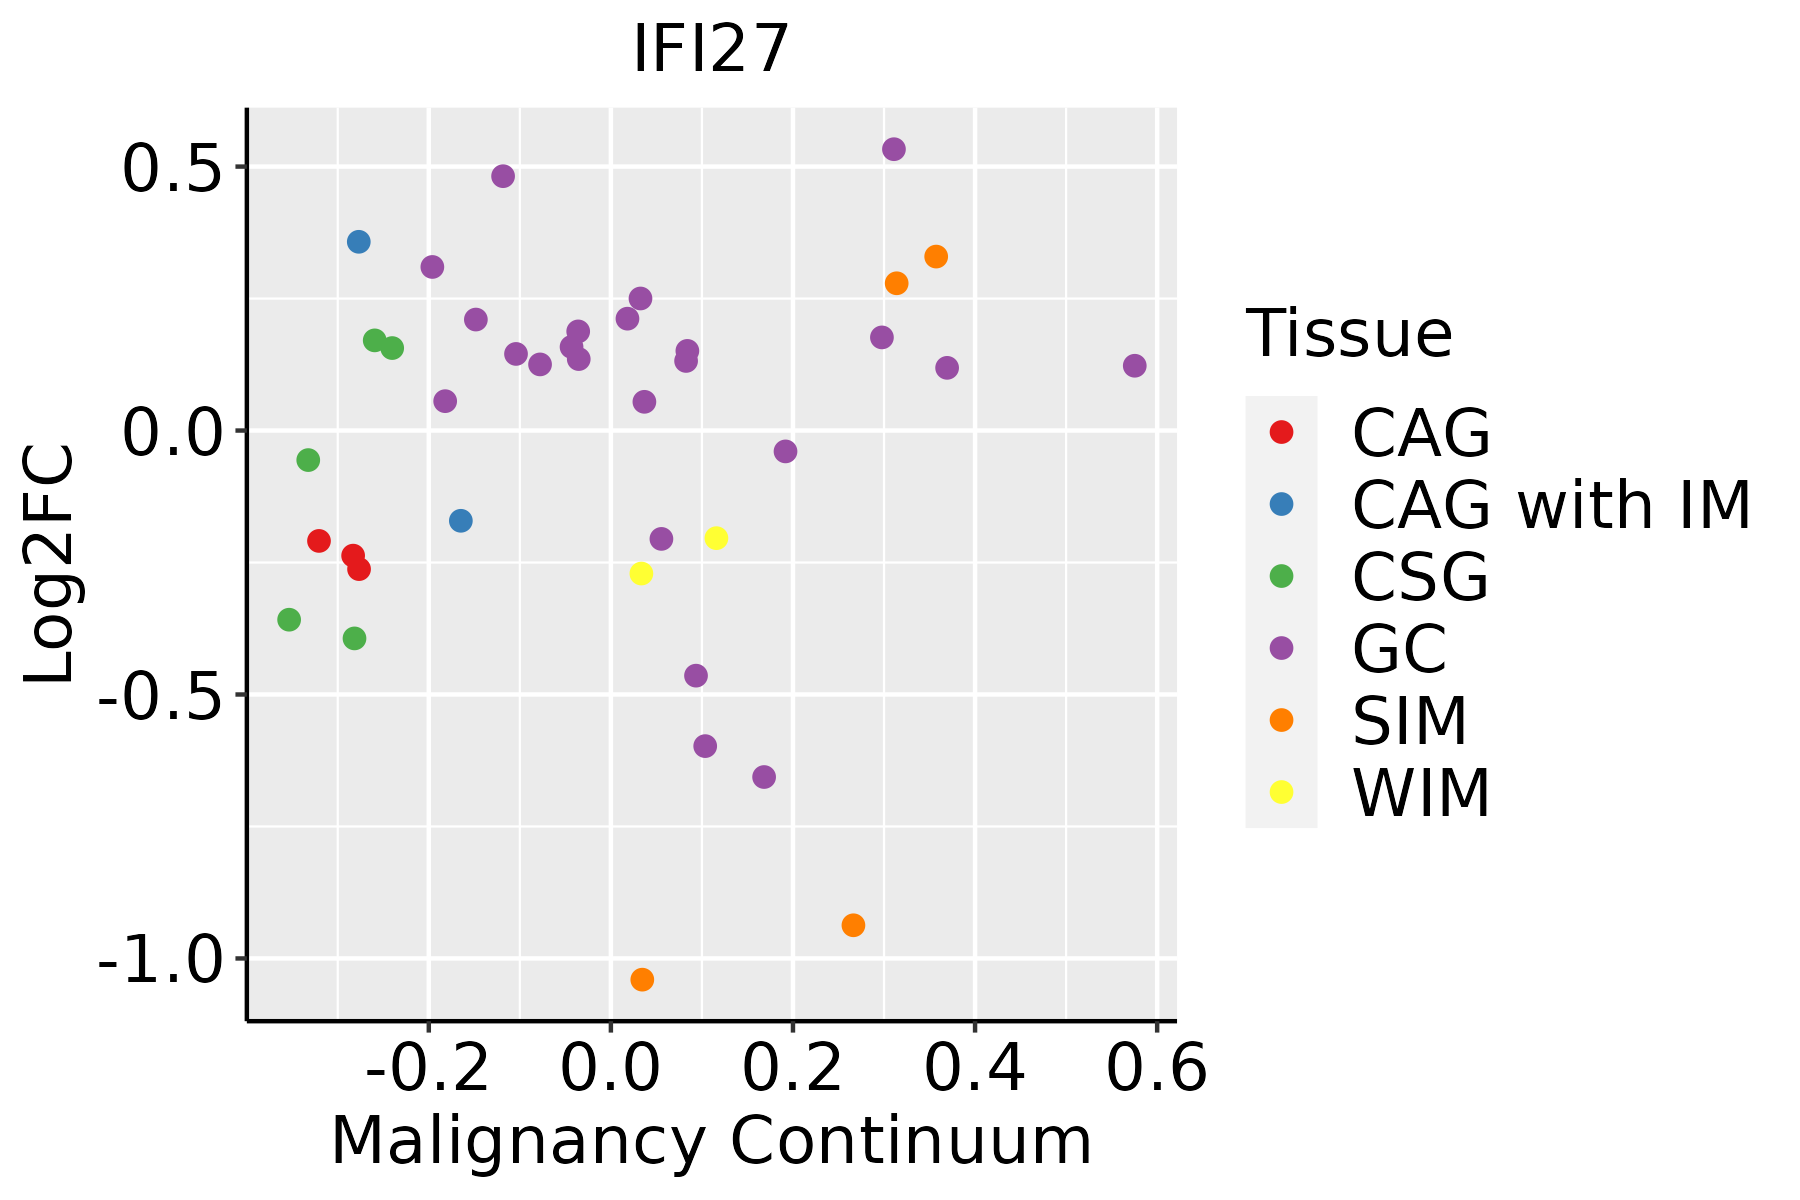 | CAG: Chronic atrophic gastritis |
| CAG with IM: Chronic atrophic gastritis with intestinal metaplasia | ||
| CSG: Chronic superficial gastritis | ||
| GC: Gastric cancer | ||
| SIM: Severe intestinal metaplasia | ||
| WIM: Wild intestinal metaplasia | ||
| Liver | 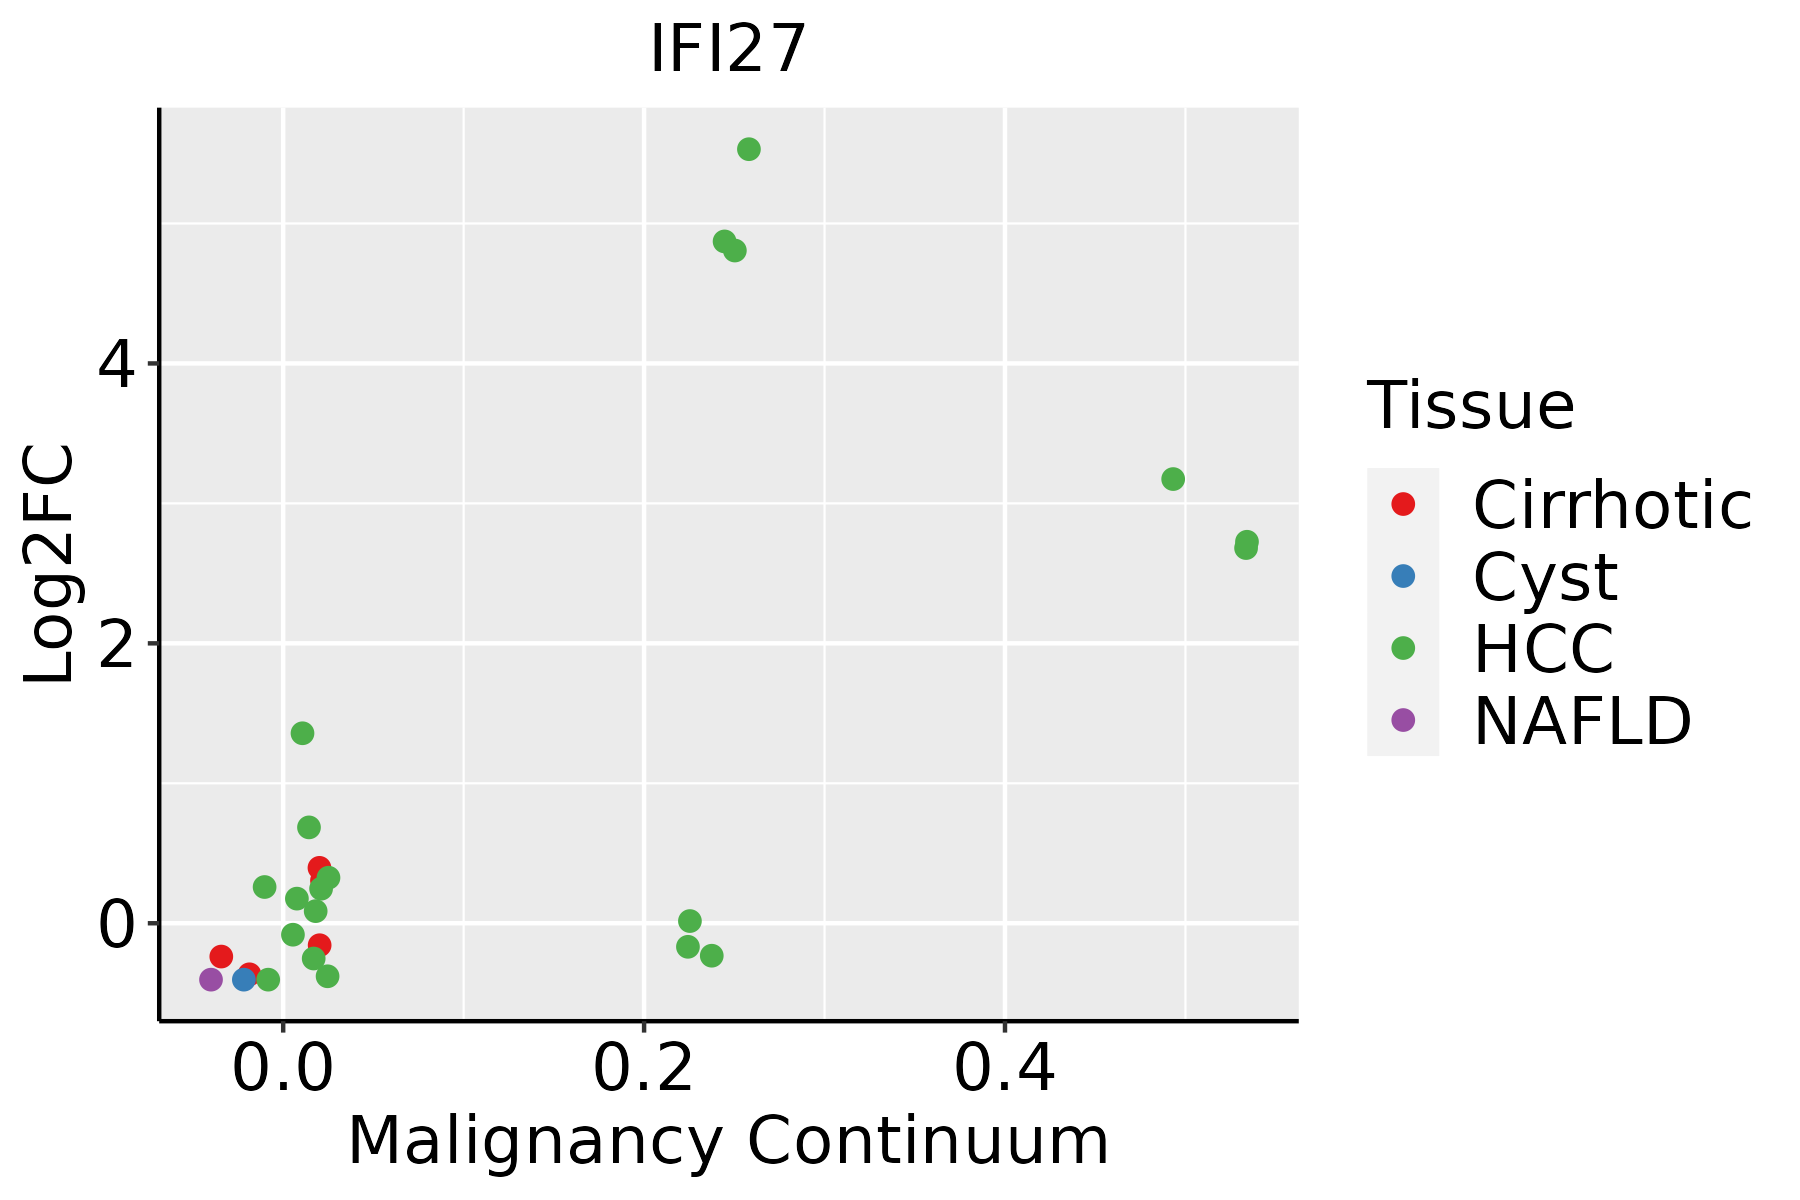 | HCC: Hepatocellular carcinoma |
| NAFLD: Non-alcoholic fatty liver disease | ||
| Lung | 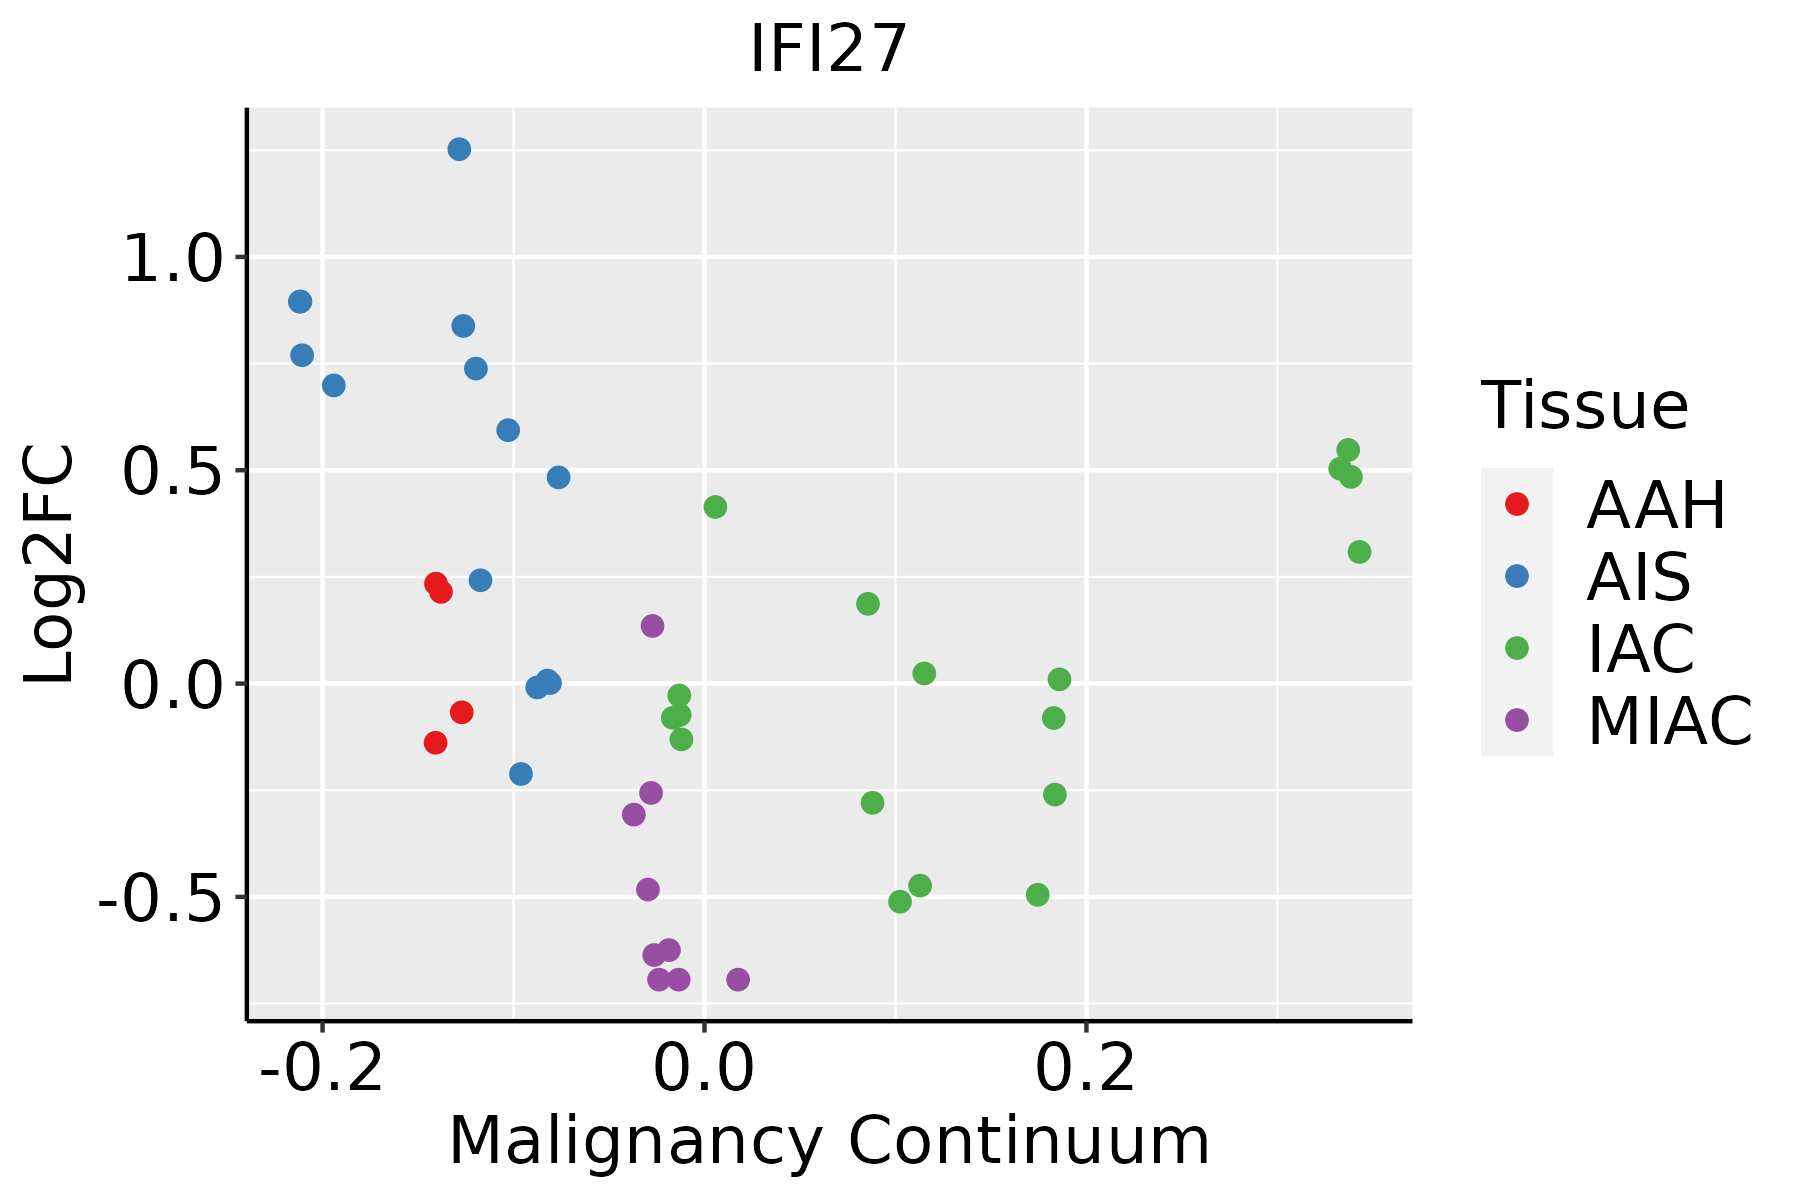 | AAH: Atypical adenomatous hyperplasia |
| AIS: Adenocarcinoma in situ | ||
| IAC: Invasive lung adenocarcinoma | ||
| MIA: Minimally invasive adenocarcinoma | ||
| Oral Cavity | 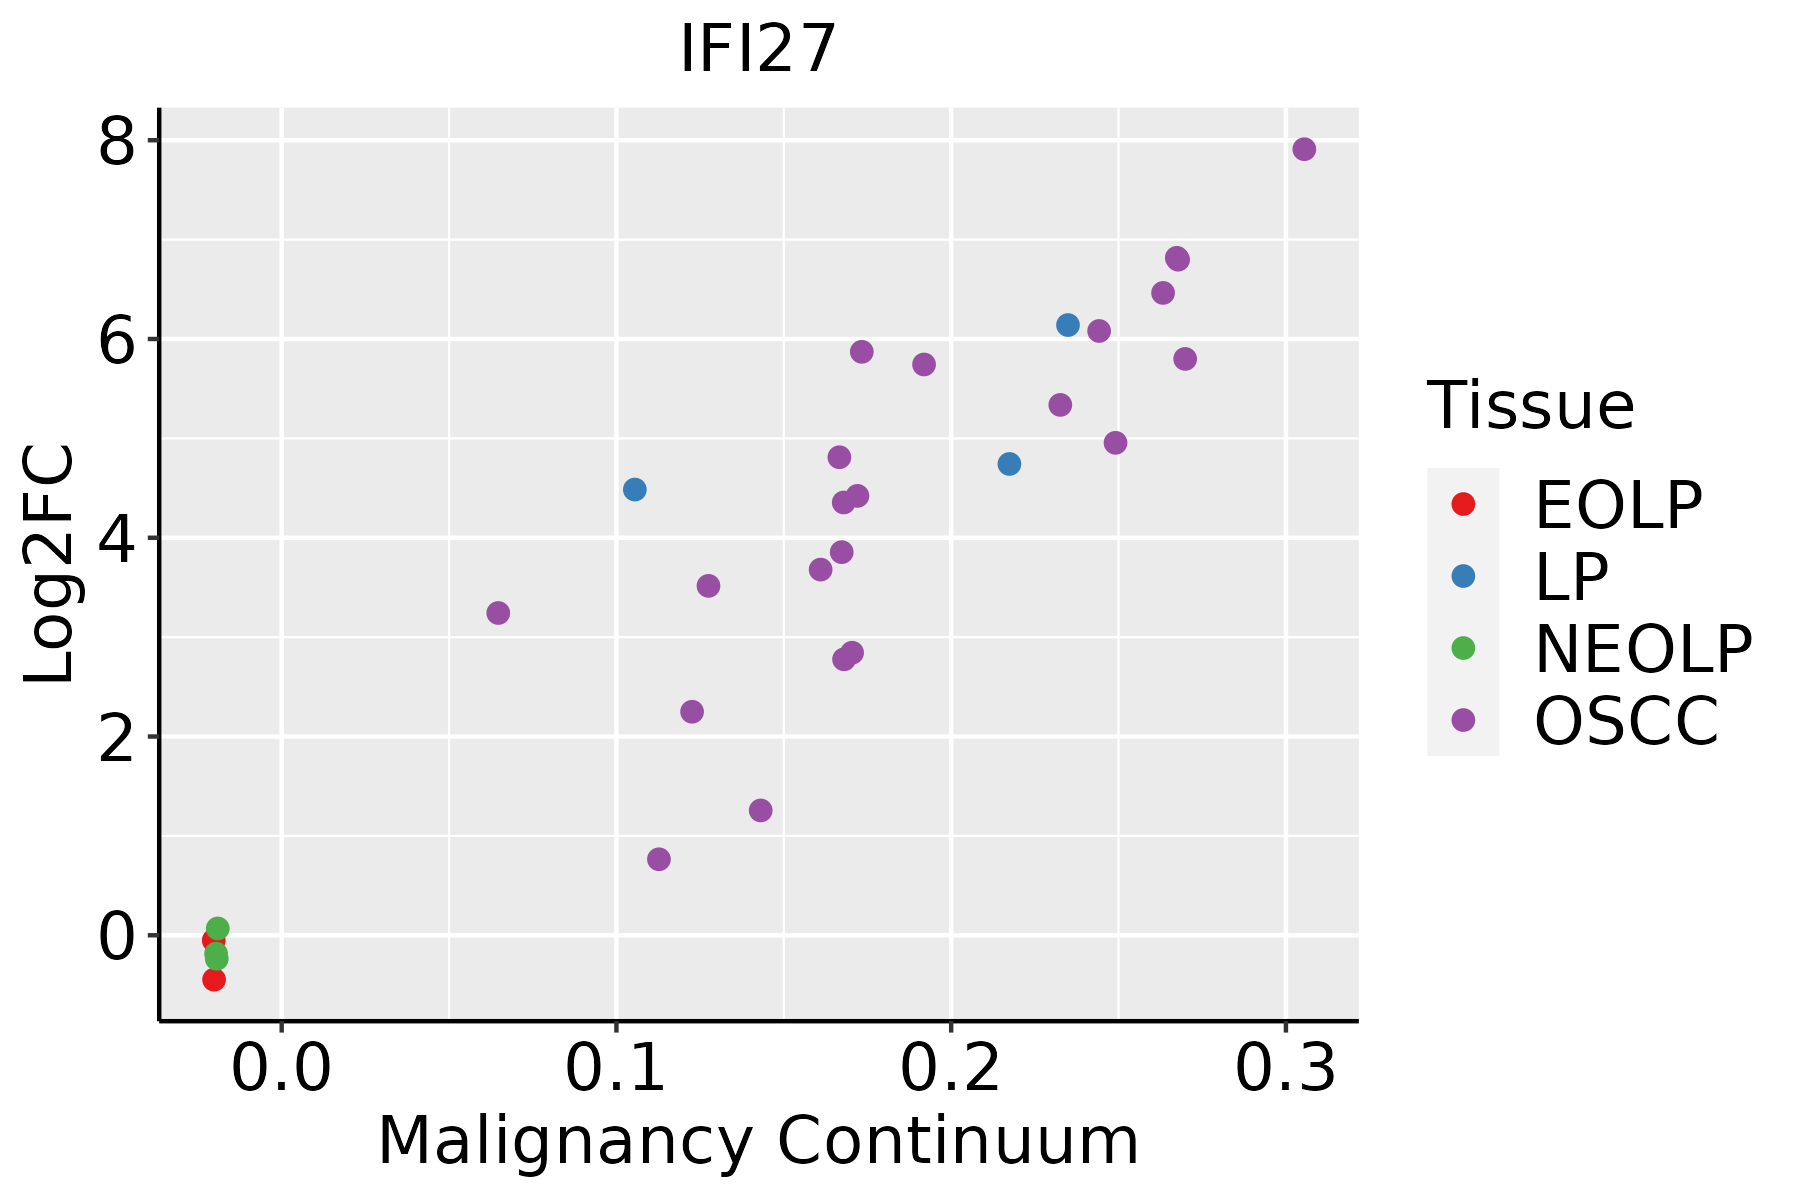 | EOLP: Erosive Oral lichen planus |
| LP: leukoplakia | ||
| NEOLP: Non-erosive oral lichen planus | ||
| OSCC: Oral squamous cell carcinoma | ||
| Skin |  | AK: Actinic keratosis |
| cSCC: Cutaneous squamous cell carcinoma | ||
| SCCIS:squamous cell carcinoma in situ | ||
| Thyroid | 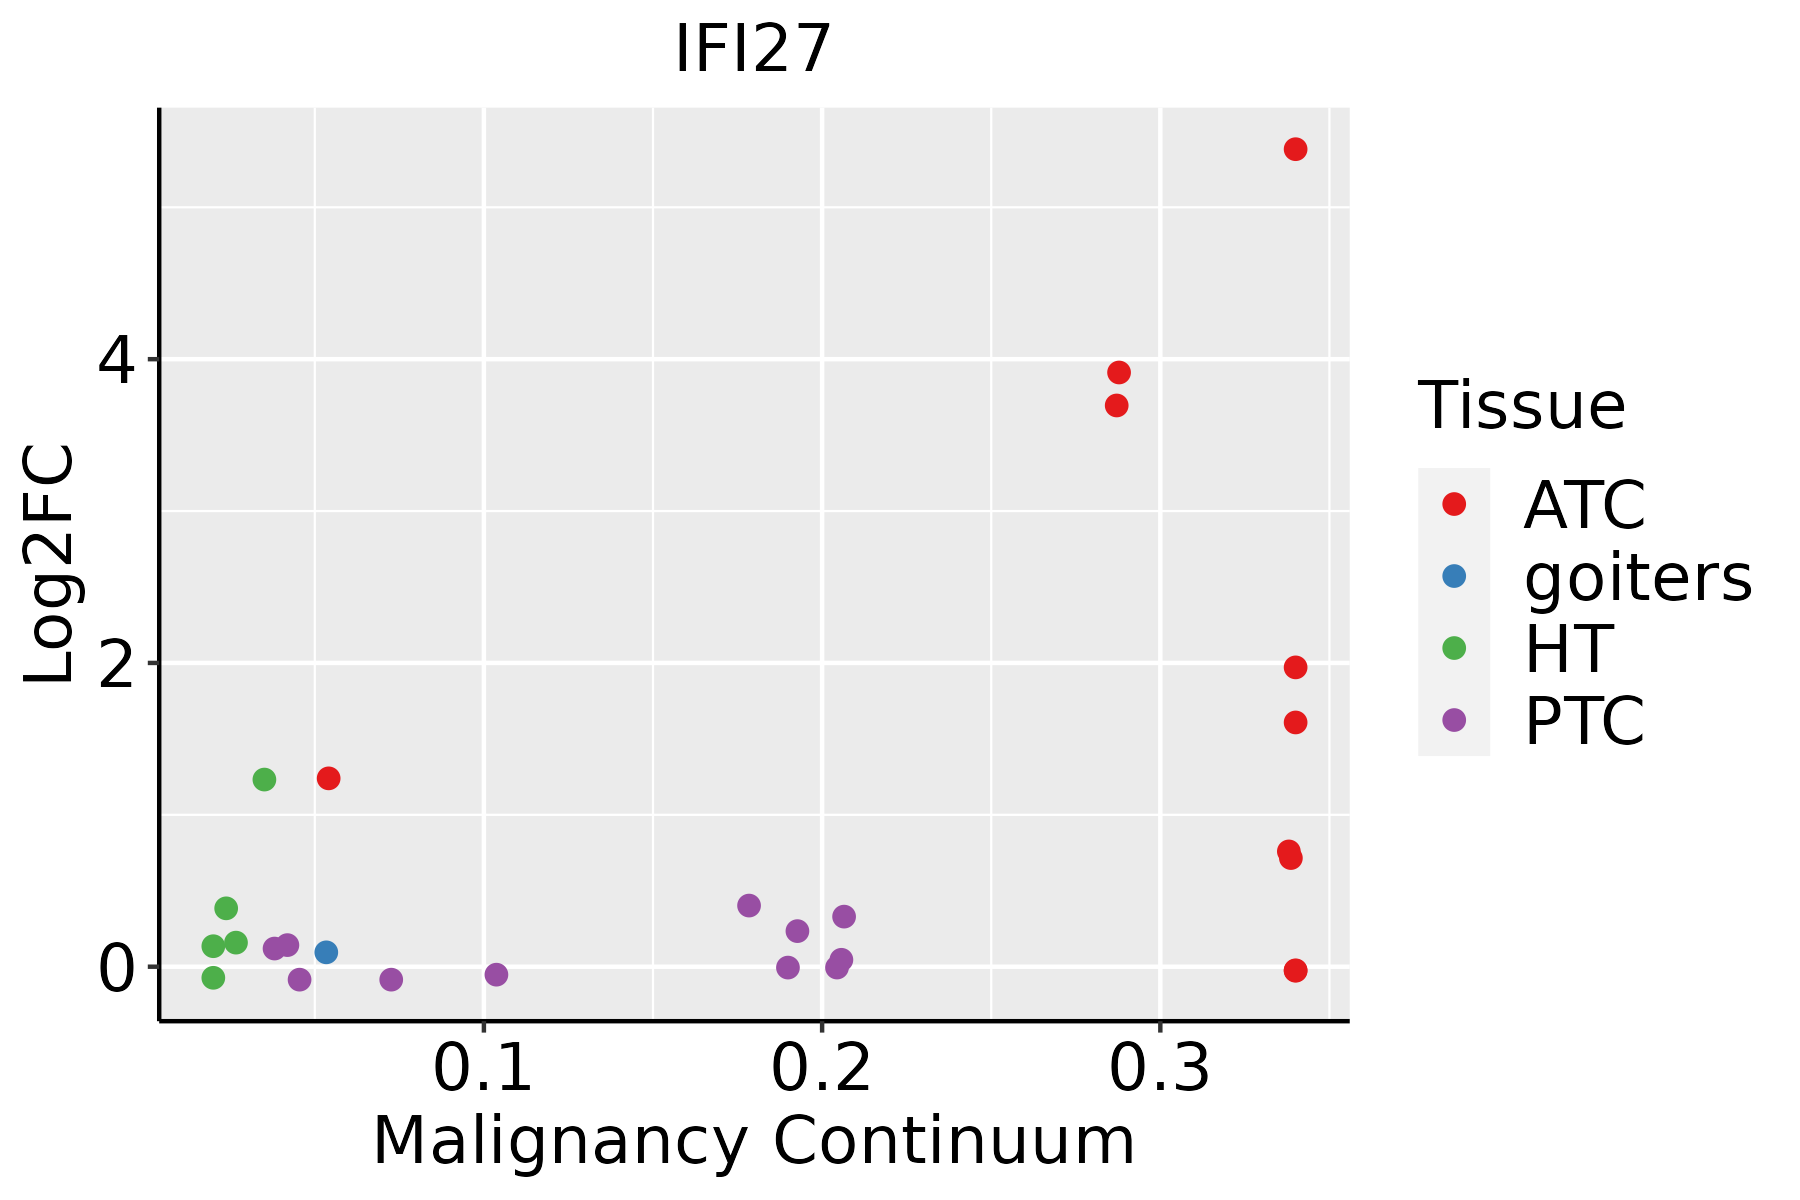 | ATC: Anaplastic thyroid cancer |
| HT: Hashimoto's thyroiditis | ||
| PTC: Papillary thyroid cancer |
| ∗log2FC in expression of this searched gene in stem-like cells from each diseased tissue sample relative to stem-like cells in normal samples in each tissue plotted against the malignancy continuum. Samples are colored based on if they are from different disease stage. |
Top |
Malignant transformation related pathway analysis |
| Find out the enriched GO biological processes and KEGG pathways involved in transition from healthy to precancer to cancer |
| Tissue | Disease Stage | Enriched GO biological Processes |
| Colorectum | AD |  |
| Colorectum | SER |  |
| Colorectum | MSS |  |
| Colorectum | MSI-H |  |
| Colorectum | FAP |  |
| ∗Top 15 enriched GO BP terms are showed in the bar plot of each disease state in each tissue. Each row represents a significant GO biological process which is colored according to the -log10(p.adjust). |
| Page: 1 2 3 4 5 6 7 8 9 |
| GO ID | Tissue | Disease Stage | Description | Gene Ratio | Bg Ratio | pvalue | p.adjust | Count |
| GO:001603214 | Breast | IDC | viral process | 75/1434 | 415/18723 | 1.98e-12 | 4.02e-10 | 75 |
| GO:001905814 | Breast | IDC | viral life cycle | 61/1434 | 317/18723 | 1.61e-11 | 2.77e-09 | 61 |
| GO:001907914 | Breast | IDC | viral genome replication | 32/1434 | 131/18723 | 2.82e-09 | 2.46e-07 | 32 |
| GO:001049814 | Breast | IDC | proteasomal protein catabolic process | 75/1434 | 490/18723 | 5.59e-09 | 4.41e-07 | 75 |
| GO:004440314 | Breast | IDC | biological process involved in symbiotic interaction | 52/1434 | 290/18723 | 6.55e-09 | 5.03e-07 | 52 |
| GO:009719114 | Breast | IDC | extrinsic apoptotic signaling pathway | 42/1434 | 219/18723 | 2.56e-08 | 1.73e-06 | 42 |
| GO:004316114 | Breast | IDC | proteasome-mediated ubiquitin-dependent protein catabolic process | 57/1434 | 412/18723 | 9.55e-06 | 2.68e-04 | 57 |
| GO:00517025 | Breast | IDC | biological process involved in interaction with symbiont | 18/1434 | 94/18723 | 2.46e-04 | 3.85e-03 | 18 |
| GO:00096157 | Breast | IDC | response to virus | 47/1434 | 367/18723 | 3.53e-04 | 5.16e-03 | 47 |
| GO:00447883 | Breast | IDC | modulation by host of viral process | 8/1434 | 30/18723 | 1.48e-03 | 1.50e-02 | 8 |
| GO:00518513 | Breast | IDC | modulation by host of symbiont process | 12/1434 | 60/18723 | 1.73e-03 | 1.69e-02 | 12 |
| GO:00331578 | Breast | IDC | regulation of intracellular protein transport | 29/1434 | 229/18723 | 5.16e-03 | 3.84e-02 | 29 |
| GO:00468258 | Breast | IDC | regulation of protein export from nucleus | 7/1434 | 30/18723 | 6.48e-03 | 4.56e-02 | 7 |
| GO:00358214 | Breast | IDC | modulation of process of other organism | 16/1434 | 106/18723 | 6.70e-03 | 4.66e-02 | 16 |
| GO:001603224 | Breast | DCIS | viral process | 73/1390 | 415/18723 | 3.40e-12 | 6.88e-10 | 73 |
| GO:001905824 | Breast | DCIS | viral life cycle | 59/1390 | 317/18723 | 4.05e-11 | 5.74e-09 | 59 |
| GO:001049824 | Breast | DCIS | proteasomal protein catabolic process | 75/1390 | 490/18723 | 1.44e-09 | 1.40e-07 | 75 |
| GO:001907923 | Breast | DCIS | viral genome replication | 30/1390 | 131/18723 | 2.12e-08 | 1.45e-06 | 30 |
| GO:004440323 | Breast | DCIS | biological process involved in symbiotic interaction | 49/1390 | 290/18723 | 4.70e-08 | 2.89e-06 | 49 |
| GO:009719123 | Breast | DCIS | extrinsic apoptotic signaling pathway | 40/1390 | 219/18723 | 9.43e-08 | 5.28e-06 | 40 |
| Page: 1 2 3 4 5 6 7 8 9 10 11 12 13 14 15 16 17 18 19 20 21 22 23 24 25 26 27 28 29 30 31 32 33 34 |
| Pathway ID | Tissue | Disease Stage | Description | Gene Ratio | Bg Ratio | pvalue | p.adjust | qvalue | Count |
| Page: 1 |
Top |
Cell-cell communication analysis |
| Identification of potential cell-cell interactions between two cell types and their ligand-receptor pairs for different disease states |
| Ligand | Receptor | LRpair | Pathway | Tissue | Disease Stage |
| Page: 1 |
Top |
Single-cell gene regulatory network inference analysis |
| Find out the significant the regulons (TFs) and the target genes of each regulon across cell types for different disease states |
| TF | Cell Type | Tissue | Disease Stage | Target Gene | RSS | Regulon Activity |
| ∗The dot plots of a searched regulon are shown for all cell subpopulations in each disease state of each tissue based on the regulon specific score inferred using pySCENIC and by calculating the average expression. |
| Page: 1 |
Top |
Somatic mutation of malignant transformation related genes |
| Annotation of somatic variants for genes involved in malignant transformation |
| Hugo Symbol | Variant Class | Variant Classification | dbSNP RS | HGVSc | HGVSp | HGVSp Short | SWISSPROT | BIOTYPE | SIFT | PolyPhen | Tumor Sample Barcode | Tissue | Histology | Sex | Age | Stage | Therapy Types | Drugs | Outcome |
| IFI27 | SNV | Missense_Mutation | novel | c.92N>T | p.Ala31Val | p.A31V | protein_coding | tolerated(0.35) | benign(0.006) | TCGA-AA-3949-01 | Colorectum | colon adenocarcinoma | Female | >=65 | III/IV | Unknown | Unknown | SD | |
| IFI27 | SNV | Missense_Mutation | rs771278257 | c.344C>T | p.Ala115Val | p.A115V | protein_coding | tolerated(0.1) | benign(0.005) | TCGA-CA-6717-01 | Colorectum | colon adenocarcinoma | Male | <65 | I/II | Chemotherapy | oxaliplatin | CR | |
| IFI27 | SNV | Missense_Mutation | rs755125237 | c.251N>T | p.Ser84Leu | p.S84L | protein_coding | deleterious(0) | benign(0.062) | TCGA-EO-A22X-01 | Endometrium | uterine corpus endometrioid carcinoma | Female | <65 | III/IV | Unspecific | Carboplatin | Complete Response | |
| IFI27 | SNV | Missense_Mutation | rs534344668 | c.301G>A | p.Gly101Arg | p.G101R | protein_coding | tolerated(0.39) | benign(0.003) | TCGA-EY-A215-01 | Endometrium | uterine corpus endometrioid carcinoma | Female | <65 | I/II | Unknown | Unknown | SD | |
| IFI27 | SNV | Missense_Mutation | novel | c.197N>C | p.Ile66Thr | p.I66T | protein_coding | deleterious(0.02) | benign(0.333) | TCGA-46-6025-01 | Lung | lung squamous cell carcinoma | Male | >=65 | I/II | Chemotherapy | cisplatin | SD | |
| IFI27 | SNV | Missense_Mutation | novel | c.296T>G | p.Leu99Arg | p.L99R | protein_coding | deleterious(0) | probably_damaging(0.999) | TCGA-51-4079-01 | Lung | lung squamous cell carcinoma | Female | >=65 | I/II | Unknown | Unknown | SD |
| Page: 1 |
Top |
Related drugs of malignant transformation related genes |
| Identification of chemicals and drugs interact with genes involved in malignant transfromation |
| (DGIdb 4.0) |
| Entrez ID | Symbol | Category | Interaction Types | Drug Claim Name | Drug Name | PMIDs |
| 3429 | IFI27 | NUCLEAR HORMONE RECEPTOR | TNF-ALPHA | 15086558 | ||
| 3429 | IFI27 | NUCLEAR HORMONE RECEPTOR | RETINOIDS | 15086558 | ||
| 3429 | IFI27 | NUCLEAR HORMONE RECEPTOR | VITAMIN D | 15086558 | ||
| 3429 | IFI27 | NUCLEAR HORMONE RECEPTOR | TGFBETA1 | 15086558 |
| Page: 1 |

Copyright 2023-Present -The University of Texas Health Science Center at Houston |