| Tissue | Expression Dynamics | Abbreviation |
| Breast |  | IDC: Invasive ductal carcinoma |
| DCIS: Ductal carcinoma in situ |
| Precancer(BRCA1-mut): Precancerous lesion from BRCA1 mutation carriers |
| Cervix | 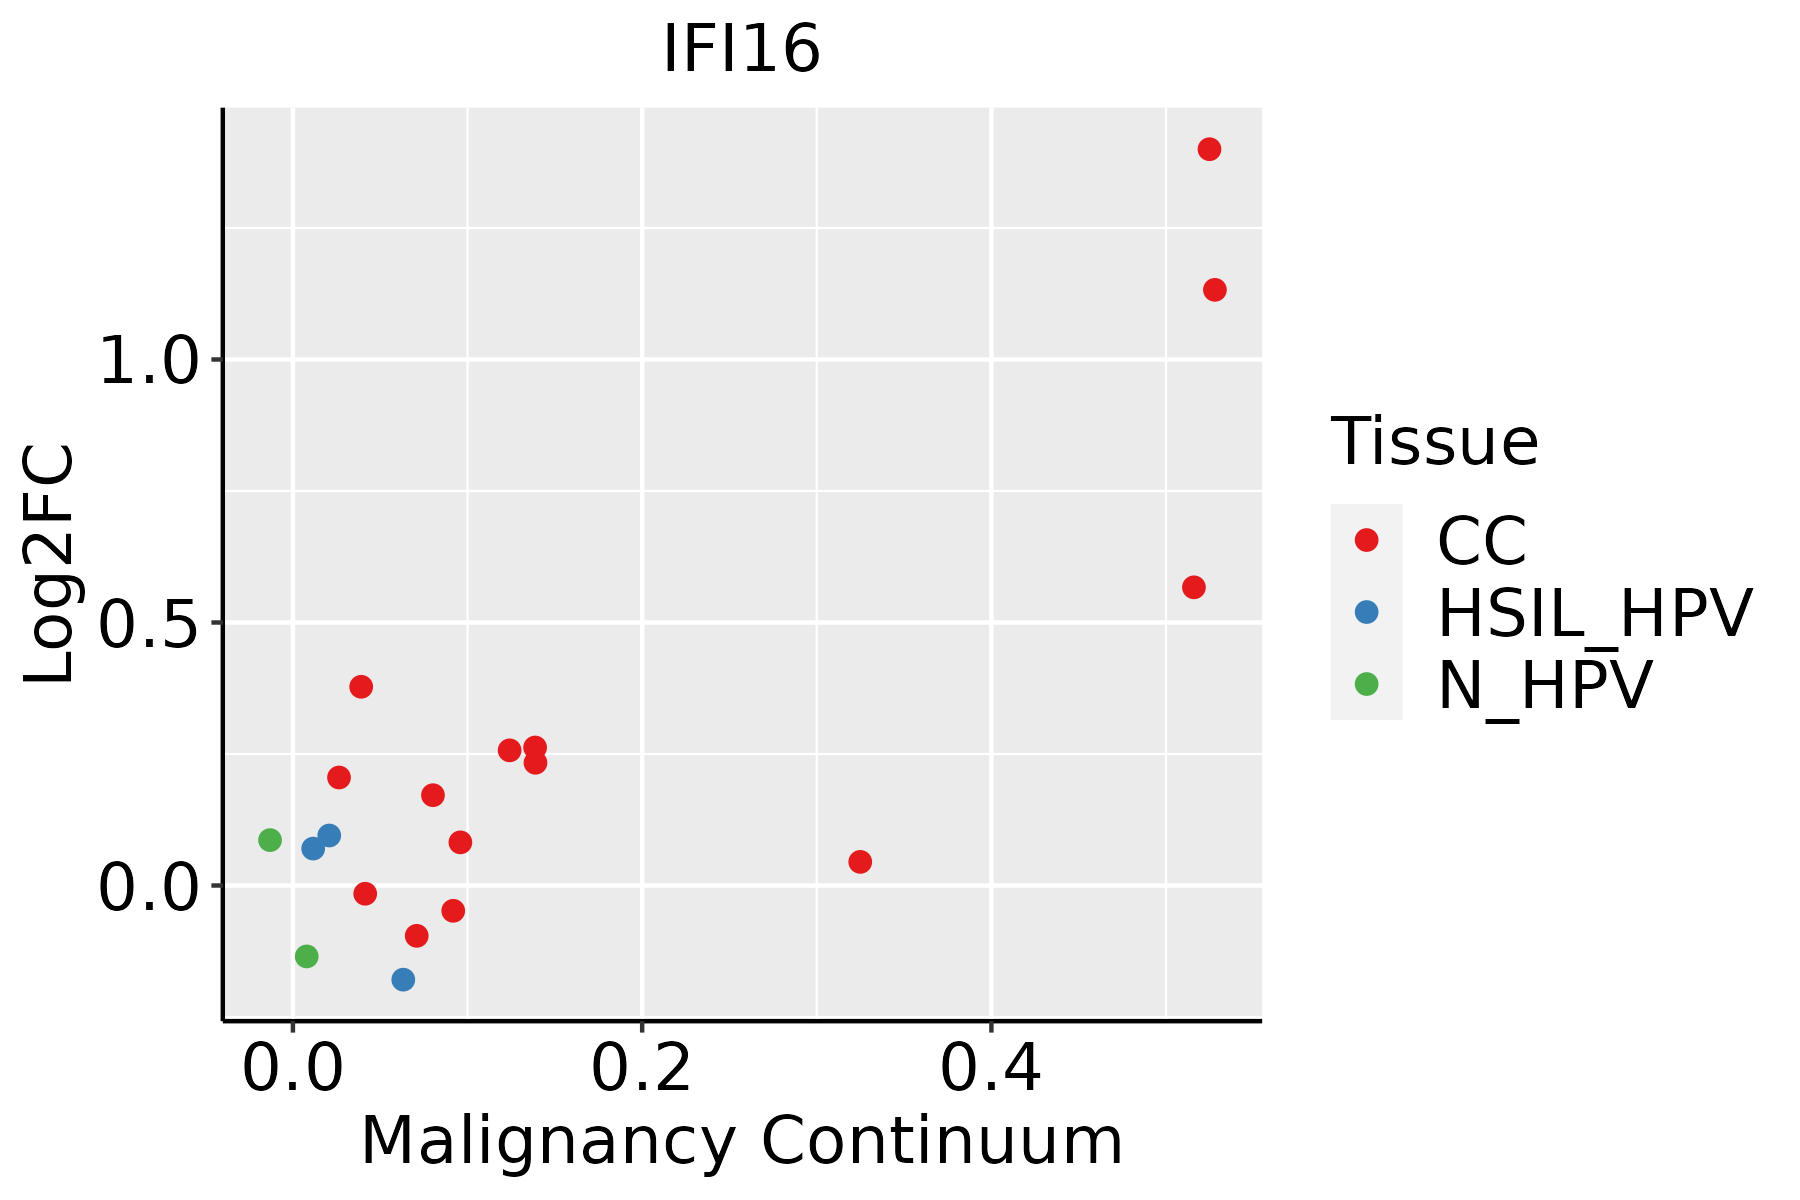 | CC: Cervix cancer |
| HSIL_HPV: HPV-infected high-grade squamous intraepithelial lesions |
| N_HPV: HPV-infected normal cervix |
| Esophagus | 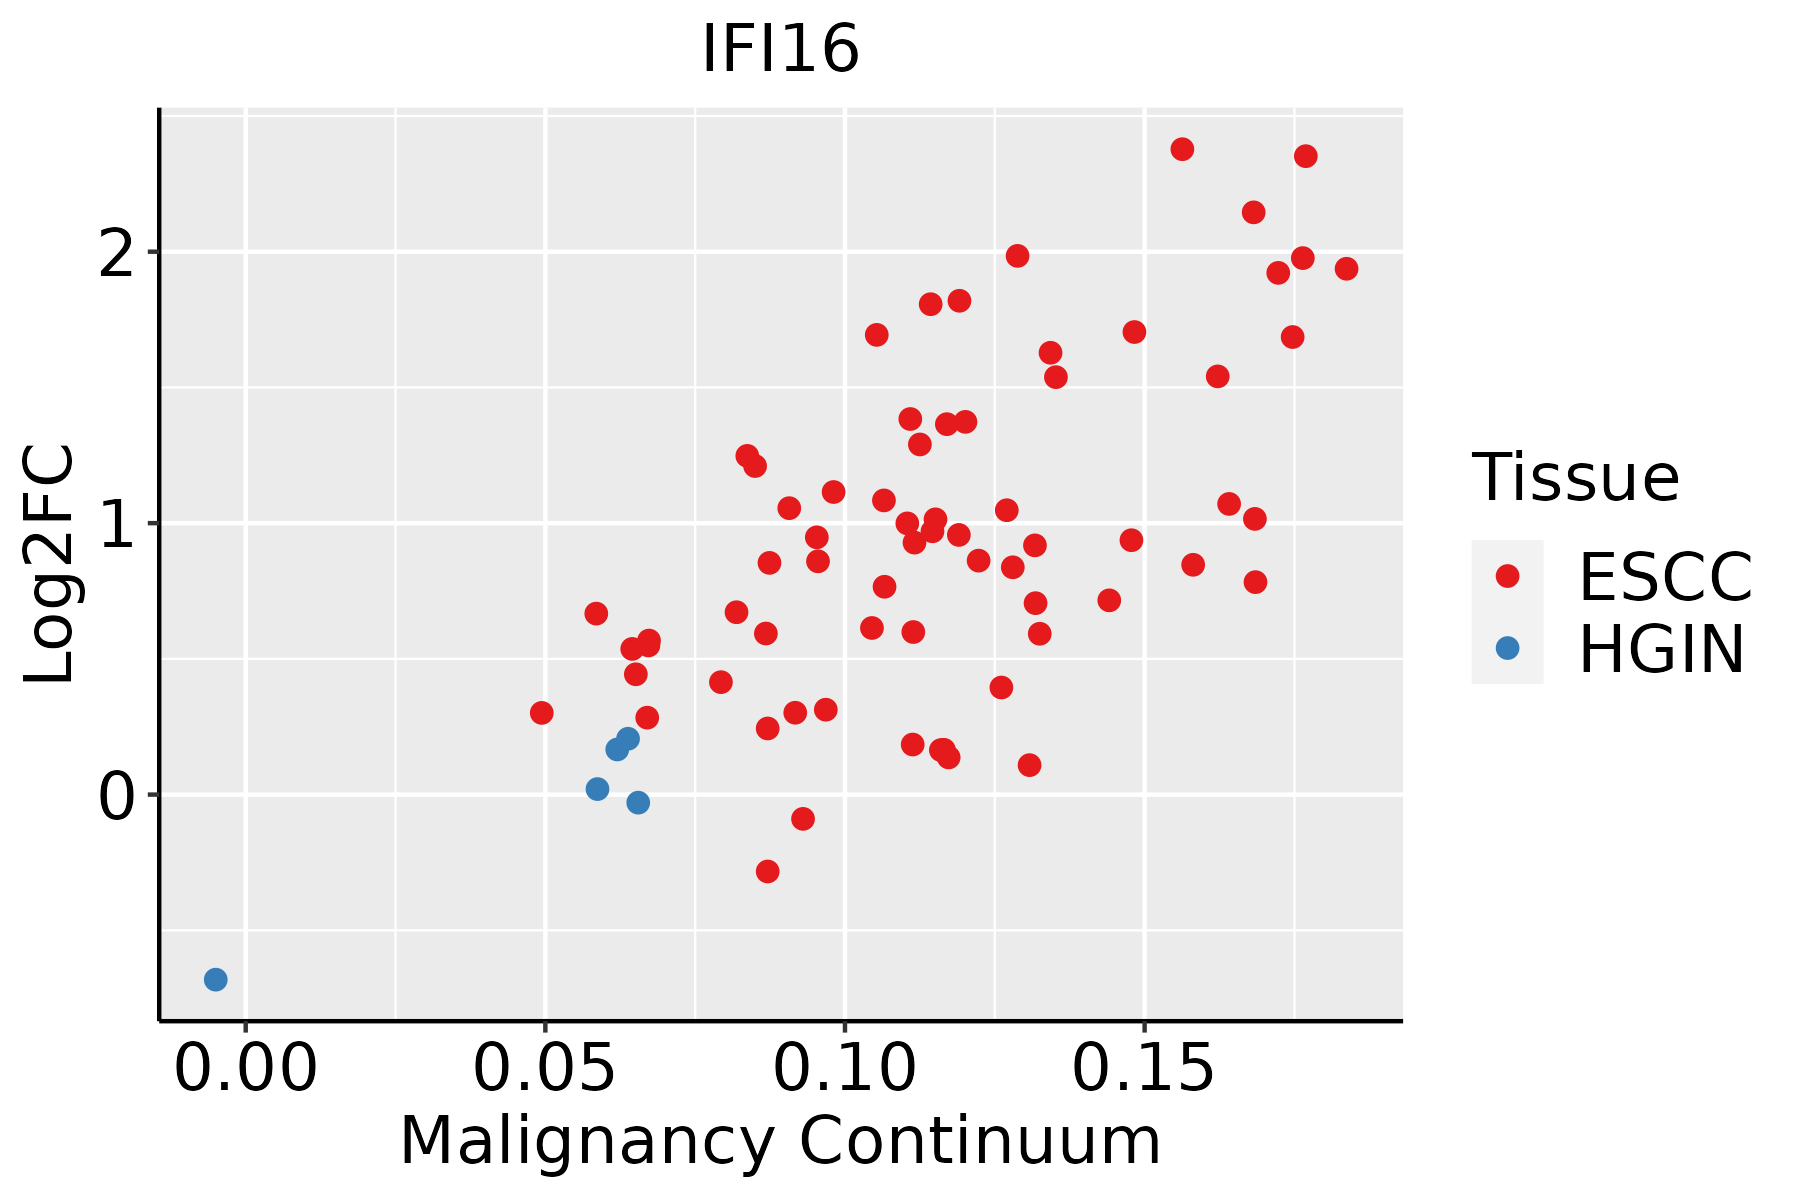 | ESCC: Esophageal squamous cell carcinoma |
| HGIN: High-grade intraepithelial neoplasias |
| LGIN: Low-grade intraepithelial neoplasias |
| Liver | 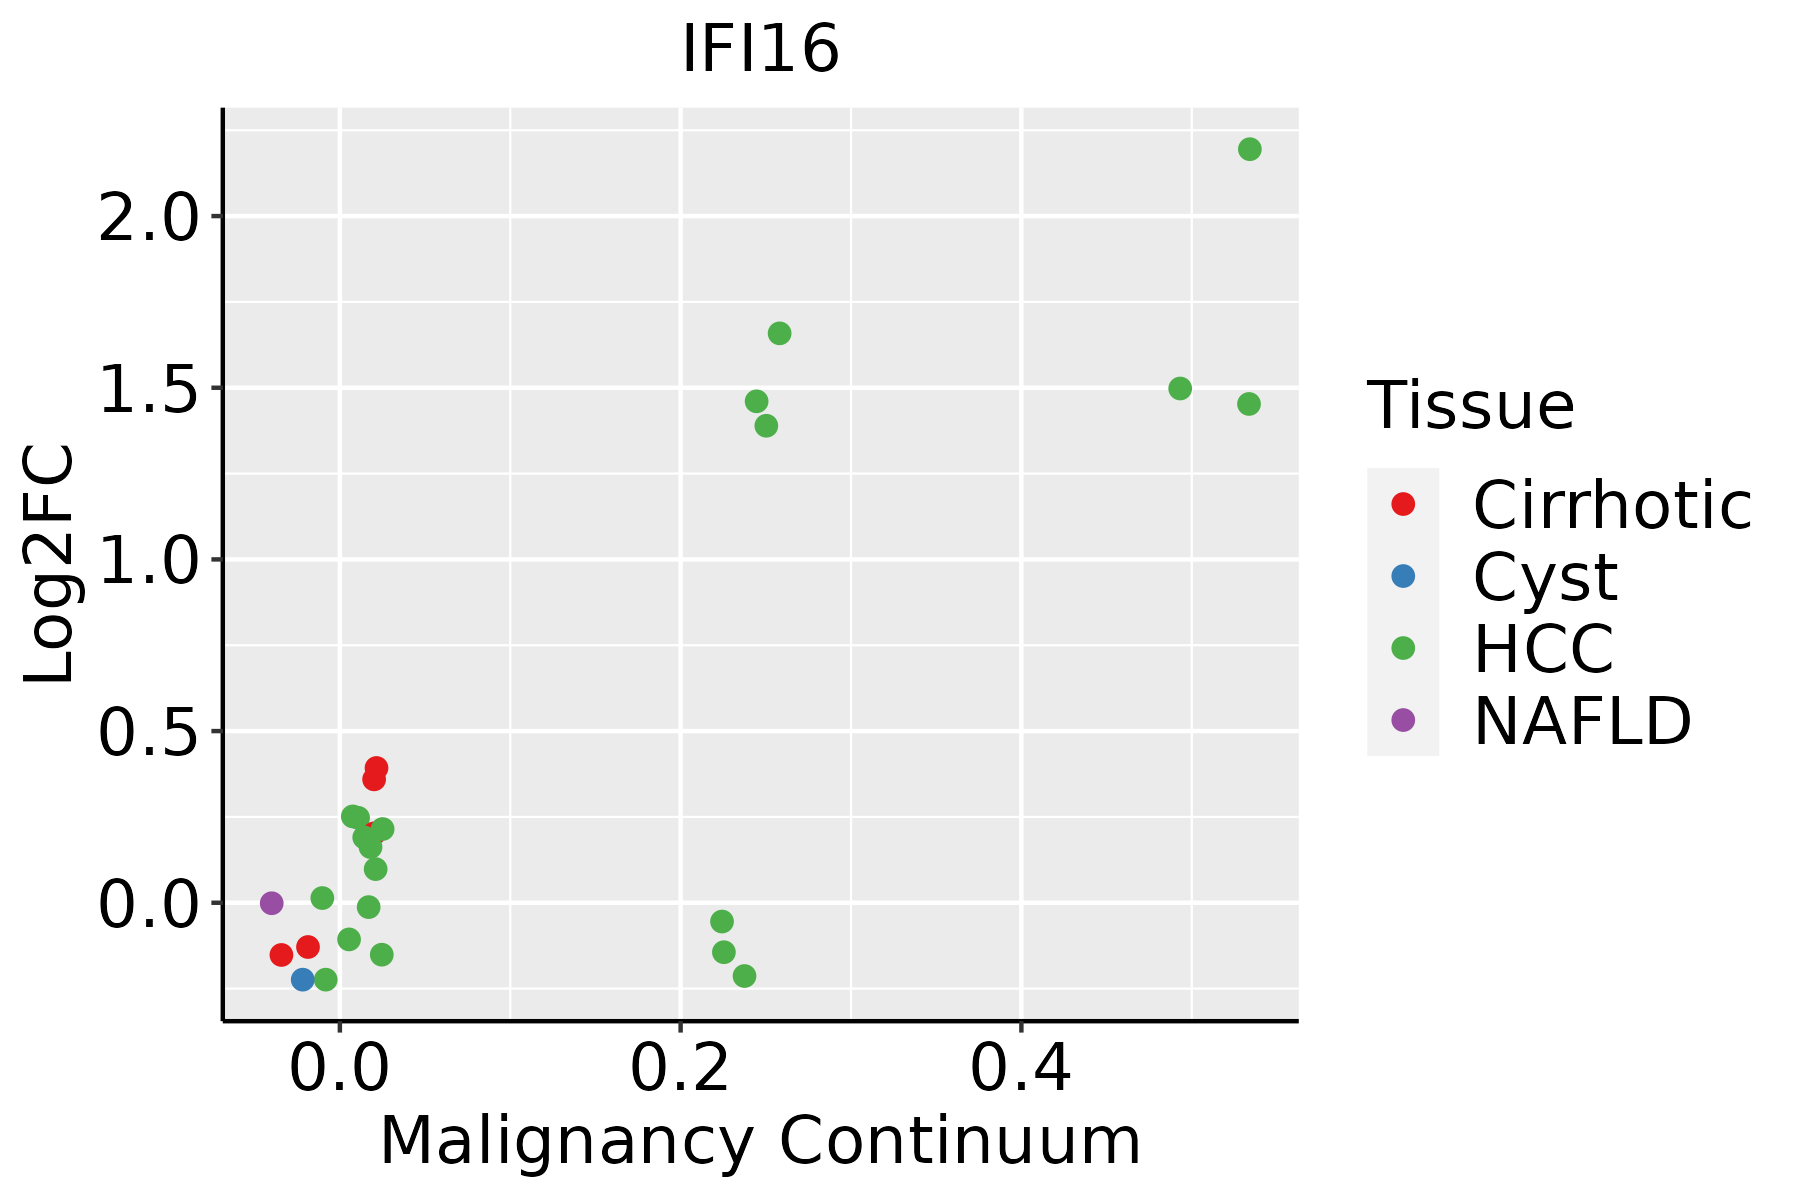 | HCC: Hepatocellular carcinoma |
| NAFLD: Non-alcoholic fatty liver disease |
| Lung | 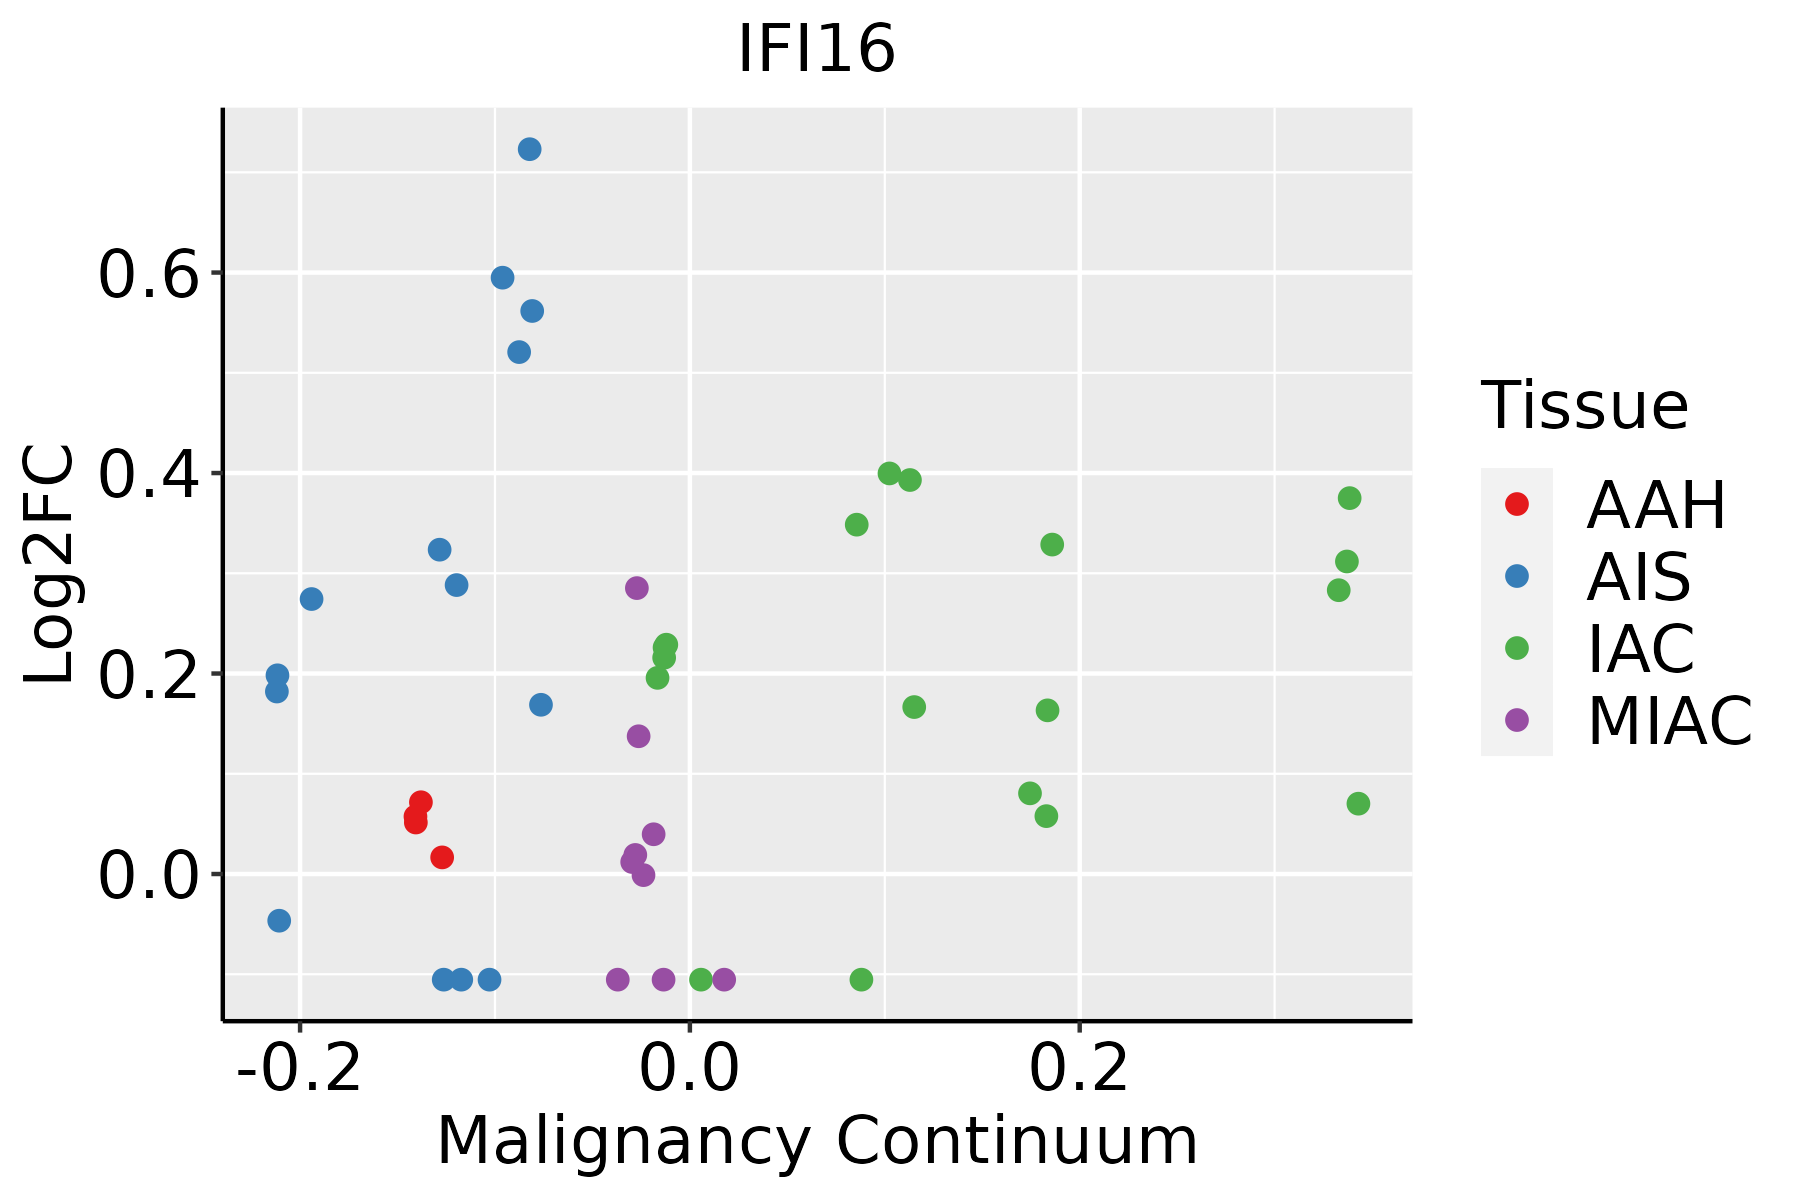 | AAH: Atypical adenomatous hyperplasia |
| AIS: Adenocarcinoma in situ |
| IAC: Invasive lung adenocarcinoma |
| MIA: Minimally invasive adenocarcinoma |
| Oral Cavity |  | EOLP: Erosive Oral lichen planus |
| LP: leukoplakia |
| NEOLP: Non-erosive oral lichen planus |
| OSCC: Oral squamous cell carcinoma |
| Prostate | 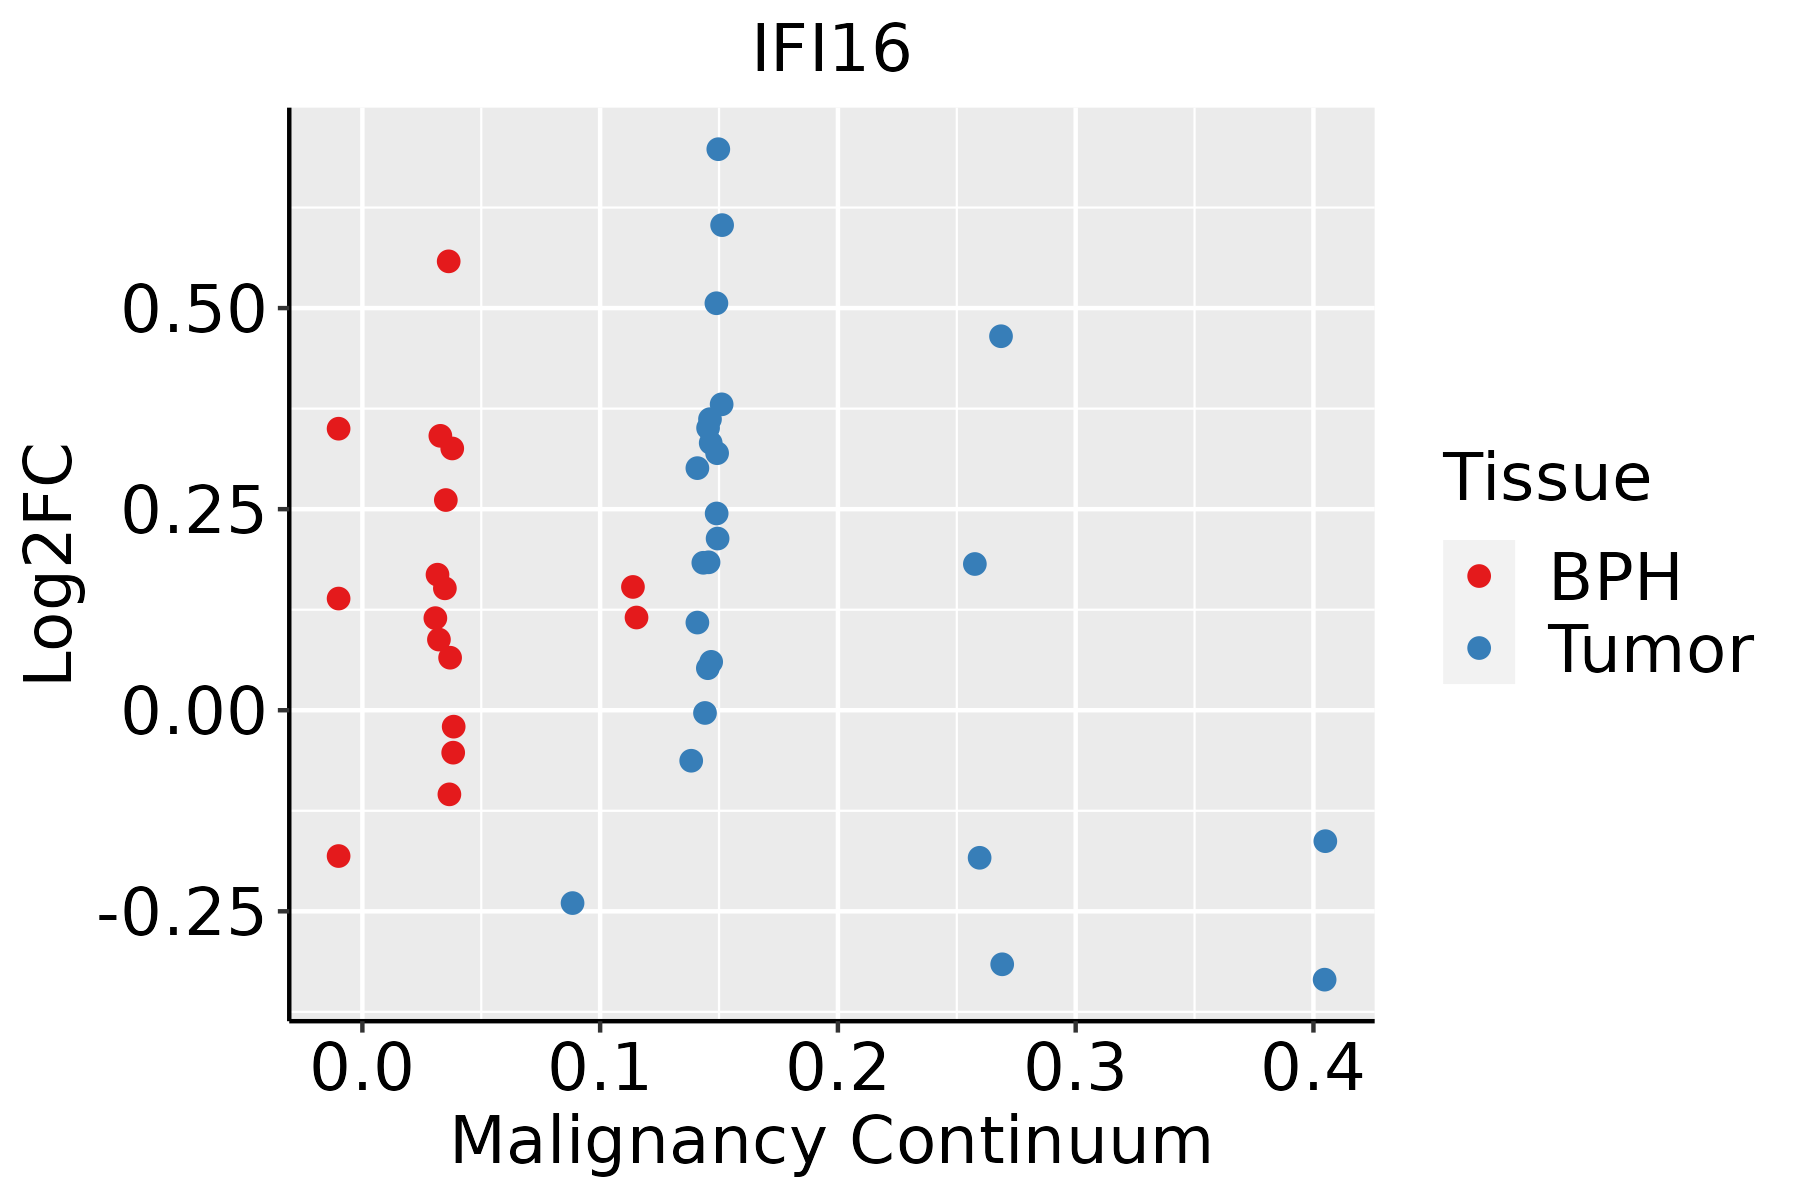 | BPH: Benign Prostatic Hyperplasia |
| Skin | 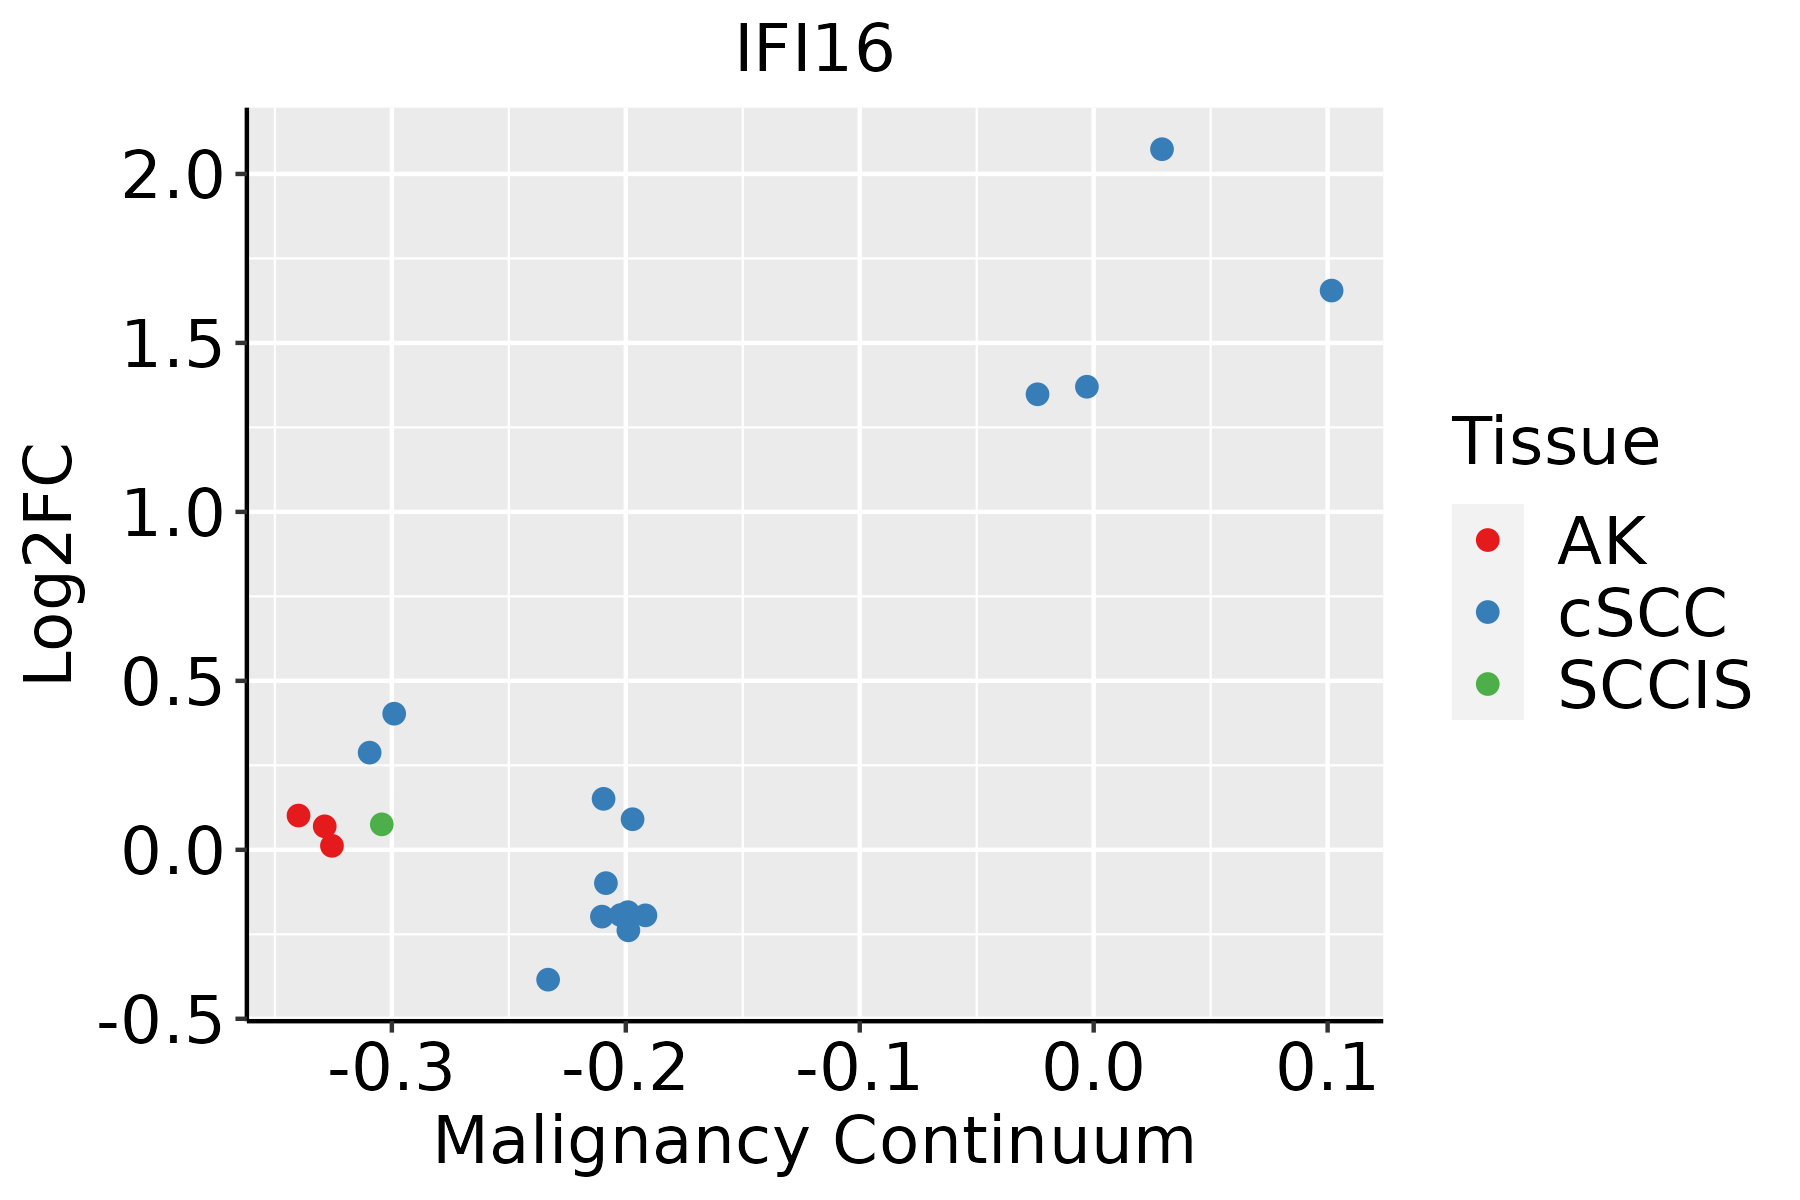 | AK: Actinic keratosis |
| cSCC: Cutaneous squamous cell carcinoma |
| SCCIS:squamous cell carcinoma in situ |
| Thyroid | 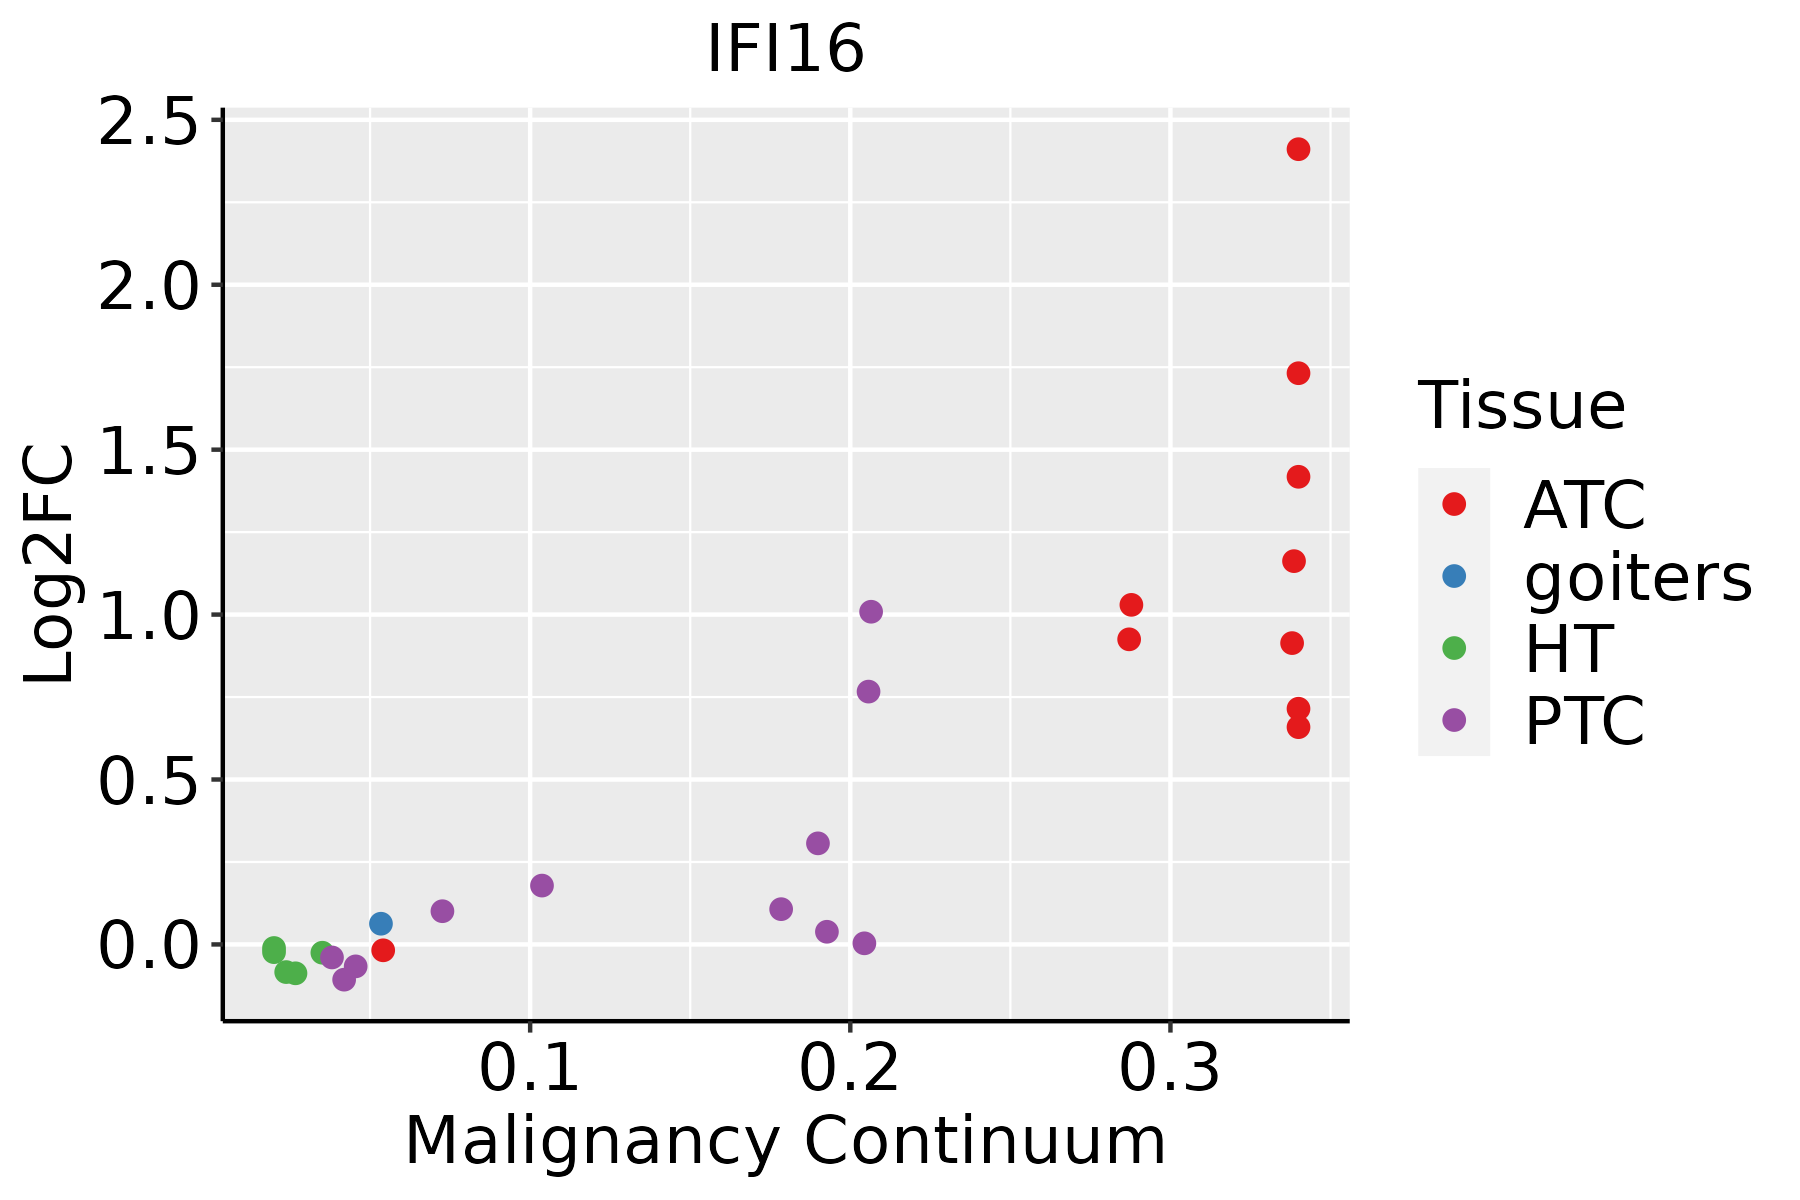 | ATC: Anaplastic thyroid cancer |
| HT: Hashimoto's thyroiditis |
| PTC: Papillary thyroid cancer |
| GO ID | Tissue | Disease Stage | Description | Gene Ratio | Bg Ratio | pvalue | p.adjust | Count |
| GO:005254714 | Breast | IDC | regulation of peptidase activity | 96/1434 | 461/18723 | 7.58e-20 | 6.15e-17 | 96 |
| GO:009719314 | Breast | IDC | intrinsic apoptotic signaling pathway | 69/1434 | 288/18723 | 6.32e-18 | 2.99e-15 | 69 |
| GO:005254814 | Breast | IDC | regulation of endopeptidase activity | 88/1434 | 432/18723 | 1.20e-17 | 4.85e-15 | 88 |
| GO:200011614 | Breast | IDC | regulation of cysteine-type endopeptidase activity | 55/1434 | 235/18723 | 4.25e-14 | 1.21e-11 | 55 |
| GO:004586114 | Breast | IDC | negative regulation of proteolysis | 70/1434 | 351/18723 | 8.21e-14 | 2.22e-11 | 70 |
| GO:005134613 | Breast | IDC | negative regulation of hydrolase activity | 71/1434 | 379/18723 | 1.33e-12 | 2.90e-10 | 71 |
| GO:001046613 | Breast | IDC | negative regulation of peptidase activity | 56/1434 | 262/18723 | 1.39e-12 | 2.92e-10 | 56 |
| GO:001603214 | Breast | IDC | viral process | 75/1434 | 415/18723 | 1.98e-12 | 4.02e-10 | 75 |
| GO:001905814 | Breast | IDC | viral life cycle | 61/1434 | 317/18723 | 1.61e-11 | 2.77e-09 | 61 |
| GO:001095112 | Breast | IDC | negative regulation of endopeptidase activity | 52/1434 | 252/18723 | 3.53e-11 | 5.57e-09 | 52 |
| GO:004586214 | Breast | IDC | positive regulation of proteolysis | 66/1434 | 372/18723 | 9.76e-11 | 1.29e-08 | 66 |
| GO:001907914 | Breast | IDC | viral genome replication | 32/1434 | 131/18723 | 2.82e-09 | 2.46e-07 | 32 |
| GO:200011713 | Breast | IDC | negative regulation of cysteine-type endopeptidase activity | 25/1434 | 86/18723 | 3.31e-09 | 2.77e-07 | 25 |
| GO:005079214 | Breast | IDC | regulation of viral process | 36/1434 | 164/18723 | 6.55e-09 | 5.03e-07 | 36 |
| GO:001095214 | Breast | IDC | positive regulation of peptidase activity | 40/1434 | 197/18723 | 1.04e-08 | 7.67e-07 | 40 |
| GO:005109814 | Breast | IDC | regulation of binding | 57/1434 | 363/18723 | 1.59e-07 | 8.76e-06 | 57 |
| GO:200105613 | Breast | IDC | positive regulation of cysteine-type endopeptidase activity | 31/1434 | 148/18723 | 2.22e-07 | 1.17e-05 | 31 |
| GO:001095013 | Breast | IDC | positive regulation of endopeptidase activity | 35/1434 | 179/18723 | 2.24e-07 | 1.17e-05 | 35 |
| GO:190390014 | Breast | IDC | regulation of viral life cycle | 30/1434 | 148/18723 | 7.25e-07 | 3.35e-05 | 30 |
| GO:005110114 | Breast | IDC | regulation of DNA binding | 26/1434 | 118/18723 | 7.42e-07 | 3.40e-05 | 26 |
| Pathway ID | Tissue | Disease Stage | Description | Gene Ratio | Bg Ratio | pvalue | p.adjust | qvalue | Count |
| hsa046213 | Cervix | CC | NOD-like receptor signaling pathway | 41/1267 | 186/8465 | 5.90e-03 | 1.95e-02 | 1.15e-02 | 41 |
| hsa0462112 | Cervix | CC | NOD-like receptor signaling pathway | 41/1267 | 186/8465 | 5.90e-03 | 1.95e-02 | 1.15e-02 | 41 |
| hsa046219 | Esophagus | HGIN | NOD-like receptor signaling pathway | 45/1383 | 186/8465 | 3.40e-03 | 2.54e-02 | 2.02e-02 | 45 |
| hsa0462114 | Esophagus | HGIN | NOD-like receptor signaling pathway | 45/1383 | 186/8465 | 3.40e-03 | 2.54e-02 | 2.02e-02 | 45 |
| hsa0462122 | Esophagus | ESCC | NOD-like receptor signaling pathway | 116/4205 | 186/8465 | 2.90e-04 | 1.03e-03 | 5.30e-04 | 116 |
| hsa0462132 | Esophagus | ESCC | NOD-like receptor signaling pathway | 116/4205 | 186/8465 | 2.90e-04 | 1.03e-03 | 5.30e-04 | 116 |
| hsa046212 | Lung | IAC | NOD-like receptor signaling pathway | 38/1053 | 186/8465 | 1.23e-03 | 8.24e-03 | 5.47e-03 | 38 |
| hsa0462111 | Lung | IAC | NOD-like receptor signaling pathway | 38/1053 | 186/8465 | 1.23e-03 | 8.24e-03 | 5.47e-03 | 38 |
| hsa046218 | Oral cavity | OSCC | NOD-like receptor signaling pathway | 108/3704 | 186/8465 | 5.13e-05 | 2.07e-04 | 1.05e-04 | 108 |
| hsa0462113 | Oral cavity | OSCC | NOD-like receptor signaling pathway | 108/3704 | 186/8465 | 5.13e-05 | 2.07e-04 | 1.05e-04 | 108 |
| hsa0462121 | Oral cavity | LP | NOD-like receptor signaling pathway | 73/2418 | 186/8465 | 9.80e-04 | 4.53e-03 | 2.92e-03 | 73 |
| hsa0462131 | Oral cavity | LP | NOD-like receptor signaling pathway | 73/2418 | 186/8465 | 9.80e-04 | 4.53e-03 | 2.92e-03 | 73 |
| hsa046214 | Oral cavity | EOLP | NOD-like receptor signaling pathway | 48/1218 | 186/8465 | 2.51e-05 | 1.31e-04 | 7.70e-05 | 48 |
| hsa046215 | Oral cavity | EOLP | NOD-like receptor signaling pathway | 48/1218 | 186/8465 | 2.51e-05 | 1.31e-04 | 7.70e-05 | 48 |
| hsa046216 | Oral cavity | NEOLP | NOD-like receptor signaling pathway | 39/1112 | 186/8465 | 1.79e-03 | 7.91e-03 | 4.98e-03 | 39 |
| hsa046217 | Oral cavity | NEOLP | NOD-like receptor signaling pathway | 39/1112 | 186/8465 | 1.79e-03 | 7.91e-03 | 4.98e-03 | 39 |
| Hugo Symbol | Variant Class | Variant Classification | dbSNP RS | HGVSc | HGVSp | HGVSp Short | SWISSPROT | BIOTYPE | SIFT | PolyPhen | Tumor Sample Barcode | Tissue | Histology | Sex | Age | Stage | Therapy Types | Drugs | Outcome |
| IFI16 | SNV | Missense_Mutation | | c.1297N>A | p.Pro433Thr | p.P433T | Q16666 | protein_coding | deleterious(0.02) | possibly_damaging(0.88) | TCGA-A2-A0CT-01 | Breast | breast invasive carcinoma | Female | >=65 | I/II | Chemotherapy | cytoxan | SD |
| IFI16 | SNV | Missense_Mutation | | c.649G>A | p.Glu217Lys | p.E217K | Q16666 | protein_coding | tolerated(0.75) | possibly_damaging(0.469) | TCGA-A2-A0CX-01 | Breast | breast invasive carcinoma | Female | <65 | I/II | Chemotherapy | adriamycin | SD |
| IFI16 | SNV | Missense_Mutation | | c.5N>A | p.Gly2Glu | p.G2E | Q16666 | protein_coding | tolerated(1) | benign(0) | TCGA-BH-A0DS-01 | Breast | breast invasive carcinoma | Female | >=65 | III/IV | Chemotherapy | cyclophosphamide | SD |
| IFI16 | SNV | Missense_Mutation | novel | c.1190A>G | p.Asn397Ser | p.N397S | Q16666 | protein_coding | tolerated(0.52) | benign(0.192) | TCGA-BH-A18G-01 | Breast | breast invasive carcinoma | Female | >=65 | I/II | Unknown | Unknown | SD |
| IFI16 | SNV | Missense_Mutation | | c.1673A>T | p.Lys558Met | p.K558M | Q16666 | protein_coding | deleterious(0) | probably_damaging(0.999) | TCGA-E2-A10C-01 | Breast | breast invasive carcinoma | Female | <65 | I/II | Chemotherapy | cytoxan | SD |
| IFI16 | SNV | Missense_Mutation | | c.291G>C | p.Lys97Asn | p.K97N | Q16666 | protein_coding | tolerated(0.08) | benign(0.019) | TCGA-E2-A1LB-01 | Breast | breast invasive carcinoma | Female | <65 | I/II | Chemotherapy | cytoxan | SD |
| IFI16 | SNV | Missense_Mutation | | c.2082N>C | p.Leu694Phe | p.L694F | Q16666 | protein_coding | deleterious(0) | probably_damaging(1) | TCGA-BI-A0VR-01 | Cervix | cervical & endocervical cancer | Female | <65 | III/IV | Unknown | Unknown | SD |
| IFI16 | SNV | Missense_Mutation | | c.717N>A | p.Phe239Leu | p.F239L | Q16666 | protein_coding | deleterious(0.04) | benign(0.013) | TCGA-EA-A556-01 | Cervix | cervical & endocervical cancer | Female | <65 | I/II | Unknown | Unknown | SD |
| IFI16 | SNV | Missense_Mutation | | c.2082N>C | p.Leu694Phe | p.L694F | Q16666 | protein_coding | deleterious(0) | probably_damaging(1) | TCGA-HM-A4S6-01 | Cervix | cervical & endocervical cancer | Female | <65 | III/IV | Chemotherapy | cisplatin | CR |
| IFI16 | SNV | Missense_Mutation | | c.1267N>A | p.Glu423Lys | p.E423K | Q16666 | protein_coding | tolerated(0.5) | benign(0.443) | TCGA-IR-A3LH-01 | Cervix | cervical & endocervical cancer | Female | <65 | I/II | Chemotherapy | cisplatin | CR |


