
|
|||||
|
 | |
| |
| |
| |
| |
| |
|
Gene: IFFO1 |
Gene summary for IFFO1 |
| Gene information | Species | Human | Gene symbol | IFFO1 | Gene ID | 25900 |
| Gene name | intermediate filament family orphan 1 | |
| Gene Alias | HOM-TES-103 | |
| Cytomap | 12p13.31 | |
| Gene Type | protein-coding | GO ID | GO:0006139 | UniProtAcc | Q0D2I5 |
Top |
Malignant transformation analysis |
| Identification of the aberrant gene expression in precancerous and cancerous lesions by comparing the gene expression of stem-like cells in diseased tissues with normal stem cells |
| Entrez ID | Symbol | Replicates | Species | Organ | Tissue | Adj P-value | Log2FC | Malignancy |
| 25900 | IFFO1 | HCC1 | Human | Liver | HCC | 7.30e-03 | 3.06e+00 | 0.5336 |
| 25900 | IFFO1 | S014 | Human | Liver | HCC | 3.26e-11 | 3.63e-01 | 0.2254 |
| 25900 | IFFO1 | S015 | Human | Liver | HCC | 4.80e-28 | 8.26e-01 | 0.2375 |
| 25900 | IFFO1 | S016 | Human | Liver | HCC | 6.34e-22 | 4.52e-01 | 0.2243 |
| 25900 | IFFO1 | S028 | Human | Liver | HCC | 7.45e-08 | 2.79e-01 | 0.2503 |
| 25900 | IFFO1 | S029 | Human | Liver | HCC | 4.74e-03 | 1.64e-01 | 0.2581 |
| 25900 | IFFO1 | ATC12 | Human | Thyroid | ATC | 1.42e-26 | 5.38e-01 | 0.34 |
| 25900 | IFFO1 | ATC13 | Human | Thyroid | ATC | 2.77e-07 | 1.56e-01 | 0.34 |
| 25900 | IFFO1 | ATC4 | Human | Thyroid | ATC | 5.78e-36 | 6.77e-01 | 0.34 |
| 25900 | IFFO1 | ATC5 | Human | Thyroid | ATC | 2.60e-07 | 1.69e-01 | 0.34 |
| Page: 1 |
| Tissue | Expression Dynamics | Abbreviation |
| Liver | 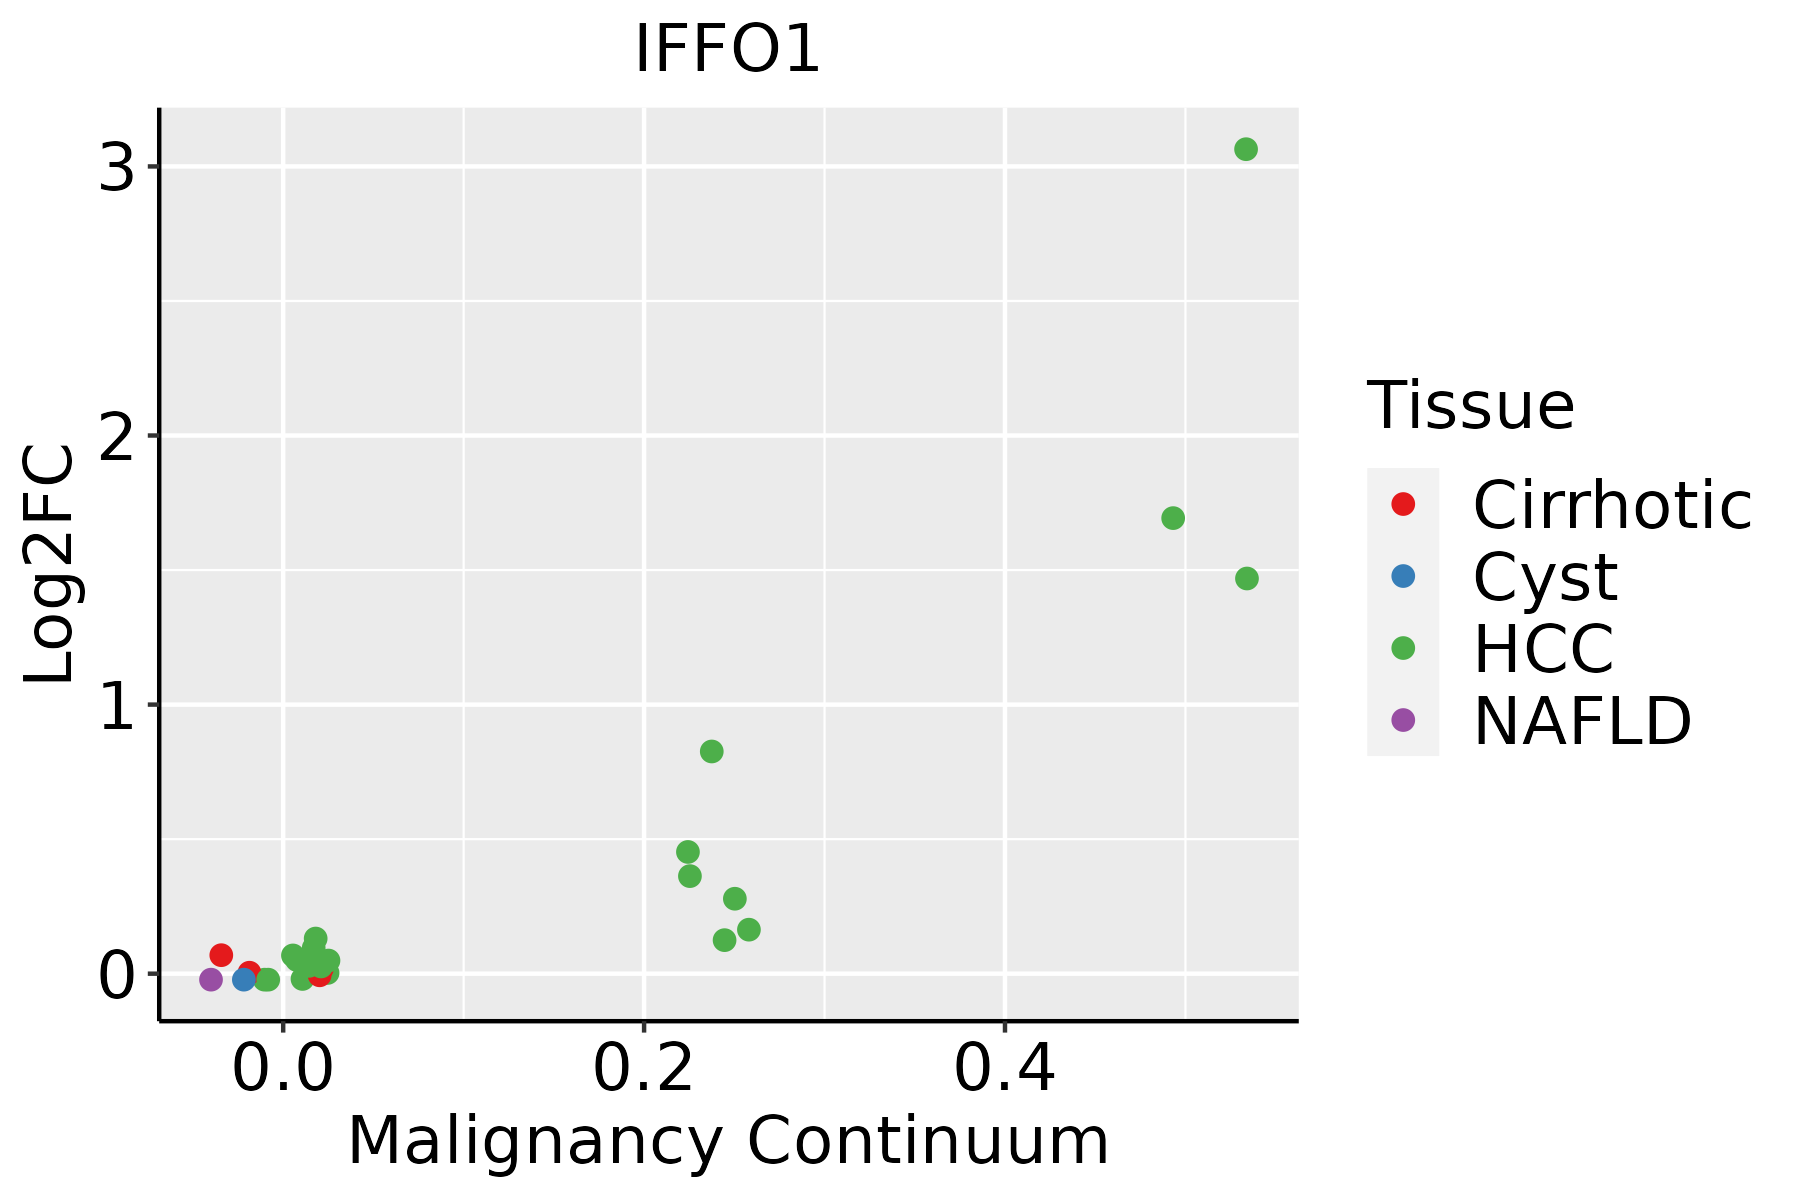 | HCC: Hepatocellular carcinoma |
| NAFLD: Non-alcoholic fatty liver disease | ||
| Thyroid | 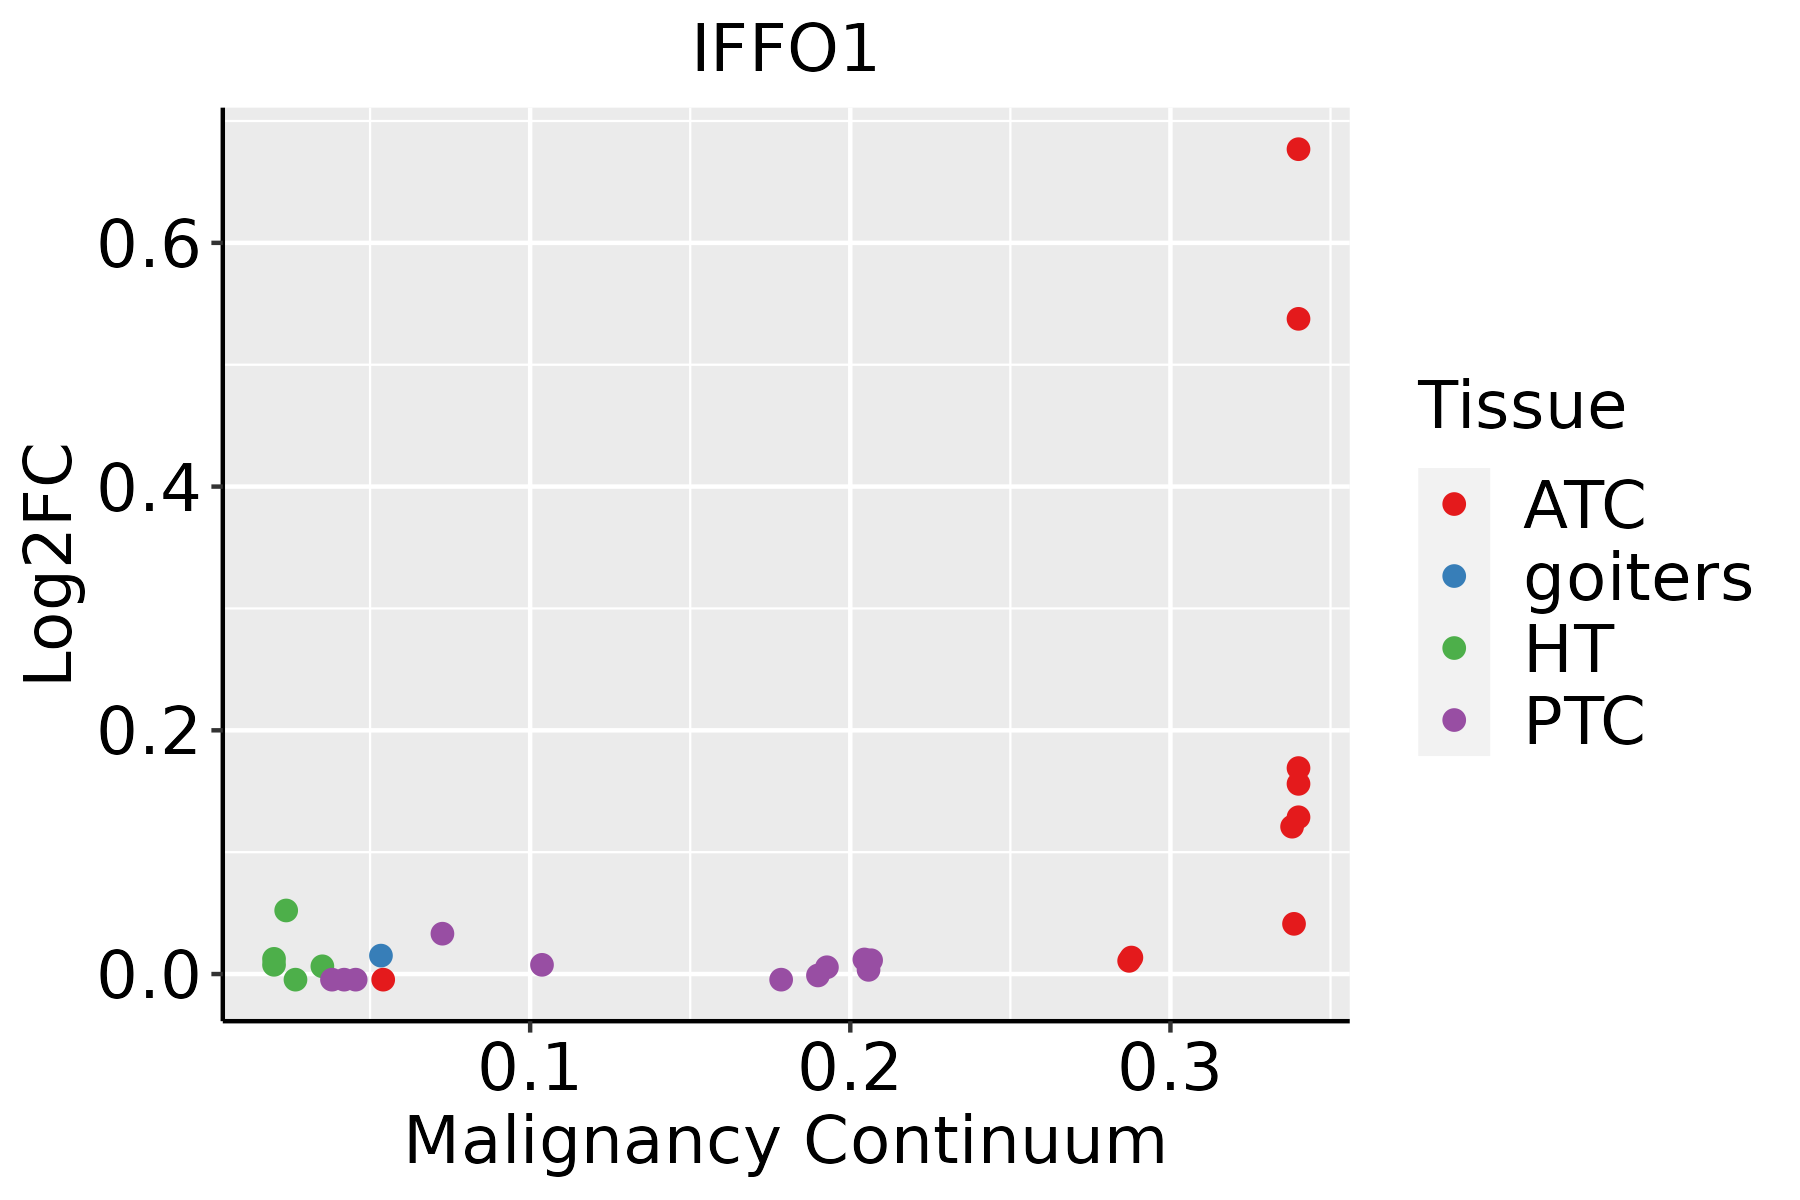 | ATC: Anaplastic thyroid cancer |
| HT: Hashimoto's thyroiditis | ||
| PTC: Papillary thyroid cancer |
| ∗log2FC in expression of this searched gene in stem-like cells from each diseased tissue sample relative to stem-like cells in normal samples in each tissue plotted against the malignancy continuum. Samples are colored based on if they are from different disease stage. |
Top |
Malignant transformation related pathway analysis |
| Find out the enriched GO biological processes and KEGG pathways involved in transition from healthy to precancer to cancer |
| Tissue | Disease Stage | Enriched GO biological Processes |
| Colorectum | AD |  |
| Colorectum | SER |  |
| Colorectum | MSS |  |
| Colorectum | MSI-H |  |
| Colorectum | FAP |  |
| ∗Top 15 enriched GO BP terms are showed in the bar plot of each disease state in each tissue. Each row represents a significant GO biological process which is colored according to the -log10(p.adjust). |
| Page: 1 2 3 4 5 6 7 8 9 |
| GO ID | Tissue | Disease Stage | Description | Gene Ratio | Bg Ratio | pvalue | p.adjust | Count |
| GO:00345021 | Liver | HCC | protein localization to chromosome | 55/7958 | 92/18723 | 6.12e-04 | 3.82e-03 | 55 |
| GO:00063021 | Liver | HCC | double-strand break repair | 131/7958 | 251/18723 | 1.17e-03 | 6.54e-03 | 131 |
| GO:0050000 | Liver | HCC | chromosome localization | 49/7958 | 82/18723 | 1.20e-03 | 6.68e-03 | 49 |
| GO:005000013 | Thyroid | ATC | chromosome localization | 49/6293 | 82/18723 | 1.07e-06 | 1.39e-05 | 49 |
| GO:003450212 | Thyroid | ATC | protein localization to chromosome | 52/6293 | 92/18723 | 5.21e-06 | 5.61e-05 | 52 |
| GO:000630212 | Thyroid | ATC | double-strand break repair | 110/6293 | 251/18723 | 4.48e-04 | 2.65e-03 | 110 |
| GO:00063031 | Thyroid | ATC | double-strand break repair via nonhomologous end joining | 33/6293 | 66/18723 | 4.27e-03 | 1.80e-02 | 33 |
| Page: 1 |
| Pathway ID | Tissue | Disease Stage | Description | Gene Ratio | Bg Ratio | pvalue | p.adjust | qvalue | Count |
| Page: 1 |
Top |
Cell-cell communication analysis |
| Identification of potential cell-cell interactions between two cell types and their ligand-receptor pairs for different disease states |
| Ligand | Receptor | LRpair | Pathway | Tissue | Disease Stage |
| Page: 1 |
Top |
Single-cell gene regulatory network inference analysis |
| Find out the significant the regulons (TFs) and the target genes of each regulon across cell types for different disease states |
| TF | Cell Type | Tissue | Disease Stage | Target Gene | RSS | Regulon Activity |
| ∗The dot plots of a searched regulon are shown for all cell subpopulations in each disease state of each tissue based on the regulon specific score inferred using pySCENIC and by calculating the average expression. |
| Page: 1 |
Top |
Somatic mutation of malignant transformation related genes |
| Annotation of somatic variants for genes involved in malignant transformation |
| Hugo Symbol | Variant Class | Variant Classification | dbSNP RS | HGVSc | HGVSp | HGVSp Short | SWISSPROT | BIOTYPE | SIFT | PolyPhen | Tumor Sample Barcode | Tissue | Histology | Sex | Age | Stage | Therapy Types | Drugs | Outcome |
| IFFO1 | SNV | Missense_Mutation | c.524N>G | p.Ser175Trp | p.S175W | protein_coding | deleterious(0.01) | possibly_damaging(0.864) | TCGA-A1-A0SK-01 | Breast | breast invasive carcinoma | Female | <65 | I/II | Unknown | Unknown | PD | ||
| IFFO1 | SNV | Missense_Mutation | c.1030N>A | p.Ala344Thr | p.A344T | protein_coding | deleterious(0.01) | probably_damaging(0.991) | TCGA-D8-A1J8-01 | Breast | breast invasive carcinoma | Female | >=65 | I/II | Hormone Therapy | nolvadex | SD | ||
| IFFO1 | SNV | Missense_Mutation | novel | c.800N>C | p.Ile267Thr | p.I267T | protein_coding | tolerated(0.3) | benign(0.003) | TCGA-D8-A1XK-01 | Breast | breast invasive carcinoma | Female | <65 | I/II | Chemotherapy | doxorubicine+cyclophosphamide | SD | |
| IFFO1 | SNV | Missense_Mutation | rs370846800 | c.1666N>A | p.Glu556Lys | p.E556K | protein_coding | tolerated_low_confidence(0.14) | probably_damaging(0.988) | TCGA-PL-A8LV-01 | Breast | breast invasive carcinoma | Female | <65 | III/IV | Unknown | Unknown | SD | |
| IFFO1 | insertion | In_Frame_Ins | novel | c.1209_1210insAGA | p.Glu403_Glu404insArg | p.E403_E404insR | protein_coding | TCGA-A8-A09Q-01 | Breast | breast invasive carcinoma | Female | >=65 | III/IV | Hormone Therapy | anastrozole | SD | |||
| IFFO1 | SNV | Missense_Mutation | novel | c.526N>A | p.Ser176Thr | p.S176T | protein_coding | tolerated(0.34) | benign(0.003) | TCGA-DS-A1OB-01 | Cervix | cervical & endocervical cancer | Female | <65 | I/II | Chemotherapy | carboplatin | PD | |
| IFFO1 | SNV | Missense_Mutation | novel | c.721N>G | p.Leu241Val | p.L241V | protein_coding | deleterious(0.02) | probably_damaging(0.98) | TCGA-VS-A8EL-01 | Cervix | cervical & endocervical cancer | Female | <65 | I/II | Chemotherapy | cisplatin | CR | |
| IFFO1 | insertion | Frame_Shift_Ins | novel | c.527_528insCT | p.Ser177CysfsTer73 | p.S177Cfs*73 | protein_coding | TCGA-DS-A1OB-01 | Cervix | cervical & endocervical cancer | Female | <65 | I/II | Chemotherapy | carboplatin | PD | |||
| IFFO1 | SNV | Missense_Mutation | rs867248785 | c.179N>T | p.Pro60Leu | p.P60L | protein_coding | deleterious(0) | probably_damaging(1) | TCGA-A6-6650-01 | Colorectum | colon adenocarcinoma | Female | >=65 | I/II | Unknown | Unknown | SD | |
| IFFO1 | SNV | Missense_Mutation | rs747627725 | c.715C>T | p.Arg239Cys | p.R239C | protein_coding | deleterious(0) | probably_damaging(0.993) | TCGA-AA-3663-01 | Colorectum | colon adenocarcinoma | Male | <65 | I/II | Unknown | Unknown | SD |
| Page: 1 2 3 4 5 |
Top |
Related drugs of malignant transformation related genes |
| Identification of chemicals and drugs interact with genes involved in malignant transfromation |
| (DGIdb 4.0) |
| Entrez ID | Symbol | Category | Interaction Types | Drug Claim Name | Drug Name | PMIDs |
| Page: 1 |

Copyright 2023-Present -The University of Texas Health Science Center at Houston |