
|
|||||
|
 | |
| |
| |
| |
| |
| |
|
Gene: IER5 |
Gene summary for IER5 |
| Gene information | Species | Human | Gene symbol | IER5 | Gene ID | 51278 |
| Gene name | immediate early response 5 | |
| Gene Alias | SBBI48 | |
| Cytomap | 1q25.3 | |
| Gene Type | protein-coding | GO ID | GO:0006139 | UniProtAcc | Q5VY09 |
Top |
Malignant transformation analysis |
| Identification of the aberrant gene expression in precancerous and cancerous lesions by comparing the gene expression of stem-like cells in diseased tissues with normal stem cells |
| Entrez ID | Symbol | Replicates | Species | Organ | Tissue | Adj P-value | Log2FC | Malignancy |
| 51278 | IER5 | CA_HPV_2 | Human | Cervix | CC | 2.81e-06 | 4.11e-01 | 0.0391 |
| 51278 | IER5 | HSIL_HPV_2 | Human | Cervix | HSIL_HPV | 1.16e-02 | -3.04e-01 | 0.0208 |
| 51278 | IER5 | sample1 | Human | Cervix | CC | 7.75e-21 | 9.35e-01 | 0.0959 |
| 51278 | IER5 | L1 | Human | Cervix | CC | 1.07e-06 | 3.76e-01 | 0.0802 |
| 51278 | IER5 | T1 | Human | Cervix | CC | 9.21e-50 | 1.09e+00 | 0.0918 |
| 51278 | IER5 | LZE4T | Human | Esophagus | ESCC | 2.74e-06 | 2.88e-01 | 0.0811 |
| 51278 | IER5 | LZE5T | Human | Esophagus | ESCC | 3.11e-04 | 9.24e-01 | 0.0514 |
| 51278 | IER5 | LZE7T | Human | Esophagus | ESCC | 1.08e-08 | 2.64e-01 | 0.0667 |
| 51278 | IER5 | LZE8T | Human | Esophagus | ESCC | 1.36e-04 | 4.47e-02 | 0.067 |
| 51278 | IER5 | LZE20T | Human | Esophagus | ESCC | 9.16e-16 | 1.18e+00 | 0.0662 |
| 51278 | IER5 | LZE22T | Human | Esophagus | ESCC | 2.09e-06 | 1.61e+00 | 0.068 |
| 51278 | IER5 | LZE21T | Human | Esophagus | ESCC | 2.24e-03 | 1.35e+00 | 0.0655 |
| 51278 | IER5 | P1T-E | Human | Esophagus | ESCC | 4.96e-19 | 1.65e+00 | 0.0875 |
| 51278 | IER5 | P2T-E | Human | Esophagus | ESCC | 1.60e-34 | 7.53e-01 | 0.1177 |
| 51278 | IER5 | P4T-E | Human | Esophagus | ESCC | 4.72e-35 | 1.56e+00 | 0.1323 |
| 51278 | IER5 | P5T-E | Human | Esophagus | ESCC | 3.57e-81 | 2.77e+00 | 0.1327 |
| 51278 | IER5 | P8T-E | Human | Esophagus | ESCC | 4.13e-18 | 2.14e-01 | 0.0889 |
| 51278 | IER5 | P9T-E | Human | Esophagus | ESCC | 6.82e-19 | 4.67e-01 | 0.1131 |
| 51278 | IER5 | P10T-E | Human | Esophagus | ESCC | 1.85e-08 | 1.15e-01 | 0.116 |
| 51278 | IER5 | P11T-E | Human | Esophagus | ESCC | 4.77e-20 | 1.76e+00 | 0.1426 |
| Page: 1 2 3 4 5 6 7 8 |
| Tissue | Expression Dynamics | Abbreviation |
| Cervix | 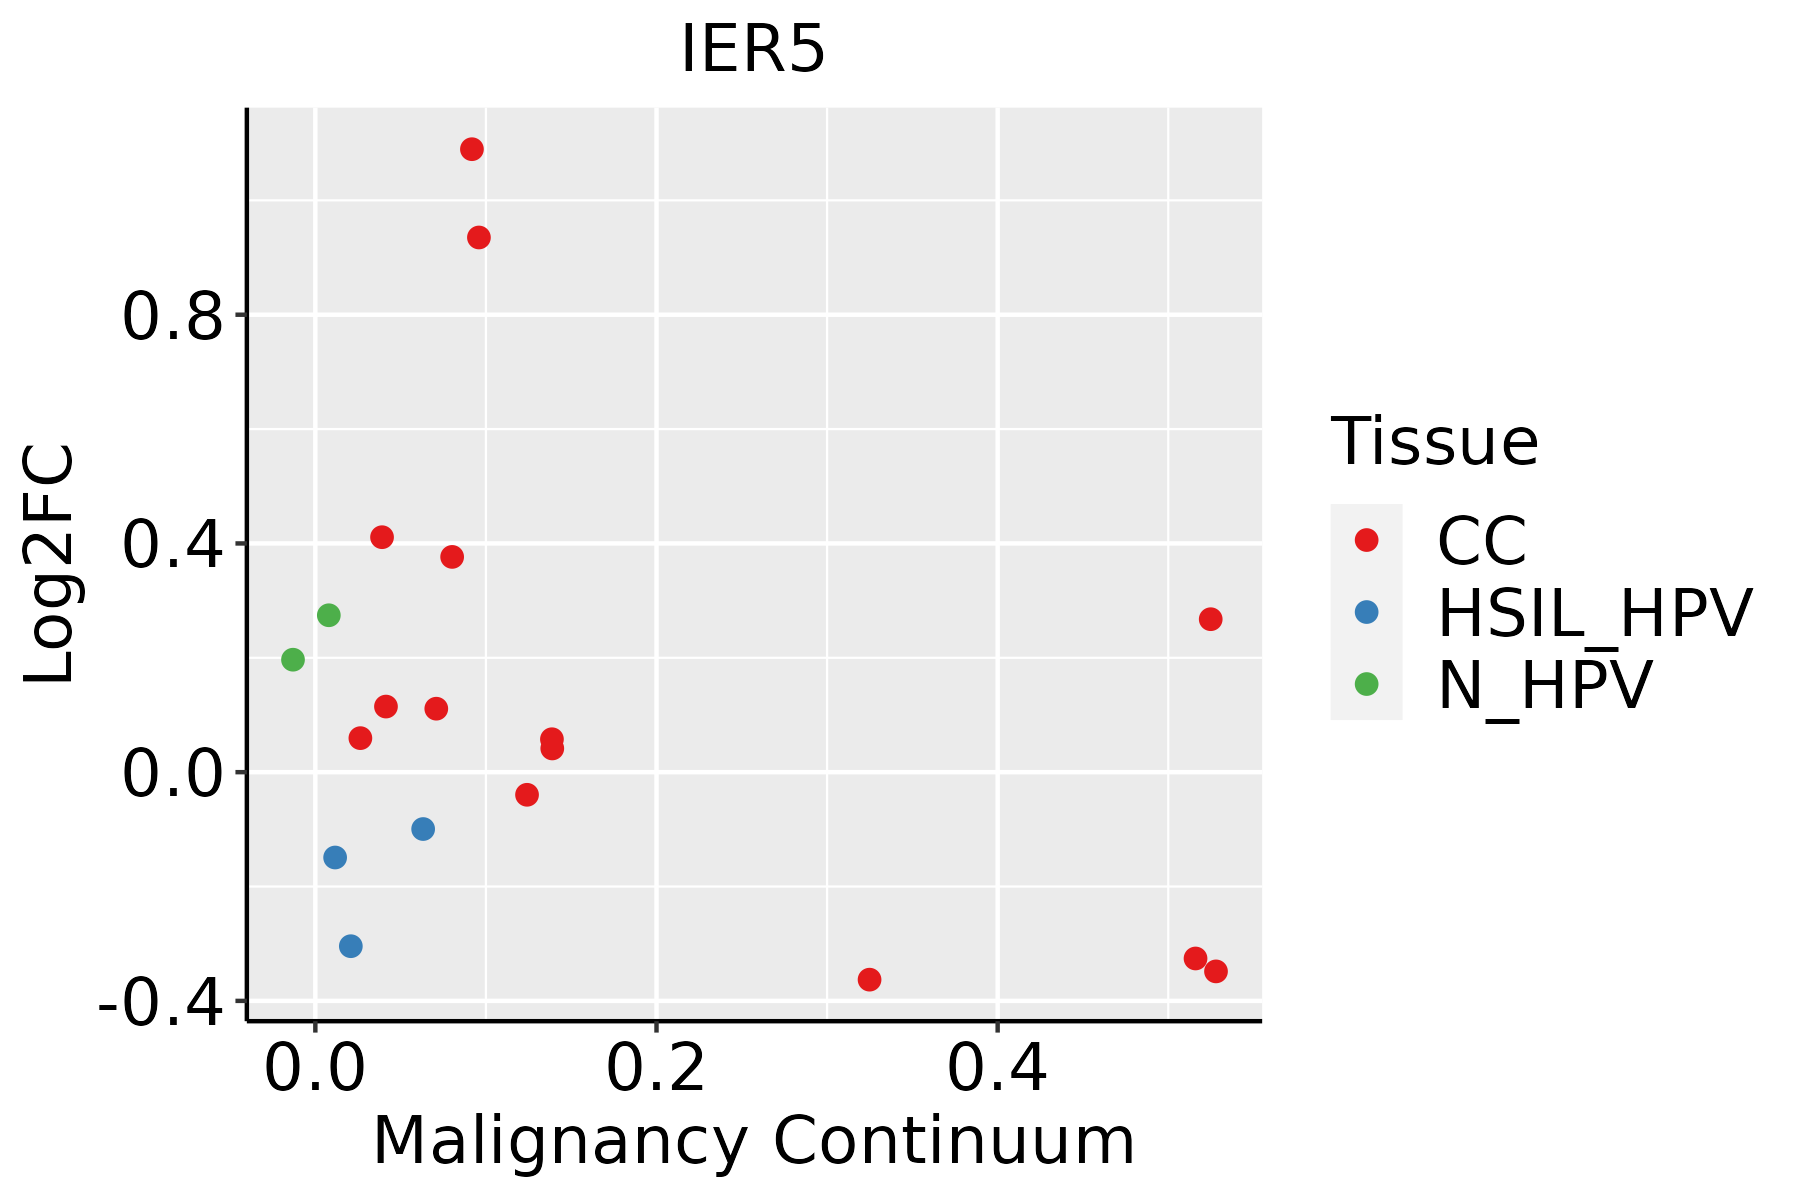 | CC: Cervix cancer |
| HSIL_HPV: HPV-infected high-grade squamous intraepithelial lesions | ||
| N_HPV: HPV-infected normal cervix | ||
| Esophagus | 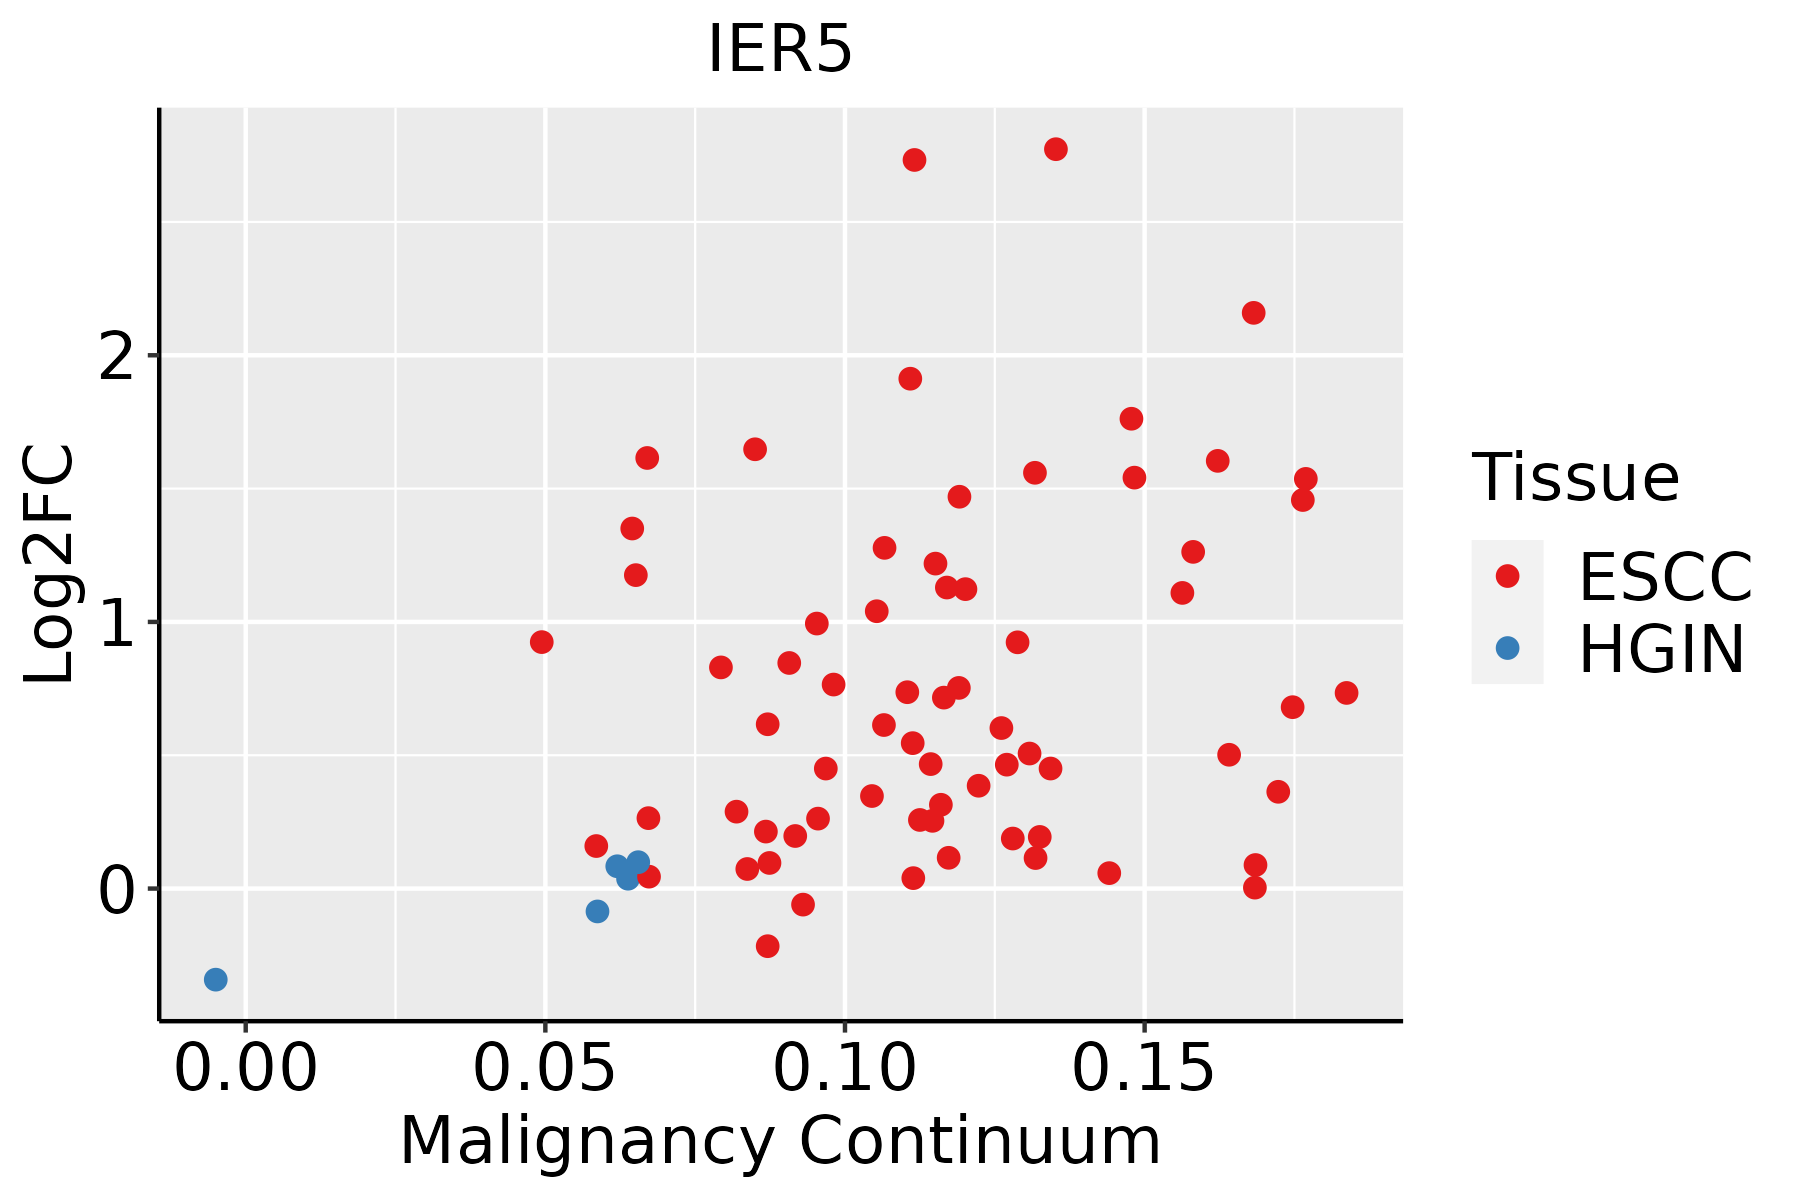 | ESCC: Esophageal squamous cell carcinoma |
| HGIN: High-grade intraepithelial neoplasias | ||
| LGIN: Low-grade intraepithelial neoplasias | ||
| Liver | 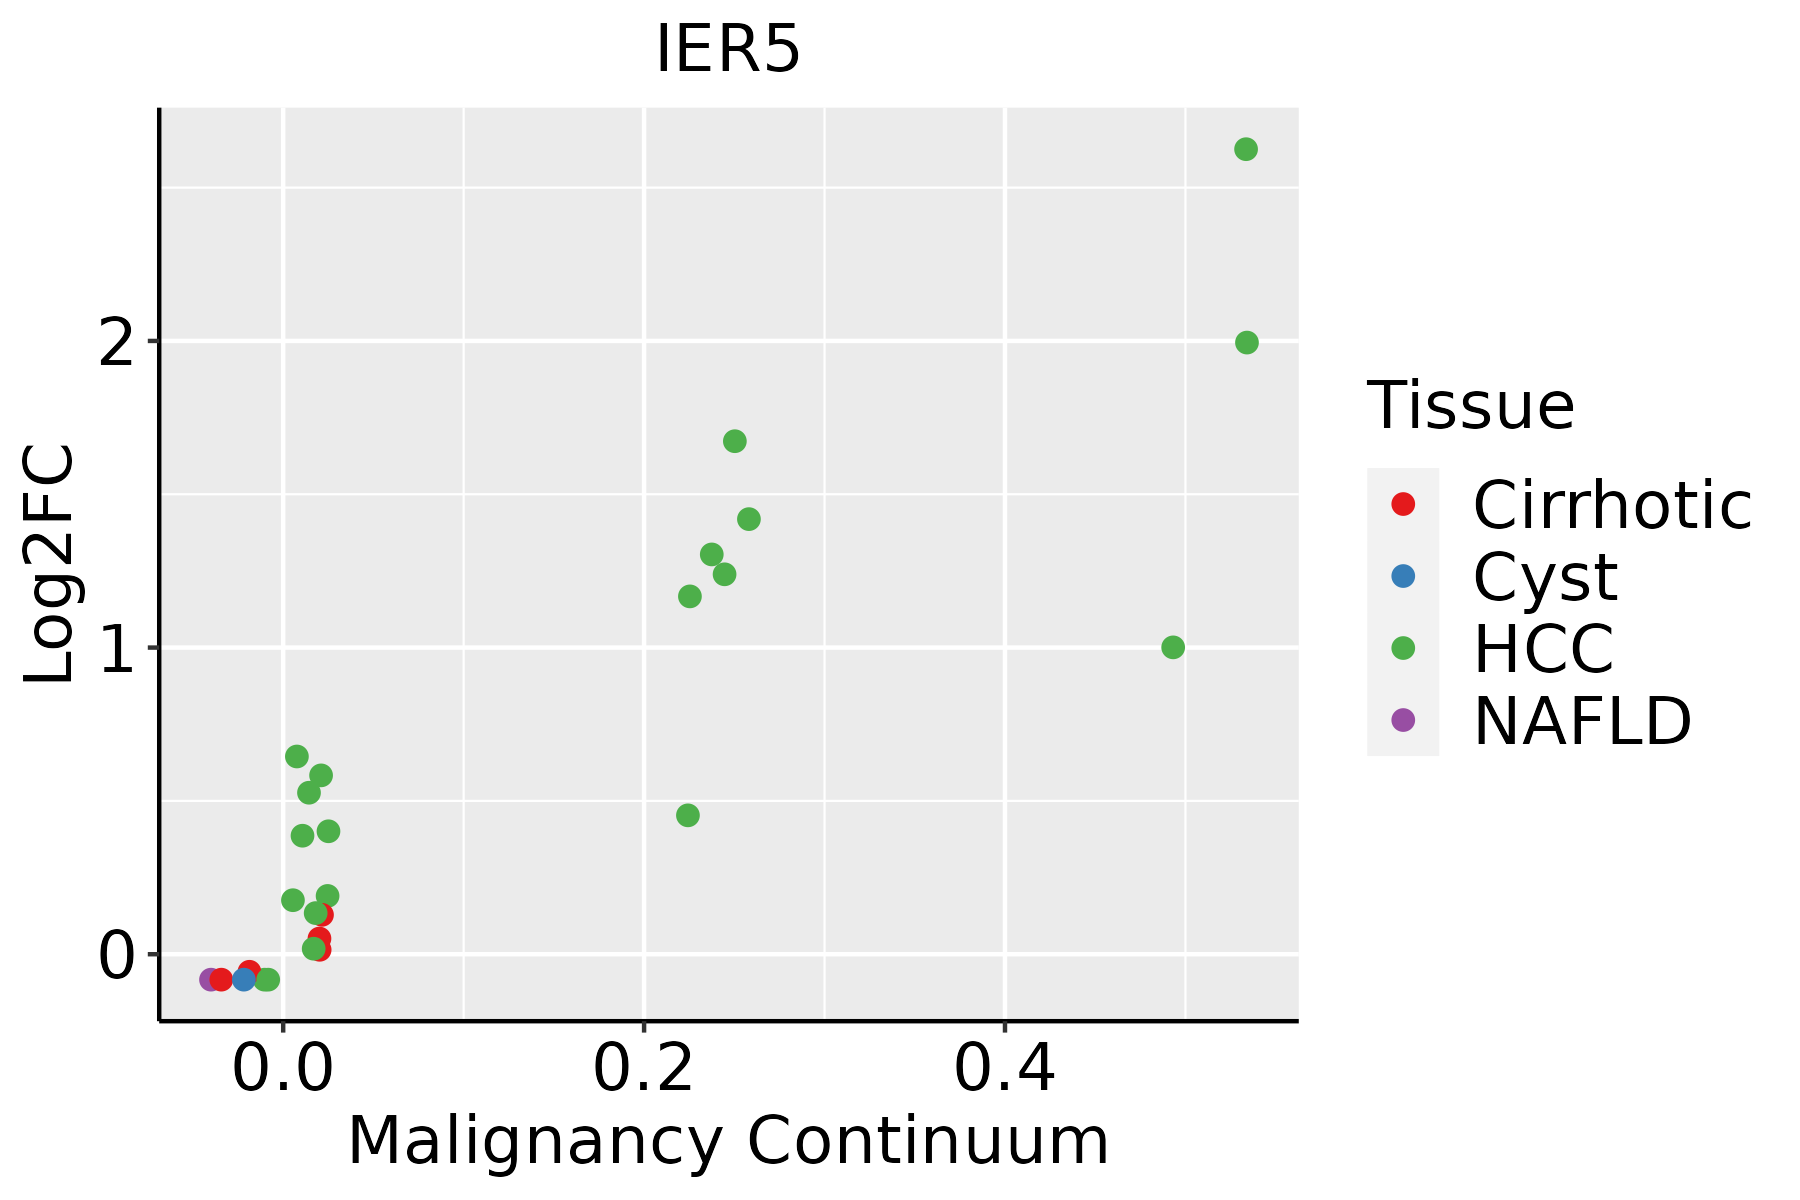 | HCC: Hepatocellular carcinoma |
| NAFLD: Non-alcoholic fatty liver disease | ||
| Lung |  | AAH: Atypical adenomatous hyperplasia |
| AIS: Adenocarcinoma in situ | ||
| IAC: Invasive lung adenocarcinoma | ||
| MIA: Minimally invasive adenocarcinoma | ||
| Oral Cavity | 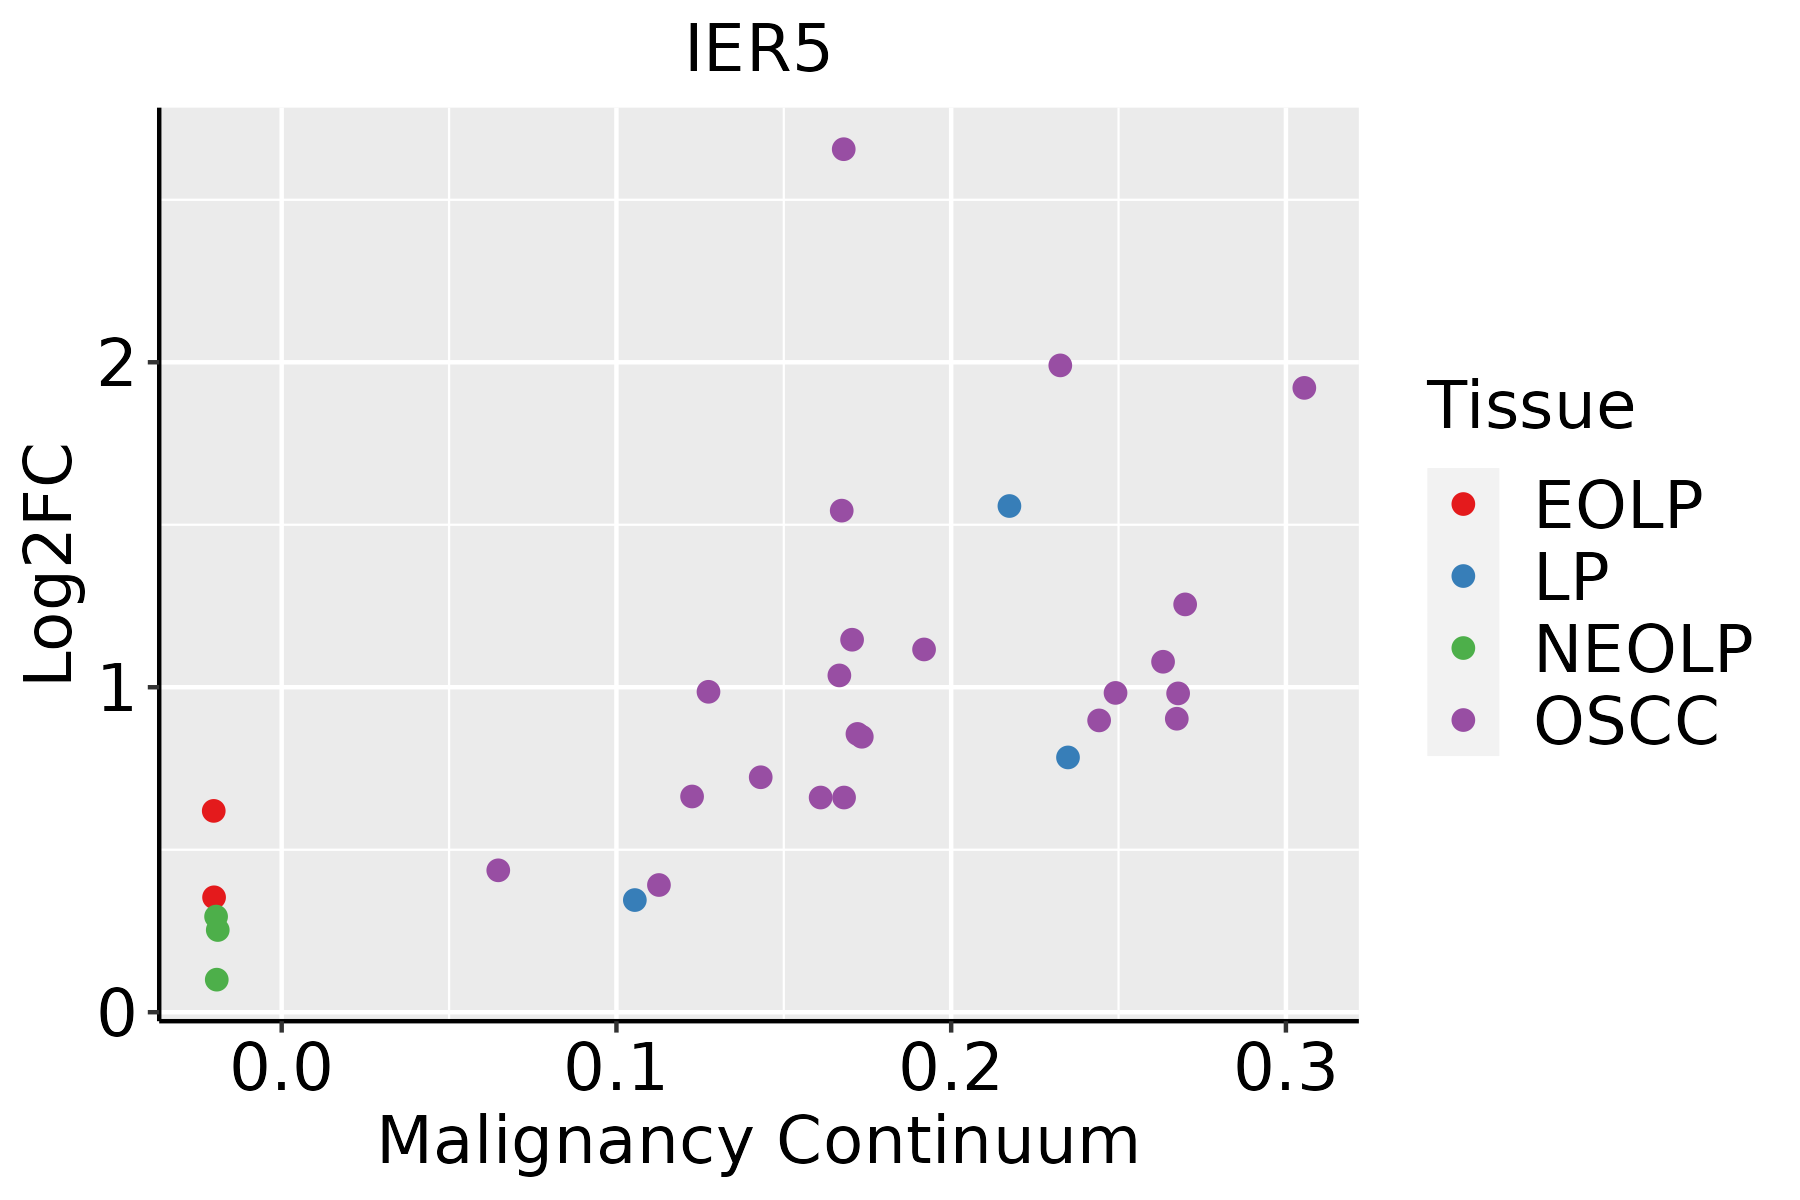 | EOLP: Erosive Oral lichen planus |
| LP: leukoplakia | ||
| NEOLP: Non-erosive oral lichen planus | ||
| OSCC: Oral squamous cell carcinoma | ||
| Prostate | 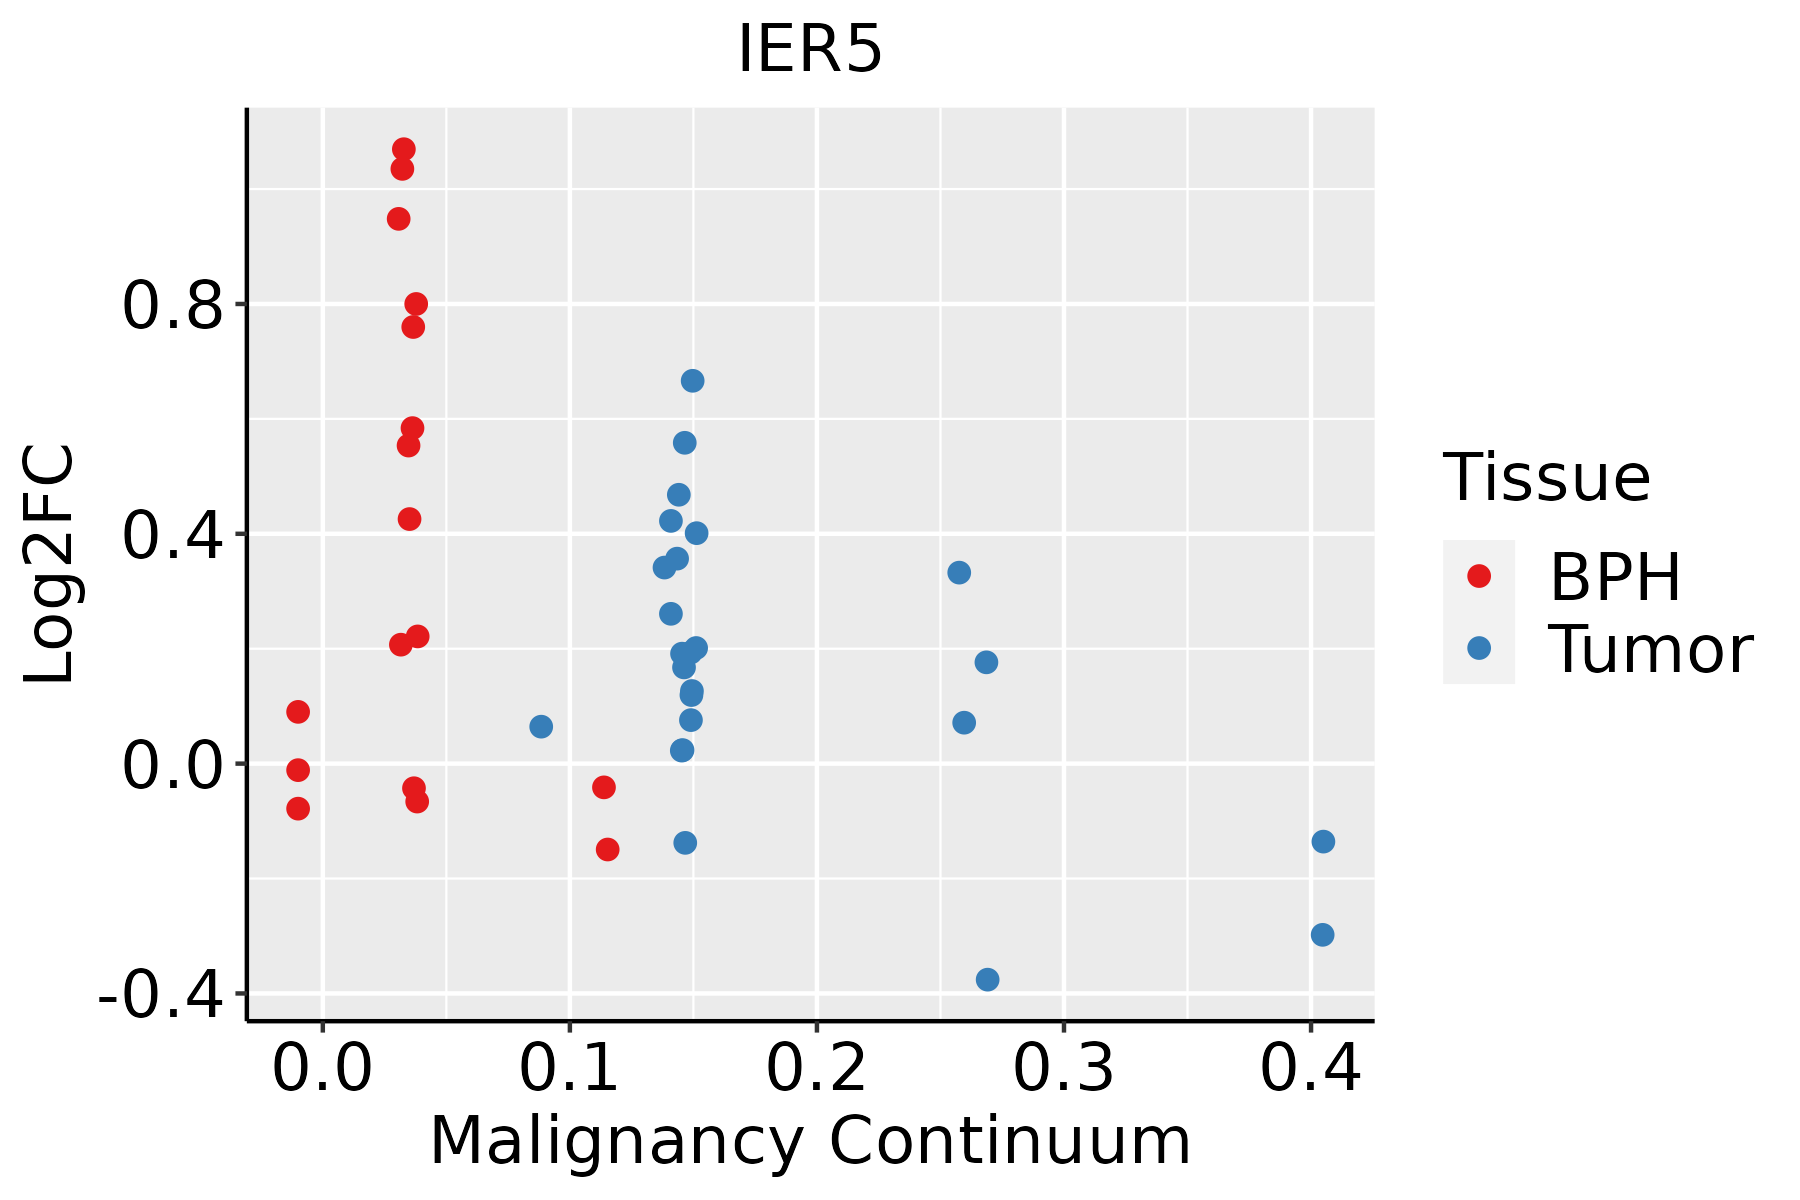 | BPH: Benign Prostatic Hyperplasia |
| Skin |  | AK: Actinic keratosis |
| cSCC: Cutaneous squamous cell carcinoma | ||
| SCCIS:squamous cell carcinoma in situ | ||
| Thyroid | 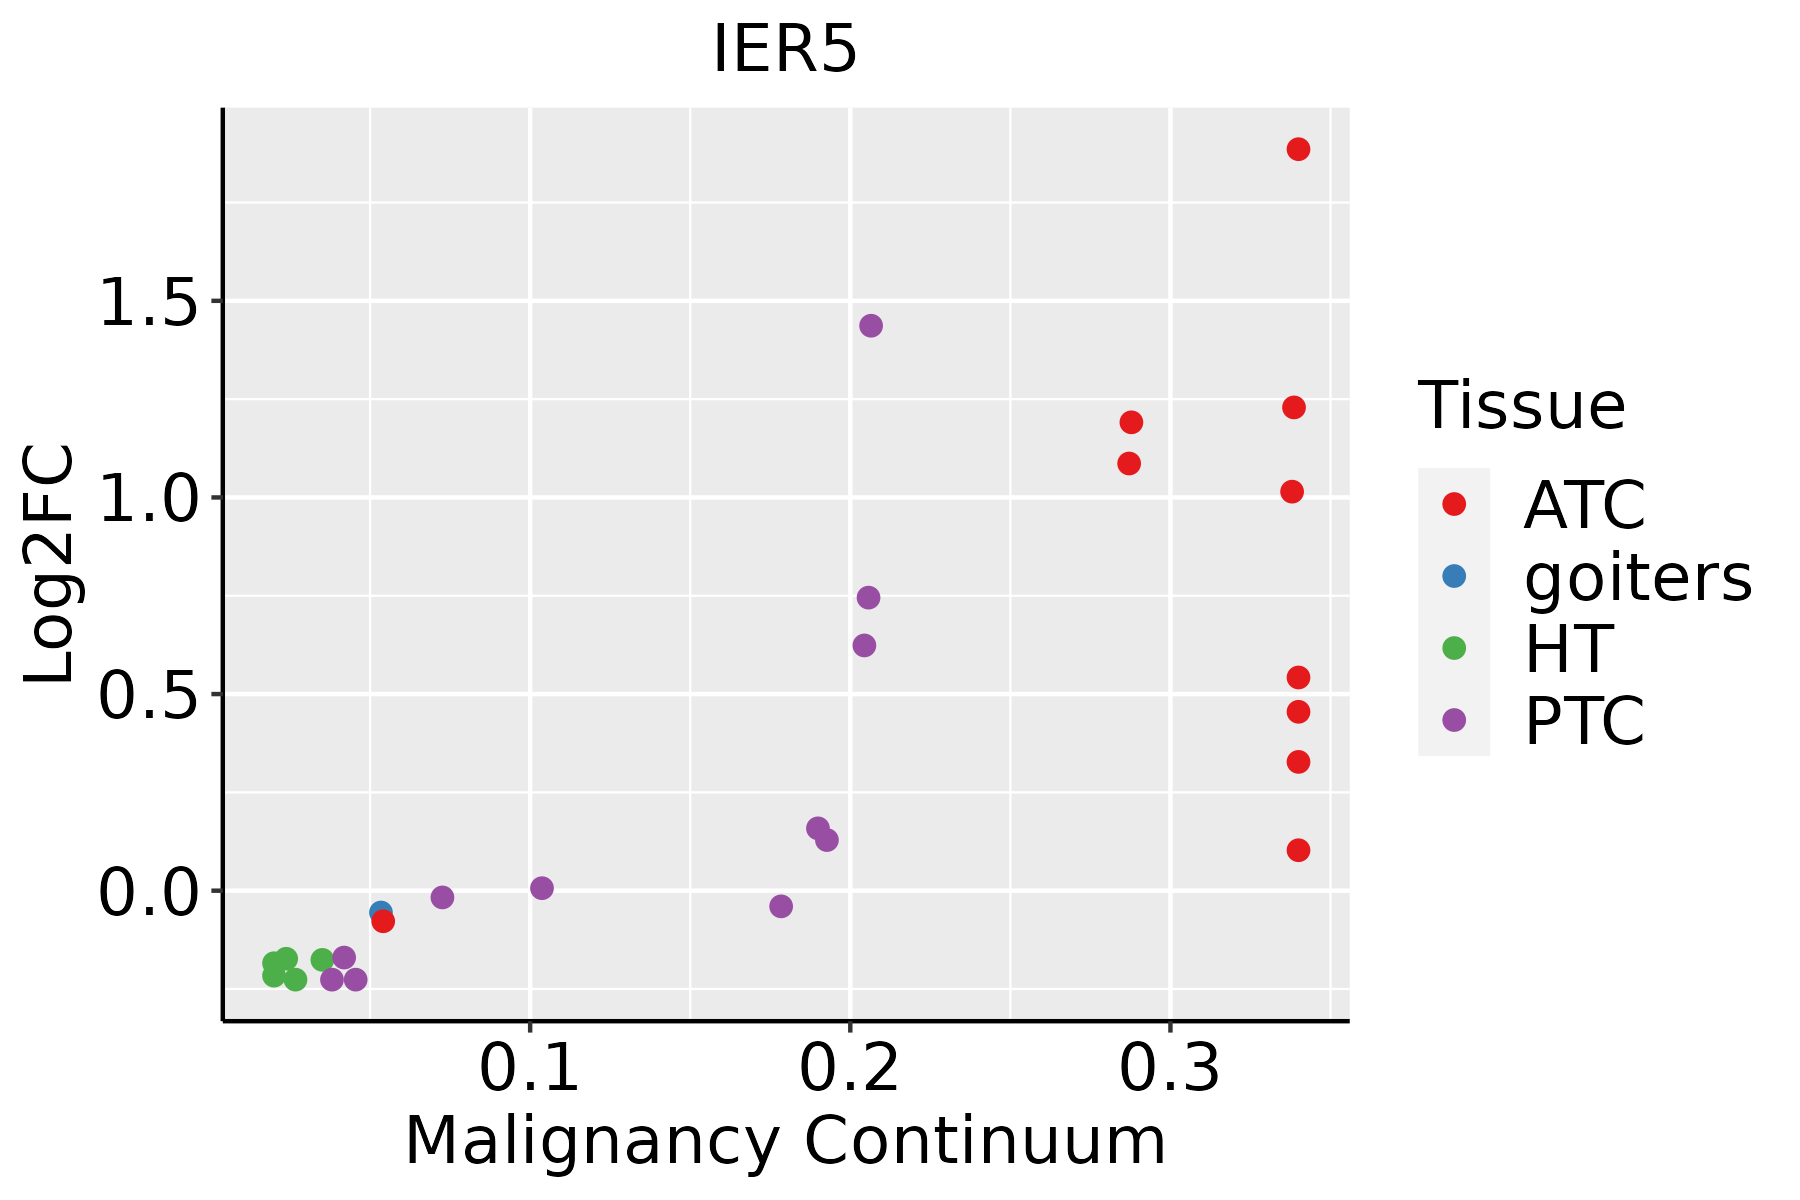 | ATC: Anaplastic thyroid cancer |
| HT: Hashimoto's thyroiditis | ||
| PTC: Papillary thyroid cancer |
| ∗log2FC in expression of this searched gene in stem-like cells from each diseased tissue sample relative to stem-like cells in normal samples in each tissue plotted against the malignancy continuum. Samples are colored based on if they are from different disease stage. |
Top |
Malignant transformation related pathway analysis |
| Find out the enriched GO biological processes and KEGG pathways involved in transition from healthy to precancer to cancer |
| Tissue | Disease Stage | Enriched GO biological Processes |
| Colorectum | AD |  |
| Colorectum | SER |  |
| Colorectum | MSS |  |
| Colorectum | MSI-H |  |
| Colorectum | FAP |  |
| ∗Top 15 enriched GO BP terms are showed in the bar plot of each disease state in each tissue. Each row represents a significant GO biological process which is colored according to the -log10(p.adjust). |
| Page: 1 2 3 4 5 6 7 8 9 |
| GO ID | Tissue | Disease Stage | Description | Gene Ratio | Bg Ratio | pvalue | p.adjust | Count |
| GO:003460510 | Cervix | CC | cellular response to heat | 22/2311 | 69/18723 | 1.65e-05 | 3.20e-04 | 22 |
| GO:00094089 | Cervix | CC | response to heat | 27/2311 | 110/18723 | 3.12e-04 | 3.32e-03 | 27 |
| GO:00092668 | Cervix | CC | response to temperature stimulus | 37/2311 | 178/18723 | 9.45e-04 | 7.95e-03 | 37 |
| GO:000926613 | Cervix | HSIL_HPV | response to temperature stimulus | 17/737 | 178/18723 | 6.81e-04 | 9.17e-03 | 17 |
| GO:003460514 | Cervix | HSIL_HPV | cellular response to heat | 9/737 | 69/18723 | 1.48e-03 | 1.65e-02 | 9 |
| GO:000940813 | Cervix | HSIL_HPV | response to heat | 11/737 | 110/18723 | 4.05e-03 | 3.47e-02 | 11 |
| GO:0009408110 | Esophagus | ESCC | response to heat | 77/8552 | 110/18723 | 2.01e-07 | 3.11e-06 | 77 |
| GO:0034605111 | Esophagus | ESCC | cellular response to heat | 52/8552 | 69/18723 | 4.87e-07 | 6.53e-06 | 52 |
| GO:000926619 | Esophagus | ESCC | response to temperature stimulus | 106/8552 | 178/18723 | 1.30e-04 | 8.84e-04 | 106 |
| GO:190003412 | Esophagus | ESCC | regulation of cellular response to heat | 13/8552 | 17/18723 | 1.00e-02 | 3.42e-02 | 13 |
| GO:003460512 | Liver | HCC | cellular response to heat | 53/7958 | 69/18723 | 6.62e-09 | 1.70e-07 | 53 |
| GO:000940811 | Liver | HCC | response to heat | 76/7958 | 110/18723 | 1.48e-08 | 3.58e-07 | 76 |
| GO:000926611 | Liver | HCC | response to temperature stimulus | 101/7958 | 178/18723 | 8.55e-05 | 7.48e-04 | 101 |
| GO:1900034 | Liver | HCC | regulation of cellular response to heat | 15/7958 | 17/18723 | 1.31e-04 | 1.07e-03 | 15 |
| GO:00346058 | Lung | IAC | cellular response to heat | 17/2061 | 69/18723 | 1.06e-03 | 1.26e-02 | 17 |
| GO:003460519 | Oral cavity | OSCC | cellular response to heat | 51/7305 | 69/18723 | 4.00e-09 | 8.95e-08 | 51 |
| GO:000940817 | Oral cavity | OSCC | response to heat | 73/7305 | 110/18723 | 5.56e-09 | 1.21e-07 | 73 |
| GO:000926616 | Oral cavity | OSCC | response to temperature stimulus | 98/7305 | 178/18723 | 9.78e-06 | 1.03e-04 | 98 |
| GO:19000343 | Oral cavity | OSCC | regulation of cellular response to heat | 13/7305 | 17/18723 | 1.92e-03 | 8.94e-03 | 13 |
| GO:0034605110 | Oral cavity | LP | cellular response to heat | 37/4623 | 69/18723 | 2.35e-07 | 7.03e-06 | 37 |
| Page: 1 2 3 |
| Pathway ID | Tissue | Disease Stage | Description | Gene Ratio | Bg Ratio | pvalue | p.adjust | qvalue | Count |
| Page: 1 |
Top |
Cell-cell communication analysis |
| Identification of potential cell-cell interactions between two cell types and their ligand-receptor pairs for different disease states |
| Ligand | Receptor | LRpair | Pathway | Tissue | Disease Stage |
| Page: 1 |
Top |
Single-cell gene regulatory network inference analysis |
| Find out the significant the regulons (TFs) and the target genes of each regulon across cell types for different disease states |
| TF | Cell Type | Tissue | Disease Stage | Target Gene | RSS | Regulon Activity |
| ∗The dot plots of a searched regulon are shown for all cell subpopulations in each disease state of each tissue based on the regulon specific score inferred using pySCENIC and by calculating the average expression. |
| Page: 1 |
Top |
Somatic mutation of malignant transformation related genes |
| Annotation of somatic variants for genes involved in malignant transformation |
| Hugo Symbol | Variant Class | Variant Classification | dbSNP RS | HGVSc | HGVSp | HGVSp Short | SWISSPROT | BIOTYPE | SIFT | PolyPhen | Tumor Sample Barcode | Tissue | Histology | Sex | Age | Stage | Therapy Types | Drugs | Outcome |
| IER5 | SNV | Missense_Mutation | c.914G>A | p.Gly305Glu | p.G305E | Q5VY09 | protein_coding | deleterious(0) | probably_damaging(0.921) | TCGA-AN-A0FX-01 | Breast | breast invasive carcinoma | Female | <65 | I/II | Unknown | Unknown | SD | |
| IER5 | SNV | Missense_Mutation | novel | c.12N>C | p.Lys4Asn | p.K4N | Q5VY09 | protein_coding | deleterious(0) | probably_damaging(0.966) | TCGA-LD-A74U-01 | Breast | breast invasive carcinoma | Female | >=65 | III/IV | Chemotherapy | taxotere | SD |
| IER5 | SNV | Missense_Mutation | novel | c.148N>A | p.Asp50Asn | p.D50N | Q5VY09 | protein_coding | deleterious(0) | probably_damaging(0.979) | TCGA-C5-A2LY-01 | Cervix | cervical & endocervical cancer | Female | <65 | I/II | Chemotherapy | cisplatin | SD |
| IER5 | SNV | Missense_Mutation | c.35G>A | p.Ser12Asn | p.S12N | Q5VY09 | protein_coding | tolerated(0.13) | probably_damaging(0.999) | TCGA-CK-4951-01 | Colorectum | colon adenocarcinoma | Female | >=65 | I/II | Unknown | Unknown | PD | |
| IER5 | SNV | Missense_Mutation | c.831C>A | p.Phe277Leu | p.F277L | Q5VY09 | protein_coding | deleterious(0) | probably_damaging(0.998) | TCGA-F5-6814-01 | Colorectum | rectum adenocarcinoma | Male | <65 | I/II | Unknown | Unknown | SD | |
| IER5 | SNV | Missense_Mutation | novel | c.182N>T | p.Ala61Val | p.A61V | Q5VY09 | protein_coding | tolerated(0.35) | possibly_damaging(0.583) | TCGA-AJ-A2QO-01 | Endometrium | uterine corpus endometrioid carcinoma | Female | >=65 | I/II | Unknown | Unknown | SD |
| IER5 | SNV | Missense_Mutation | novel | c.728N>A | p.Arg243His | p.R243H | Q5VY09 | protein_coding | deleterious(0) | probably_damaging(0.999) | TCGA-AP-A1DK-01 | Endometrium | uterine corpus endometrioid carcinoma | Female | <65 | I/II | Unknown | Unknown | SD |
| IER5 | SNV | Missense_Mutation | c.831N>A | p.Phe277Leu | p.F277L | Q5VY09 | protein_coding | deleterious(0) | probably_damaging(0.998) | TCGA-BS-A0UV-01 | Endometrium | uterine corpus endometrioid carcinoma | Female | <65 | III/IV | Unknown | Unknown | SD | |
| IER5 | SNV | Missense_Mutation | c.802N>G | p.Asn268Asp | p.N268D | Q5VY09 | protein_coding | deleterious(0.02) | probably_damaging(0.963) | TCGA-D1-A15X-01 | Endometrium | uterine corpus endometrioid carcinoma | Female | <65 | I/II | Unknown | Unknown | SD | |
| IER5 | SNV | Missense_Mutation | novel | c.74N>A | p.Arg25His | p.R25H | Q5VY09 | protein_coding | deleterious(0) | probably_damaging(0.999) | TCGA-EO-A3B0-01 | Endometrium | uterine corpus endometrioid carcinoma | Female | <65 | III/IV | Unknown | Unknown | SD |
| Page: 1 2 |
Top |
Related drugs of malignant transformation related genes |
| Identification of chemicals and drugs interact with genes involved in malignant transfromation |
| (DGIdb 4.0) |
| Entrez ID | Symbol | Category | Interaction Types | Drug Claim Name | Drug Name | PMIDs |
| Page: 1 |

Copyright 2023-Present -The University of Texas Health Science Center at Houston |