
|
|||||
|
 | |
| |
| |
| |
| |
| |
|
Gene: IER3IP1 |
Gene summary for IER3IP1 |
| Gene information | Species | Human | Gene symbol | IER3IP1 | Gene ID | 51124 |
| Gene name | immediate early response 3 interacting protein 1 | |
| Gene Alias | HSPC039 | |
| Cytomap | 18q21.1 | |
| Gene Type | protein-coding | GO ID | GO:0003330 | UniProtAcc | Q9Y5U9 |
Top |
Malignant transformation analysis |
| Identification of the aberrant gene expression in precancerous and cancerous lesions by comparing the gene expression of stem-like cells in diseased tissues with normal stem cells |
| Entrez ID | Symbol | Replicates | Species | Organ | Tissue | Adj P-value | Log2FC | Malignancy |
| 51124 | IER3IP1 | AEH-subject1 | Human | Endometrium | AEH | 8.75e-07 | -3.13e-01 | -0.3059 |
| 51124 | IER3IP1 | AEH-subject2 | Human | Endometrium | AEH | 9.29e-13 | -2.74e-01 | -0.2525 |
| 51124 | IER3IP1 | AEH-subject3 | Human | Endometrium | AEH | 6.80e-08 | -2.56e-01 | -0.2576 |
| 51124 | IER3IP1 | AEH-subject4 | Human | Endometrium | AEH | 9.37e-10 | -2.55e-01 | -0.2657 |
| 51124 | IER3IP1 | EEC-subject1 | Human | Endometrium | EEC | 1.88e-08 | -2.66e-01 | -0.2682 |
| 51124 | IER3IP1 | EEC-subject2 | Human | Endometrium | EEC | 2.45e-06 | -3.34e-01 | -0.2607 |
| 51124 | IER3IP1 | EEC-subject3 | Human | Endometrium | EEC | 7.11e-34 | -3.20e-01 | -0.2525 |
| 51124 | IER3IP1 | EEC-subject4 | Human | Endometrium | EEC | 3.48e-05 | -2.03e-01 | -0.2571 |
| 51124 | IER3IP1 | EEC-subject5 | Human | Endometrium | EEC | 1.06e-02 | -1.02e-01 | -0.249 |
| 51124 | IER3IP1 | GSM6177620_NYU_UCEC1_lib1_lib1 | Human | Endometrium | EEC | 1.74e-29 | -1.84e-01 | -0.1869 |
| 51124 | IER3IP1 | GSM6177620_NYU_UCEC1_lib2_lib2 | Human | Endometrium | EEC | 8.26e-30 | -2.89e-01 | -0.1875 |
| 51124 | IER3IP1 | GSM6177620_NYU_UCEC1_lib3_lib3 | Human | Endometrium | EEC | 4.78e-34 | -3.21e-01 | -0.1883 |
| 51124 | IER3IP1 | GSM6177621_NYU_UCEC2_lib1_lib1 | Human | Endometrium | EEC | 5.06e-22 | -1.62e-01 | -0.1934 |
| 51124 | IER3IP1 | GSM6177622_NYU_UCEC3_lib1_lib1 | Human | Endometrium | EEC | 8.10e-39 | -1.70e-01 | -0.1917 |
| 51124 | IER3IP1 | GSM6177622_NYU_UCEC3_lib2_lib2 | Human | Endometrium | EEC | 3.38e-40 | -1.67e-01 | -0.1916 |
| 51124 | IER3IP1 | GSM6177623_NYU_UCEC3_Vis | Human | Endometrium | EEC | 1.83e-02 | -1.62e-01 | -0.1269 |
| 51124 | IER3IP1 | LZE2T | Human | Esophagus | ESCC | 1.43e-03 | 8.59e-01 | 0.082 |
| 51124 | IER3IP1 | LZE4T | Human | Esophagus | ESCC | 9.71e-21 | 7.71e-01 | 0.0811 |
| 51124 | IER3IP1 | LZE7T | Human | Esophagus | ESCC | 3.44e-13 | 1.08e+00 | 0.0667 |
| 51124 | IER3IP1 | LZE8T | Human | Esophagus | ESCC | 1.85e-02 | 2.40e-01 | 0.067 |
| Page: 1 2 3 4 5 6 7 |
| Tissue | Expression Dynamics | Abbreviation |
| Endometrium | 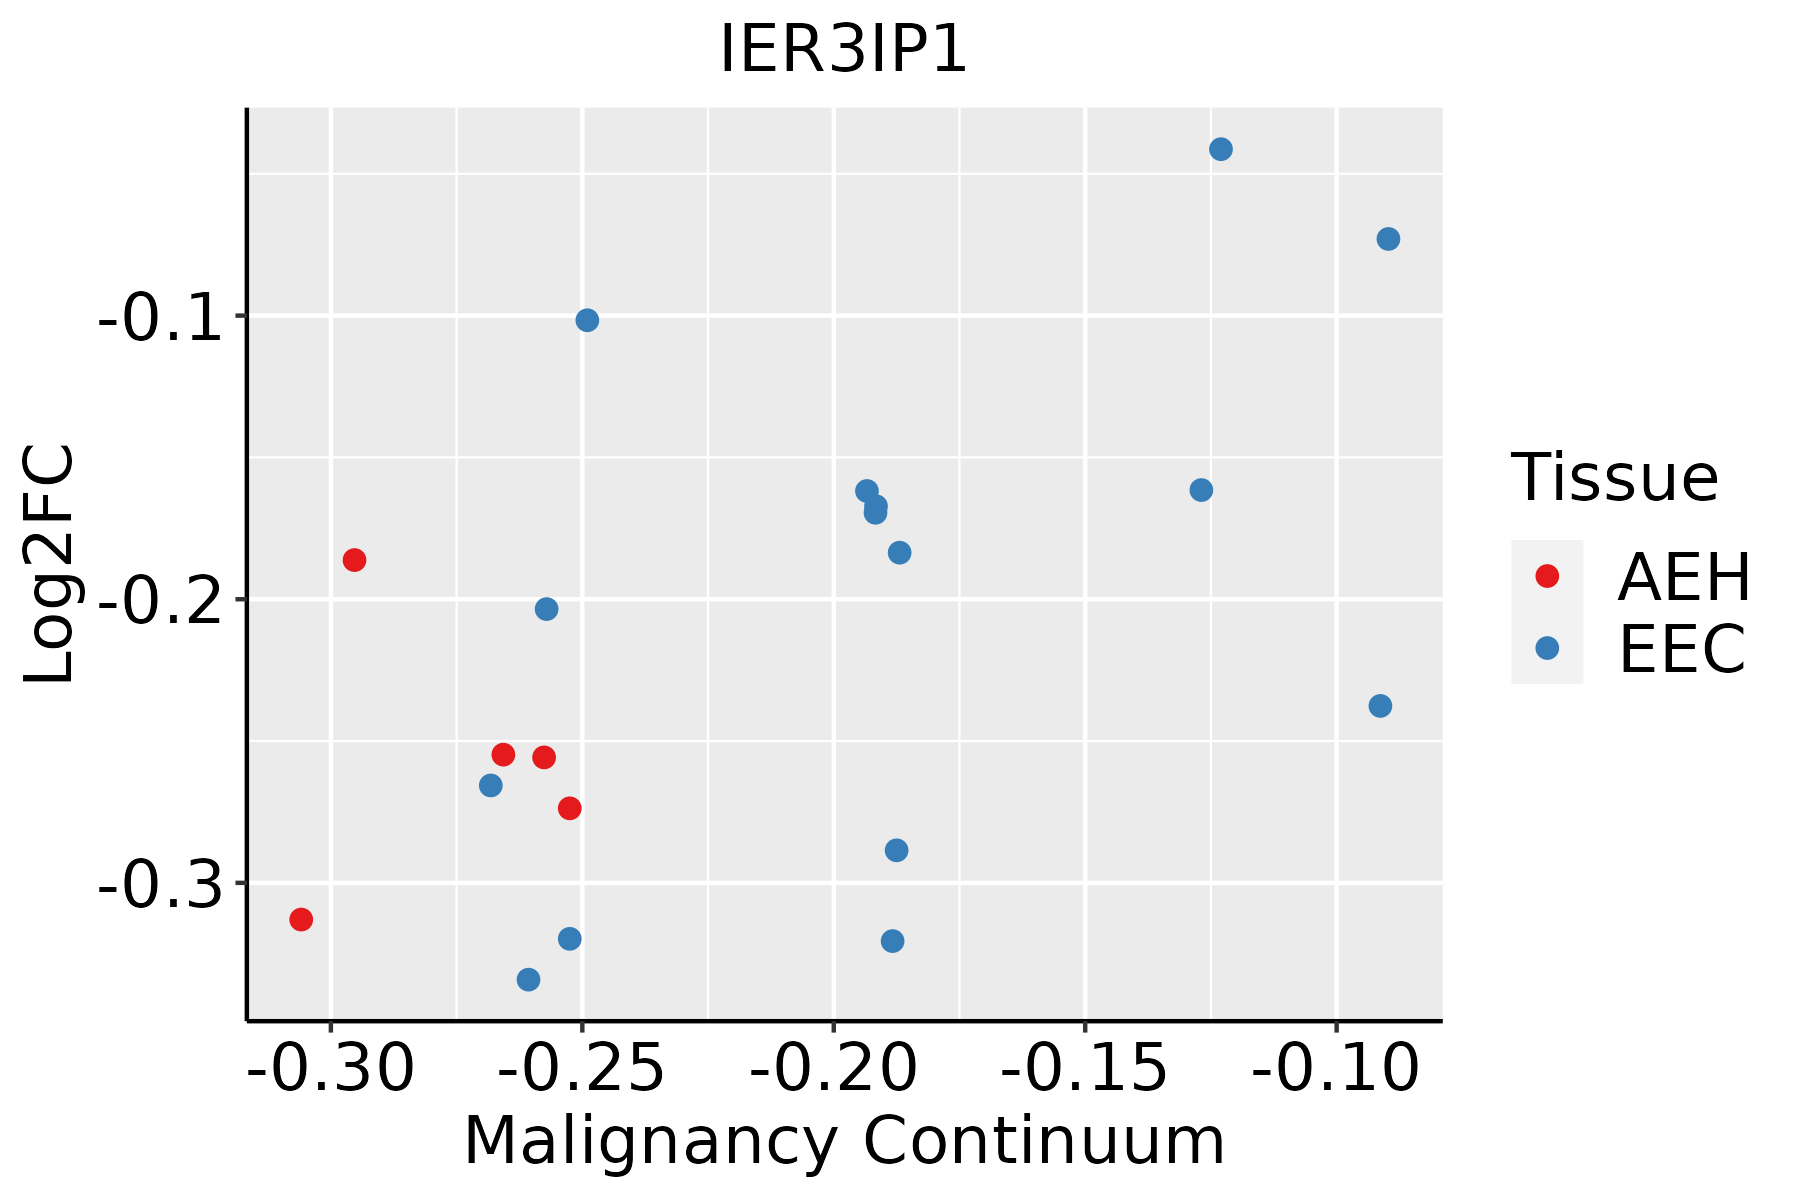 | AEH: Atypical endometrial hyperplasia |
| EEC: Endometrioid Cancer | ||
| Esophagus |  | ESCC: Esophageal squamous cell carcinoma |
| HGIN: High-grade intraepithelial neoplasias | ||
| LGIN: Low-grade intraepithelial neoplasias | ||
| Liver |  | HCC: Hepatocellular carcinoma |
| NAFLD: Non-alcoholic fatty liver disease | ||
| Oral Cavity |  | EOLP: Erosive Oral lichen planus |
| LP: leukoplakia | ||
| NEOLP: Non-erosive oral lichen planus | ||
| OSCC: Oral squamous cell carcinoma | ||
| Thyroid | 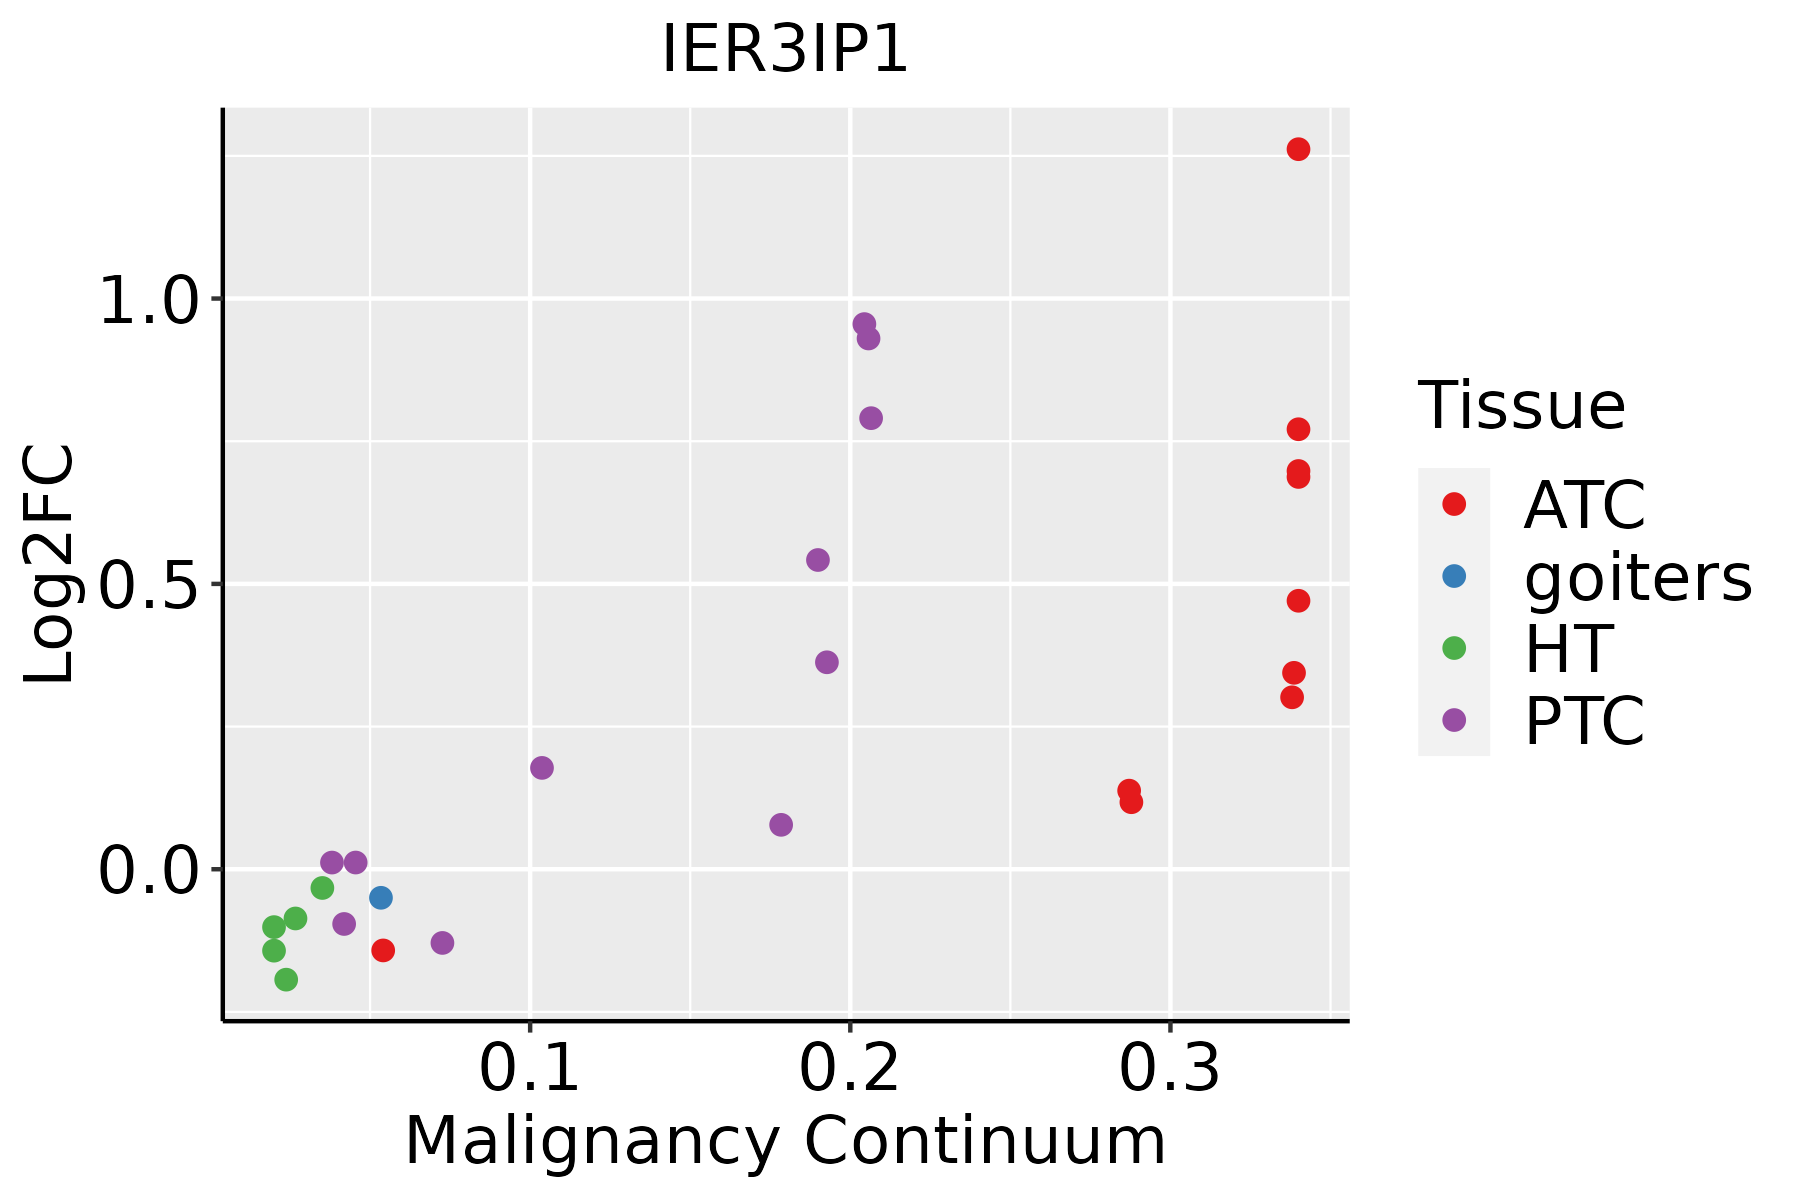 | ATC: Anaplastic thyroid cancer |
| HT: Hashimoto's thyroiditis | ||
| PTC: Papillary thyroid cancer |
| ∗log2FC in expression of this searched gene in stem-like cells from each diseased tissue sample relative to stem-like cells in normal samples in each tissue plotted against the malignancy continuum. Samples are colored based on if they are from different disease stage. |
Top |
Malignant transformation related pathway analysis |
| Find out the enriched GO biological processes and KEGG pathways involved in transition from healthy to precancer to cancer |
| Tissue | Disease Stage | Enriched GO biological Processes |
| Colorectum | AD |  |
| Colorectum | SER |  |
| Colorectum | MSS |  |
| Colorectum | MSI-H |  |
| Colorectum | FAP |  |
| ∗Top 15 enriched GO BP terms are showed in the bar plot of each disease state in each tissue. Each row represents a significant GO biological process which is colored according to the -log10(p.adjust). |
| Page: 1 2 3 4 5 6 7 8 9 |
| GO ID | Tissue | Disease Stage | Description | Gene Ratio | Bg Ratio | pvalue | p.adjust | Count |
| GO:190495115 | Endometrium | AEH | positive regulation of establishment of protein localization | 74/2100 | 319/18723 | 7.05e-10 | 6.51e-08 | 74 |
| GO:005122215 | Endometrium | AEH | positive regulation of protein transport | 66/2100 | 303/18723 | 7.79e-08 | 3.99e-06 | 66 |
| GO:00481939 | Endometrium | AEH | Golgi vesicle transport | 60/2100 | 296/18723 | 3.65e-06 | 9.79e-05 | 60 |
| GO:00068886 | Endometrium | AEH | endoplasmic reticulum to Golgi vesicle-mediated transport | 29/2100 | 130/18723 | 2.11e-04 | 2.59e-03 | 29 |
| GO:00507087 | Endometrium | AEH | regulation of protein secretion | 49/2100 | 268/18723 | 3.83e-04 | 4.12e-03 | 49 |
| GO:00507149 | Endometrium | AEH | positive regulation of protein secretion | 28/2100 | 137/18723 | 1.17e-03 | 1.01e-02 | 28 |
| GO:0035265 | Endometrium | AEH | organ growth | 33/2100 | 178/18723 | 2.53e-03 | 1.87e-02 | 33 |
| GO:00716927 | Endometrium | AEH | protein localization to extracellular region | 58/2100 | 368/18723 | 4.72e-03 | 3.00e-02 | 58 |
| GO:00093068 | Endometrium | AEH | protein secretion | 56/2100 | 359/18723 | 6.71e-03 | 3.94e-02 | 56 |
| GO:00355928 | Endometrium | AEH | establishment of protein localization to extracellular region | 56/2100 | 360/18723 | 7.10e-03 | 4.09e-02 | 56 |
| GO:190495116 | Endometrium | EEC | positive regulation of establishment of protein localization | 74/2168 | 319/18723 | 2.90e-09 | 2.10e-07 | 74 |
| GO:005122216 | Endometrium | EEC | positive regulation of protein transport | 66/2168 | 303/18723 | 2.55e-07 | 1.09e-05 | 66 |
| GO:004819313 | Endometrium | EEC | Golgi vesicle transport | 60/2168 | 296/18723 | 9.91e-06 | 2.17e-04 | 60 |
| GO:000688812 | Endometrium | EEC | endoplasmic reticulum to Golgi vesicle-mediated transport | 29/2168 | 130/18723 | 3.63e-04 | 3.95e-03 | 29 |
| GO:005070813 | Endometrium | EEC | regulation of protein secretion | 50/2168 | 268/18723 | 4.33e-04 | 4.51e-03 | 50 |
| GO:005071412 | Endometrium | EEC | positive regulation of protein secretion | 28/2168 | 137/18723 | 1.89e-03 | 1.45e-02 | 28 |
| GO:007169213 | Endometrium | EEC | protein localization to extracellular region | 59/2168 | 368/18723 | 5.98e-03 | 3.56e-02 | 59 |
| GO:00352651 | Endometrium | EEC | organ growth | 32/2168 | 178/18723 | 7.54e-03 | 4.22e-02 | 32 |
| GO:000930614 | Endometrium | EEC | protein secretion | 57/2168 | 359/18723 | 8.30e-03 | 4.57e-02 | 57 |
| GO:003559214 | Endometrium | EEC | establishment of protein localization to extracellular region | 57/2168 | 360/18723 | 8.78e-03 | 4.74e-02 | 57 |
| Page: 1 2 3 4 5 |
| Pathway ID | Tissue | Disease Stage | Description | Gene Ratio | Bg Ratio | pvalue | p.adjust | qvalue | Count |
| Page: 1 |
Top |
Cell-cell communication analysis |
| Identification of potential cell-cell interactions between two cell types and their ligand-receptor pairs for different disease states |
| Ligand | Receptor | LRpair | Pathway | Tissue | Disease Stage |
| Page: 1 |
Top |
Single-cell gene regulatory network inference analysis |
| Find out the significant the regulons (TFs) and the target genes of each regulon across cell types for different disease states |
| TF | Cell Type | Tissue | Disease Stage | Target Gene | RSS | Regulon Activity |
| ∗The dot plots of a searched regulon are shown for all cell subpopulations in each disease state of each tissue based on the regulon specific score inferred using pySCENIC and by calculating the average expression. |
| Page: 1 |
Top |
Somatic mutation of malignant transformation related genes |
| Annotation of somatic variants for genes involved in malignant transformation |
| Hugo Symbol | Variant Class | Variant Classification | dbSNP RS | HGVSc | HGVSp | HGVSp Short | SWISSPROT | BIOTYPE | SIFT | PolyPhen | Tumor Sample Barcode | Tissue | Histology | Sex | Age | Stage | Therapy Types | Drugs | Outcome |
| IER3IP1 | SNV | Missense_Mutation | c.196N>T | p.Pro66Ser | p.P66S | Q9Y5U9 | protein_coding | deleterious(0.02) | possibly_damaging(0.874) | TCGA-A6-5665-01 | Colorectum | colon adenocarcinoma | Female | >=65 | I/II | Unknown | Unknown | PD | |
| IER3IP1 | SNV | Missense_Mutation | rs201912542 | c.175G>A | p.Val59Ile | p.V59I | Q9Y5U9 | protein_coding | tolerated(0.39) | benign(0.044) | TCGA-AP-A1DK-01 | Endometrium | uterine corpus endometrioid carcinoma | Female | <65 | I/II | Unknown | Unknown | SD |
| IER3IP1 | SNV | Missense_Mutation | novel | c.208N>T | p.Val70Leu | p.V70L | Q9Y5U9 | protein_coding | tolerated(0.74) | benign(0.009) | TCGA-E6-A1LX-01 | Endometrium | uterine corpus endometrioid carcinoma | Female | <65 | I/II | Unknown | Unknown | SD |
| IER3IP1 | SNV | Missense_Mutation | c.149N>T | p.Ser50Leu | p.S50L | Q9Y5U9 | protein_coding | tolerated(0.12) | benign(0.059) | TCGA-BR-8286-01 | Stomach | stomach adenocarcinoma | Male | <65 | I/II | Unknown | Unknown | SD |
| Page: 1 |
Top |
Related drugs of malignant transformation related genes |
| Identification of chemicals and drugs interact with genes involved in malignant transfromation |
| (DGIdb 4.0) |
| Entrez ID | Symbol | Category | Interaction Types | Drug Claim Name | Drug Name | PMIDs |
| Page: 1 |

Copyright 2023-Present -The University of Texas Health Science Center at Houston |