
|
|||||
|
 | |
| |
| |
| |
| |
| |
|
Gene: IER2 |
Gene summary for IER2 |
| Gene information | Species | Human | Gene symbol | IER2 | Gene ID | 9592 |
| Gene name | immediate early response 2 | |
| Gene Alias | ETR101 | |
| Cytomap | 19p13.13 | |
| Gene Type | protein-coding | GO ID | GO:0006139 | UniProtAcc | A0A024R7H1 |
Top |
Malignant transformation analysis |
| Identification of the aberrant gene expression in precancerous and cancerous lesions by comparing the gene expression of stem-like cells in diseased tissues with normal stem cells |
| Entrez ID | Symbol | Replicates | Species | Organ | Tissue | Adj P-value | Log2FC | Malignancy |
| 9592 | IER2 | GSM4909280 | Human | Breast | Precancer | 6.14e-05 | 5.24e-01 | 0.0305 |
| 9592 | IER2 | GSM4909282 | Human | Breast | IDC | 4.41e-49 | 7.48e-01 | -0.0288 |
| 9592 | IER2 | GSM4909285 | Human | Breast | IDC | 3.20e-19 | 4.68e-01 | 0.21 |
| 9592 | IER2 | GSM4909287 | Human | Breast | IDC | 6.43e-13 | 3.99e-01 | 0.2057 |
| 9592 | IER2 | GSM4909290 | Human | Breast | IDC | 4.77e-04 | -4.19e-01 | 0.2096 |
| 9592 | IER2 | GSM4909293 | Human | Breast | IDC | 4.04e-09 | 3.71e-01 | 0.1581 |
| 9592 | IER2 | GSM4909294 | Human | Breast | IDC | 1.37e-11 | -3.54e-01 | 0.2022 |
| 9592 | IER2 | GSM4909295 | Human | Breast | IDC | 5.86e-03 | 2.34e-01 | 0.0898 |
| 9592 | IER2 | GSM4909296 | Human | Breast | IDC | 6.36e-04 | -3.04e-01 | 0.1524 |
| 9592 | IER2 | GSM4909297 | Human | Breast | IDC | 8.80e-22 | 1.41e-01 | 0.1517 |
| 9592 | IER2 | GSM4909299 | Human | Breast | IDC | 3.81e-12 | 4.53e-01 | 0.035 |
| 9592 | IER2 | GSM4909300 | Human | Breast | IDC | 2.40e-02 | 3.84e-01 | 0.0334 |
| 9592 | IER2 | GSM4909301 | Human | Breast | IDC | 1.43e-12 | 3.68e-01 | 0.1577 |
| 9592 | IER2 | GSM4909303 | Human | Breast | IDC | 2.51e-03 | 3.66e-01 | 0.0438 |
| 9592 | IER2 | GSM4909304 | Human | Breast | IDC | 1.32e-05 | -4.15e-01 | 0.1636 |
| 9592 | IER2 | GSM4909305 | Human | Breast | IDC | 1.55e-09 | 4.34e-01 | 0.0436 |
| 9592 | IER2 | GSM4909306 | Human | Breast | IDC | 2.35e-24 | 4.85e-01 | 0.1564 |
| 9592 | IER2 | GSM4909308 | Human | Breast | IDC | 3.80e-53 | 8.00e-01 | 0.158 |
| 9592 | IER2 | GSM4909309 | Human | Breast | IDC | 2.43e-04 | 1.97e-01 | 0.0483 |
| 9592 | IER2 | GSM4909311 | Human | Breast | IDC | 1.29e-32 | -1.20e-01 | 0.1534 |
| Page: 1 2 3 4 5 6 7 8 9 10 11 12 13 14 15 |
| Tissue | Expression Dynamics | Abbreviation |
| Breast | 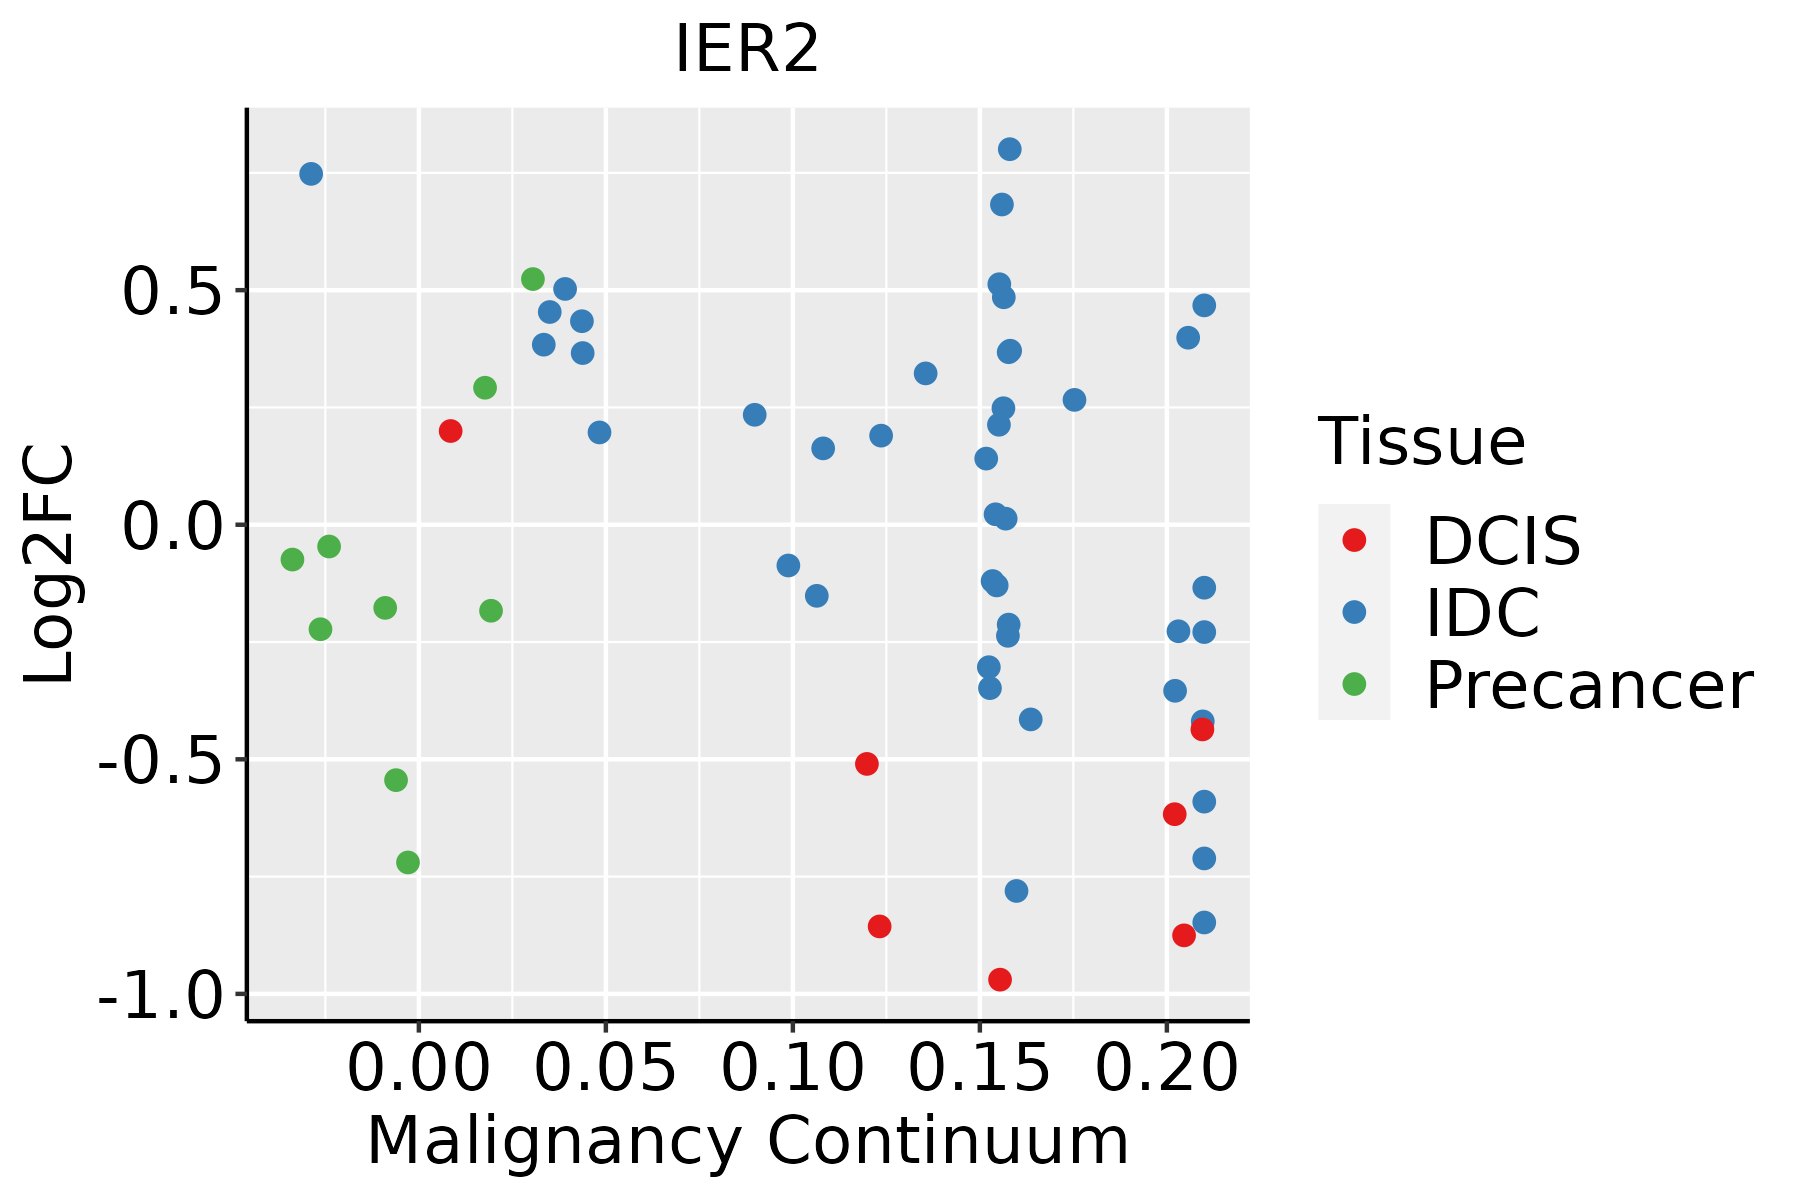 | IDC: Invasive ductal carcinoma |
| DCIS: Ductal carcinoma in situ | ||
| Precancer(BRCA1-mut): Precancerous lesion from BRCA1 mutation carriers | ||
| Cervix | 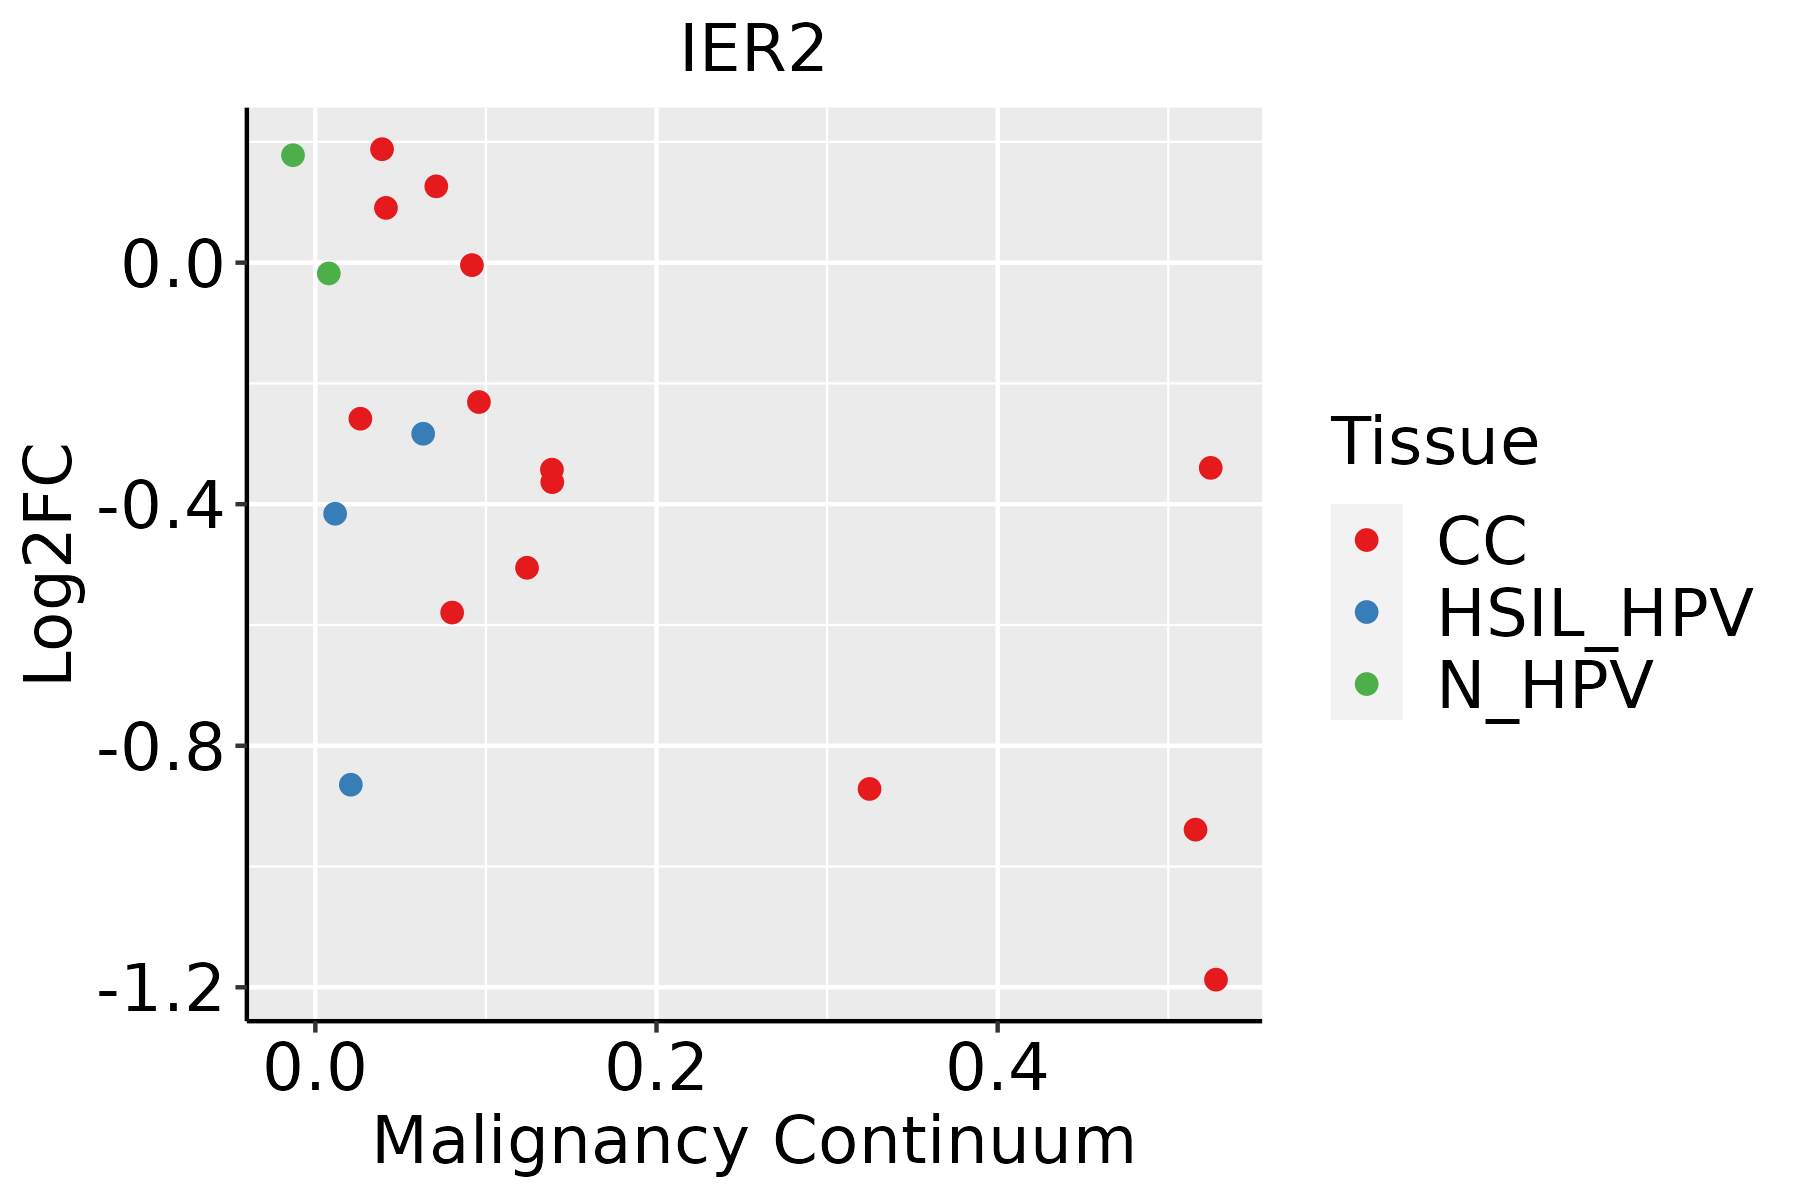 | CC: Cervix cancer |
| HSIL_HPV: HPV-infected high-grade squamous intraepithelial lesions | ||
| N_HPV: HPV-infected normal cervix | ||
| Colorectum (GSE201348) |  | FAP: Familial adenomatous polyposis |
| CRC: Colorectal cancer | ||
| Colorectum (HTA11) |  | AD: Adenomas |
| SER: Sessile serrated lesions | ||
| MSI-H: Microsatellite-high colorectal cancer | ||
| MSS: Microsatellite stable colorectal cancer | ||
| Endometrium | 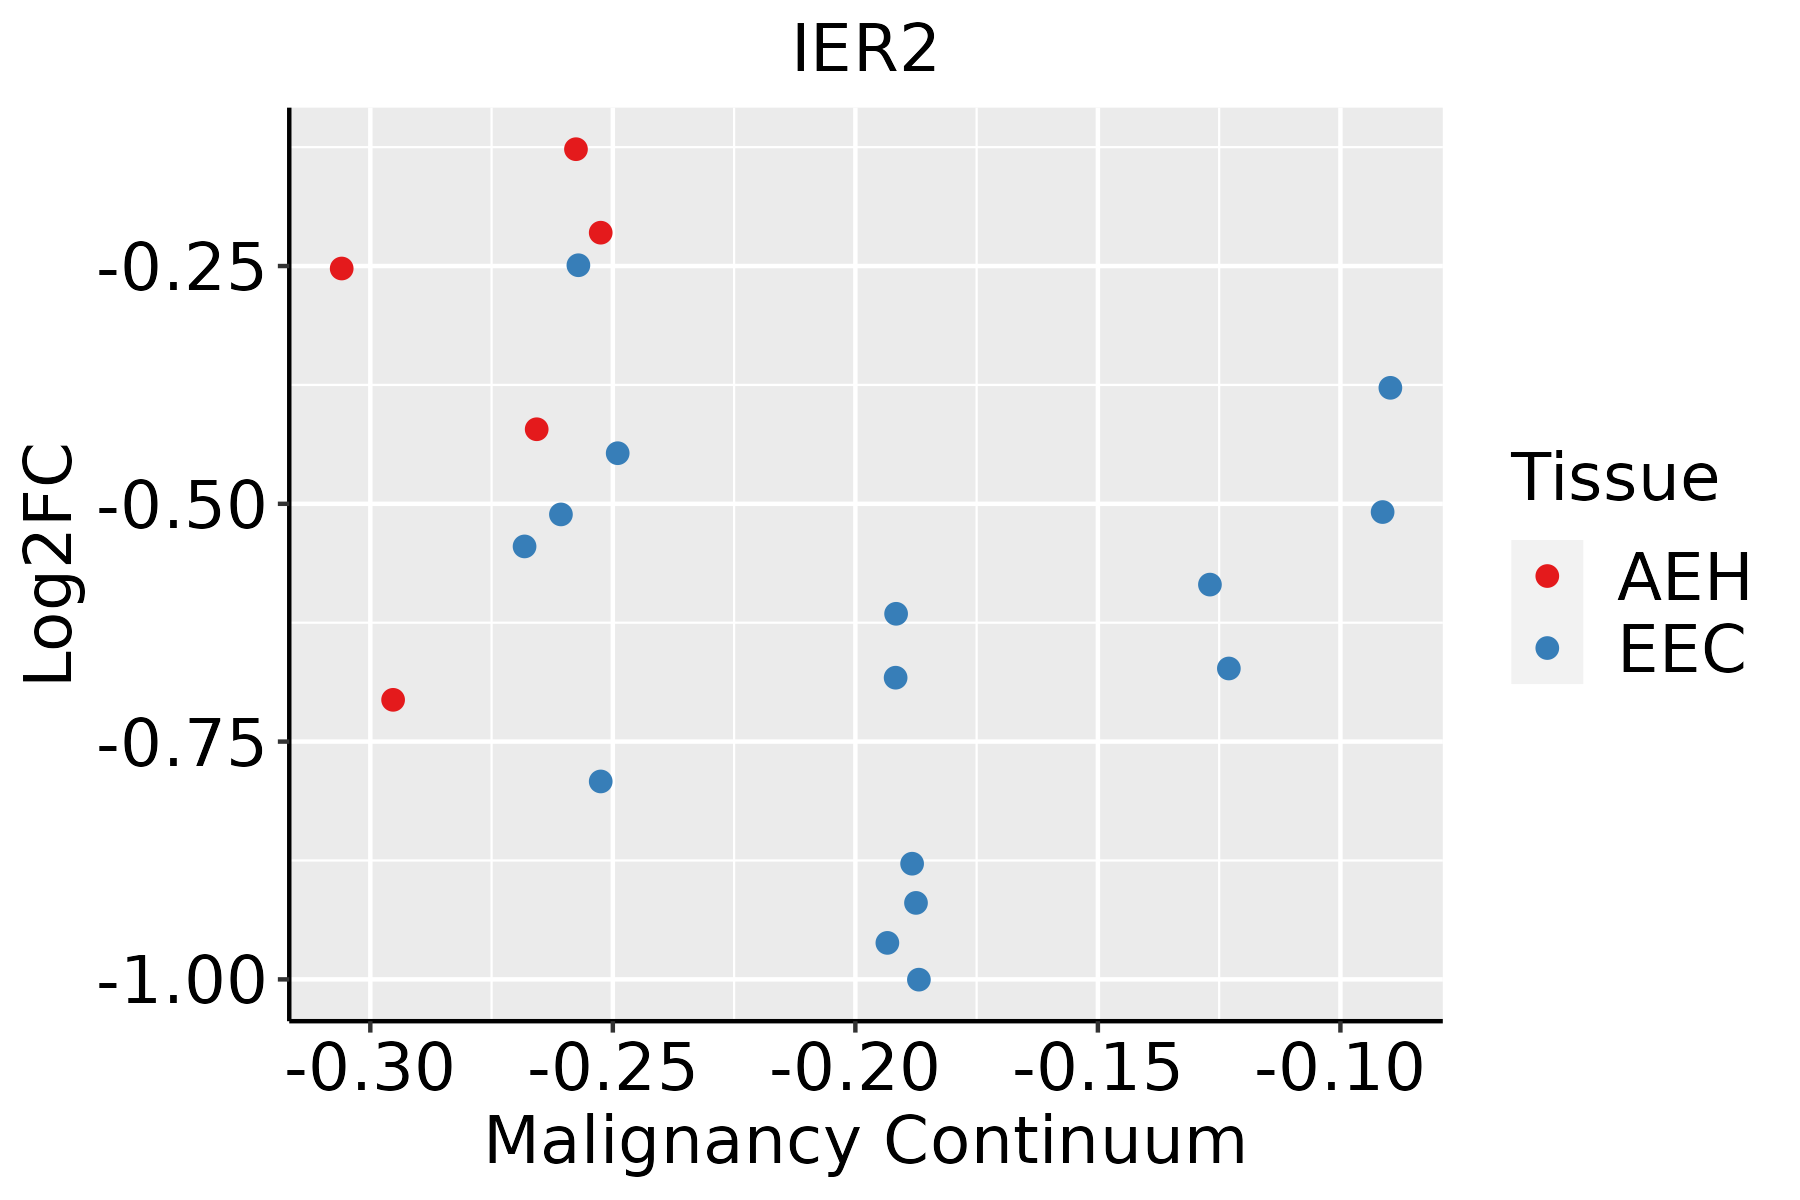 | AEH: Atypical endometrial hyperplasia |
| EEC: Endometrioid Cancer | ||
| Esophagus | 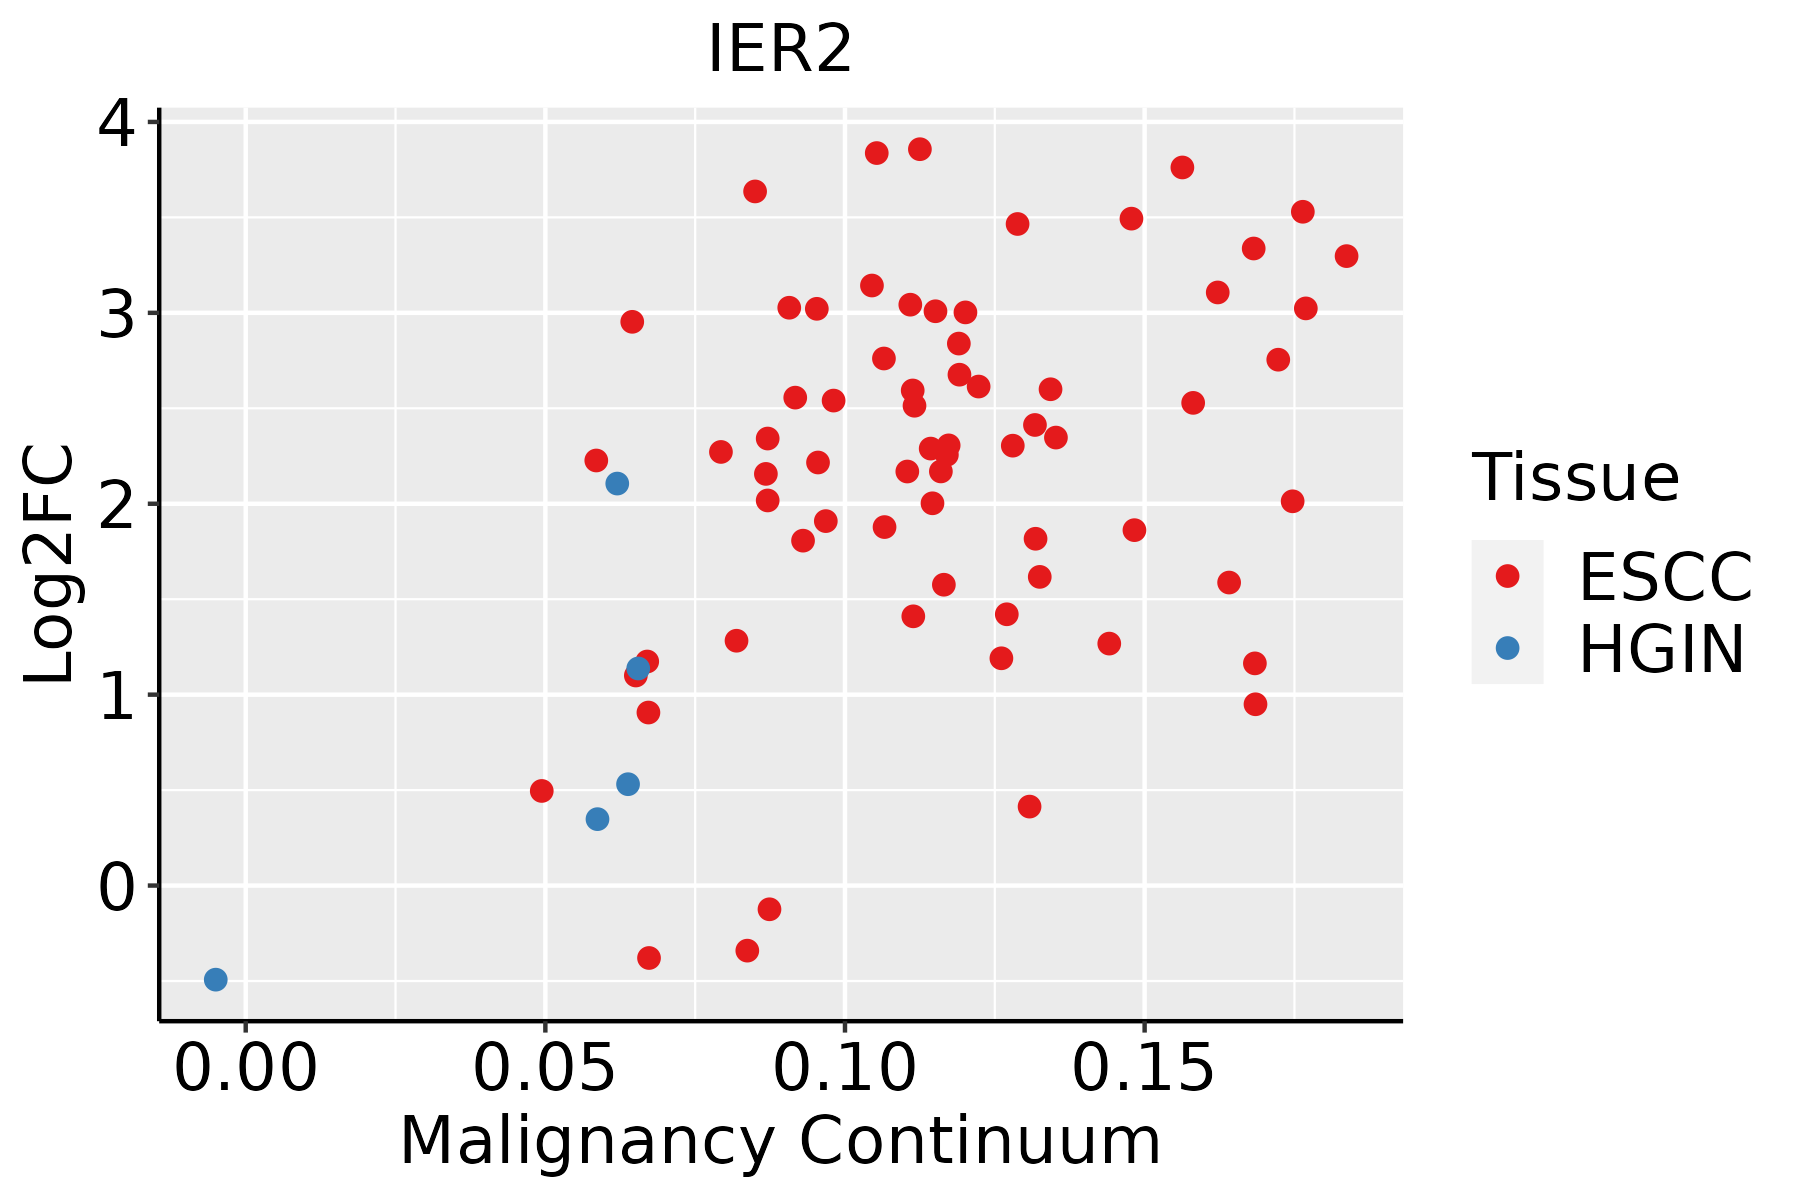 | ESCC: Esophageal squamous cell carcinoma |
| HGIN: High-grade intraepithelial neoplasias | ||
| LGIN: Low-grade intraepithelial neoplasias | ||
| GC | 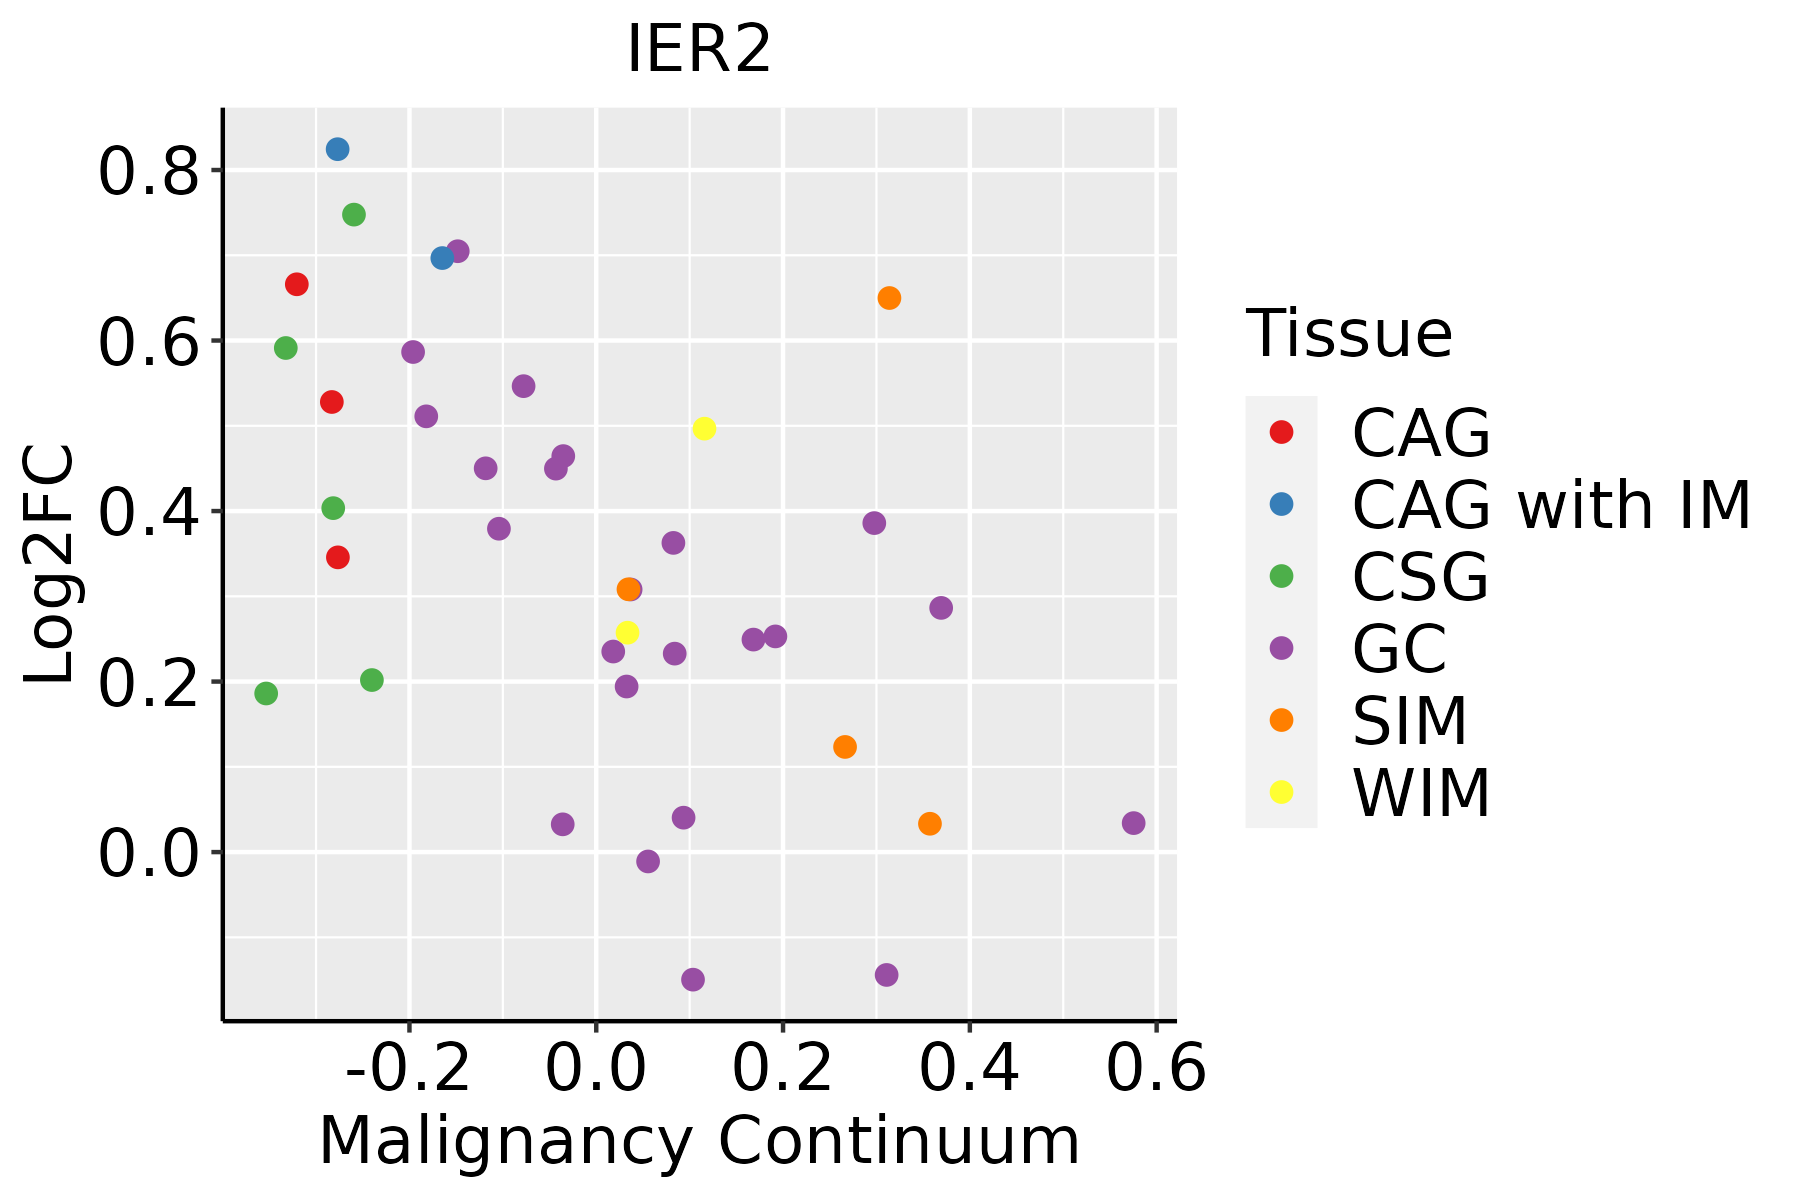 | CAG: Chronic atrophic gastritis |
| CAG with IM: Chronic atrophic gastritis with intestinal metaplasia | ||
| CSG: Chronic superficial gastritis | ||
| GC: Gastric cancer | ||
| SIM: Severe intestinal metaplasia | ||
| WIM: Wild intestinal metaplasia | ||
| Liver |  | HCC: Hepatocellular carcinoma |
| NAFLD: Non-alcoholic fatty liver disease | ||
| Lung |  | AAH: Atypical adenomatous hyperplasia |
| AIS: Adenocarcinoma in situ | ||
| IAC: Invasive lung adenocarcinoma | ||
| MIA: Minimally invasive adenocarcinoma | ||
| Oral Cavity |  | EOLP: Erosive Oral lichen planus |
| LP: leukoplakia | ||
| NEOLP: Non-erosive oral lichen planus | ||
| OSCC: Oral squamous cell carcinoma | ||
| Prostate | 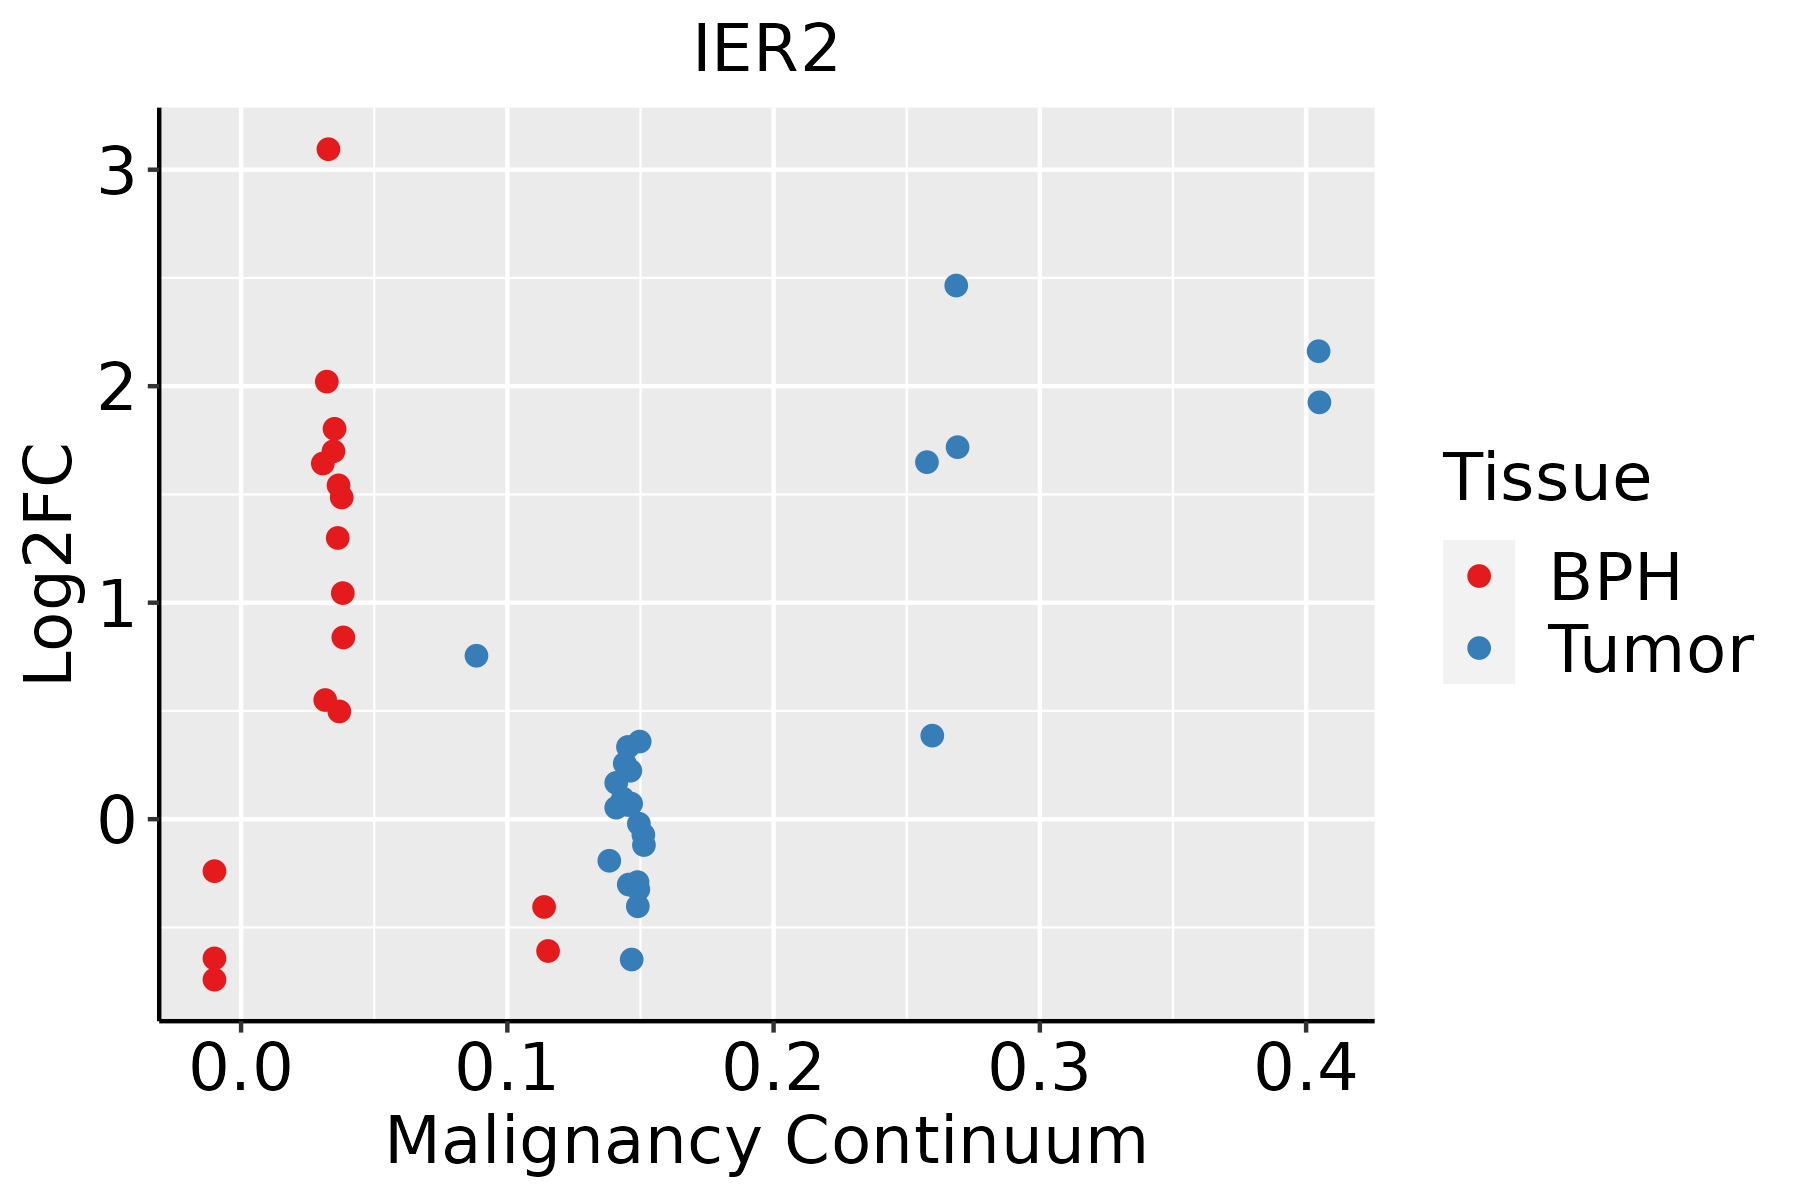 | BPH: Benign Prostatic Hyperplasia |
| Skin | 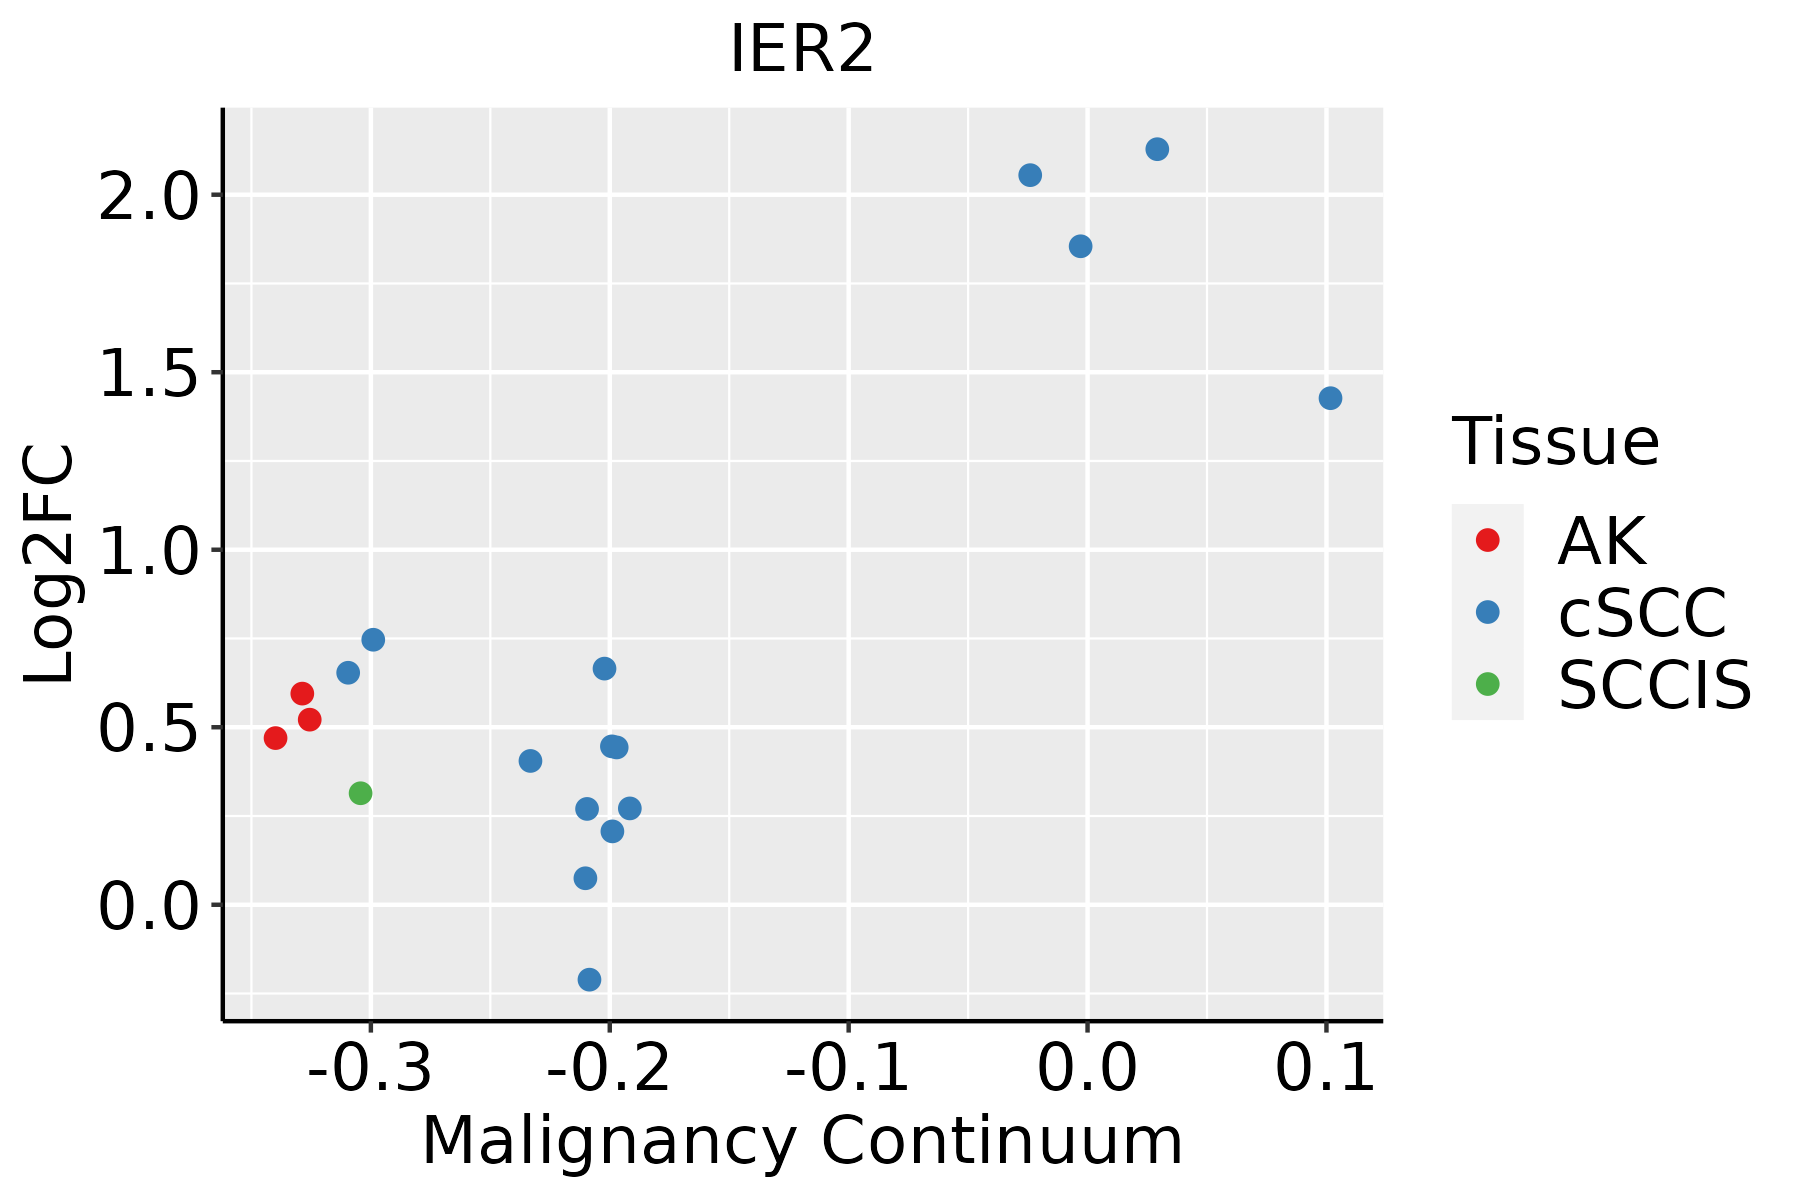 | AK: Actinic keratosis |
| cSCC: Cutaneous squamous cell carcinoma | ||
| SCCIS:squamous cell carcinoma in situ | ||
| Thyroid | 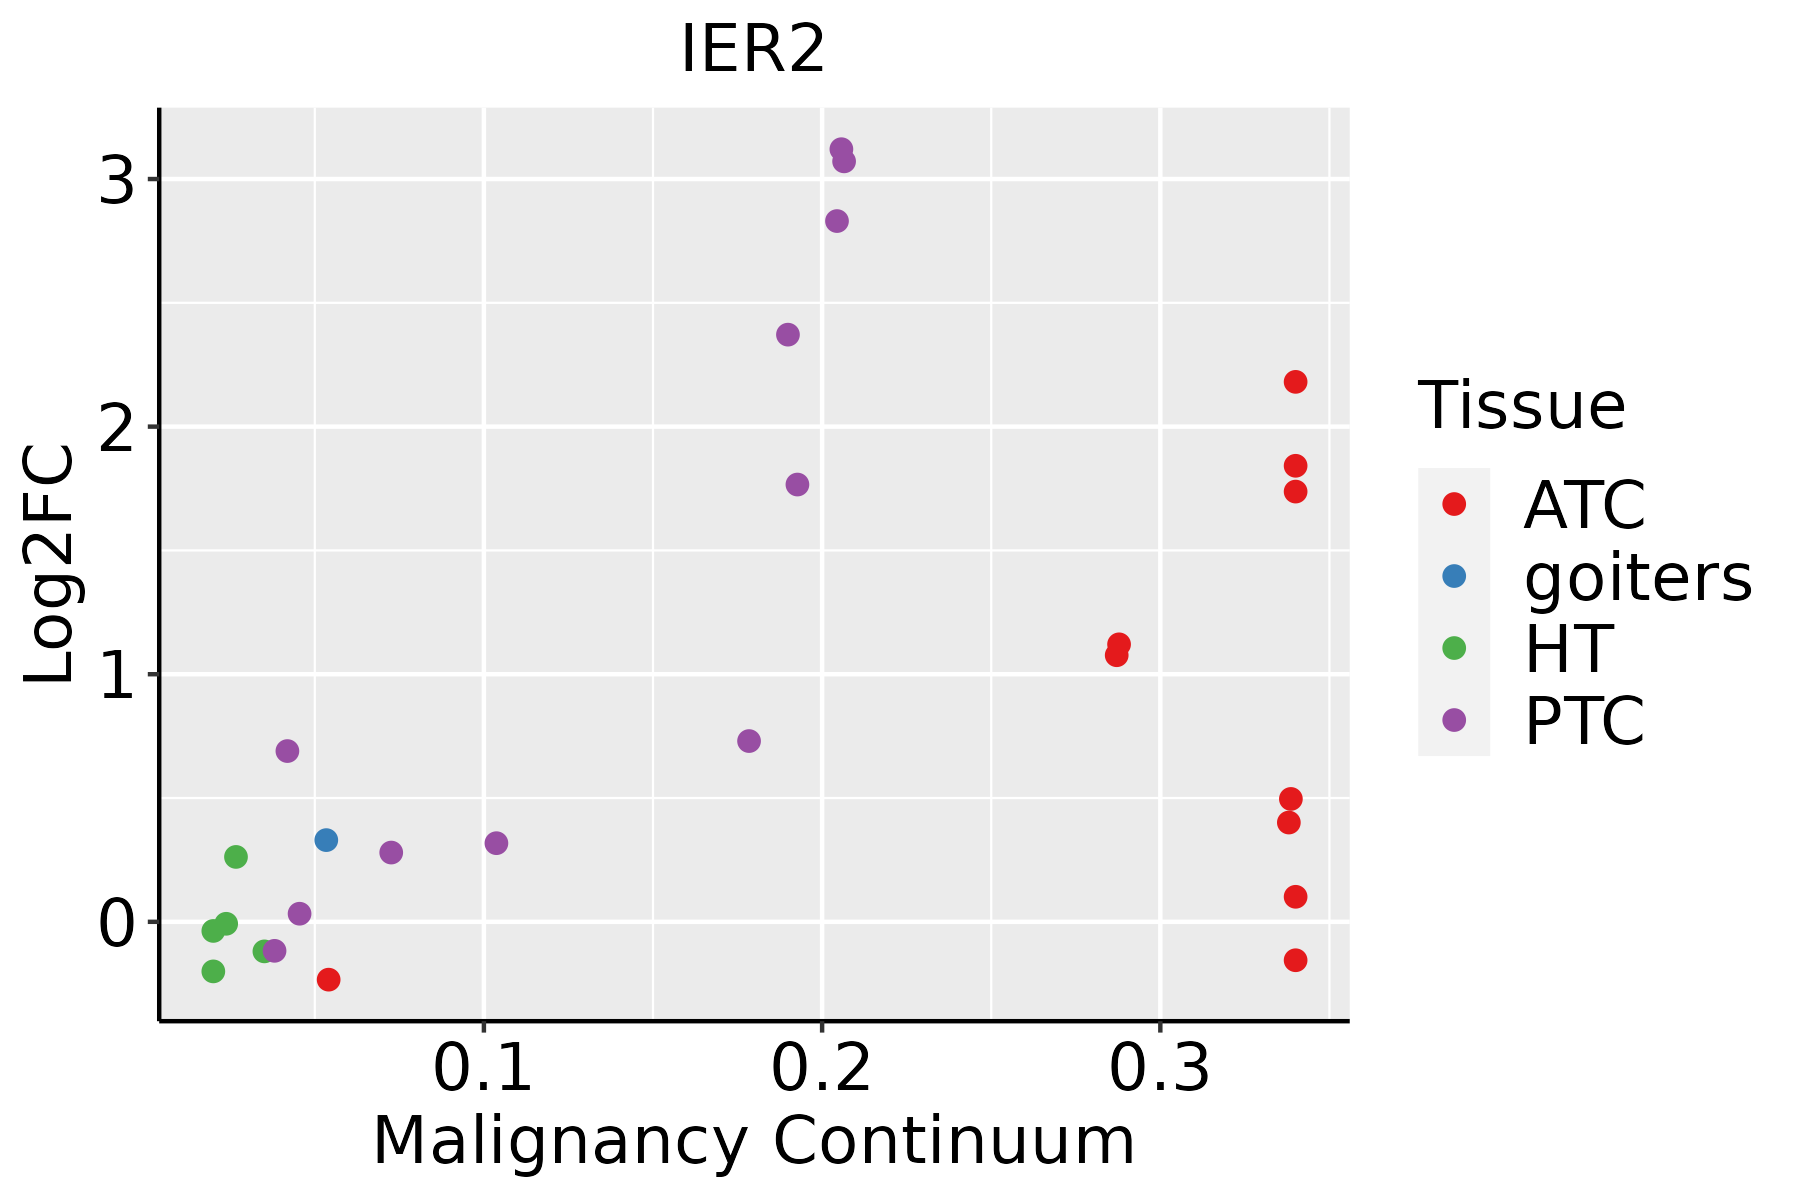 | ATC: Anaplastic thyroid cancer |
| HT: Hashimoto's thyroiditis | ||
| PTC: Papillary thyroid cancer |
| ∗log2FC in expression of this searched gene in stem-like cells from each diseased tissue sample relative to stem-like cells in normal samples in each tissue plotted against the malignancy continuum. Samples are colored based on if they are from different disease stage. |
Top |
Malignant transformation related pathway analysis |
| Find out the enriched GO biological processes and KEGG pathways involved in transition from healthy to precancer to cancer |
| Tissue | Disease Stage | Enriched GO biological Processes |
| Colorectum | AD |  |
| Colorectum | SER |  |
| Colorectum | MSS |  |
| Colorectum | MSI-H |  |
| Colorectum | FAP |  |
| ∗Top 15 enriched GO BP terms are showed in the bar plot of each disease state in each tissue. Each row represents a significant GO biological process which is colored according to the -log10(p.adjust). |
| Page: 1 2 3 4 5 6 7 8 9 |
| GO ID | Tissue | Disease Stage | Description | Gene Ratio | Bg Ratio | pvalue | p.adjust | Count |
| GO:0071774 | Breast | Precancer | response to fibroblast growth factor | 15/1080 | 120/18723 | 3.80e-03 | 3.05e-02 | 15 |
| GO:001657015 | Esophagus | ESCC | histone modification | 323/8552 | 463/18723 | 2.61e-26 | 7.88e-24 | 323 |
| GO:00356015 | Esophagus | ESCC | protein deacylation | 79/8552 | 112/18723 | 8.30e-08 | 1.42e-06 | 79 |
| GO:00987325 | Esophagus | ESCC | macromolecule deacylation | 80/8552 | 116/18723 | 3.19e-07 | 4.50e-06 | 80 |
| GO:00165754 | Esophagus | ESCC | histone deacetylation | 60/8552 | 82/18723 | 3.85e-07 | 5.32e-06 | 60 |
| GO:00064765 | Esophagus | ESCC | protein deacetylation | 70/8552 | 101/18723 | 1.29e-06 | 1.58e-05 | 70 |
| GO:00165707 | Oral cavity | OSCC | histone modification | 270/7305 | 463/18723 | 1.59e-17 | 1.50e-15 | 270 |
| GO:00356014 | Oral cavity | OSCC | protein deacylation | 74/7305 | 112/18723 | 5.88e-09 | 1.26e-07 | 74 |
| GO:00987324 | Oral cavity | OSCC | macromolecule deacylation | 74/7305 | 116/18723 | 5.52e-08 | 1.01e-06 | 74 |
| GO:00064764 | Oral cavity | OSCC | protein deacetylation | 66/7305 | 101/18723 | 7.36e-08 | 1.30e-06 | 66 |
| GO:00165753 | Oral cavity | OSCC | histone deacetylation | 54/7305 | 82/18723 | 7.68e-07 | 1.08e-05 | 54 |
| GO:003560113 | Oral cavity | LP | protein deacylation | 48/4623 | 112/18723 | 1.85e-05 | 3.14e-04 | 48 |
| GO:001657014 | Oral cavity | LP | histone modification | 152/4623 | 463/18723 | 4.04e-05 | 5.90e-04 | 152 |
| GO:001657511 | Oral cavity | LP | histone deacetylation | 37/4623 | 82/18723 | 4.28e-05 | 6.15e-04 | 37 |
| GO:009873212 | Oral cavity | LP | macromolecule deacylation | 48/4623 | 116/18723 | 5.51e-05 | 7.58e-04 | 48 |
| GO:000647613 | Oral cavity | LP | protein deacetylation | 41/4623 | 101/18723 | 3.03e-04 | 3.12e-03 | 41 |
| GO:00717742 | Prostate | BPH | response to fibroblast growth factor | 31/3107 | 120/18723 | 6.55e-03 | 2.94e-02 | 31 |
| GO:00717741 | Prostate | Tumor | response to fibroblast growth factor | 31/3246 | 120/18723 | 1.22e-02 | 4.97e-02 | 31 |
| GO:00717743 | Skin | AK | response to fibroblast growth factor | 28/1910 | 120/18723 | 2.23e-05 | 4.08e-04 | 28 |
| Page: 1 |
| Pathway ID | Tissue | Disease Stage | Description | Gene Ratio | Bg Ratio | pvalue | p.adjust | qvalue | Count |
| Page: 1 |
Top |
Cell-cell communication analysis |
| Identification of potential cell-cell interactions between two cell types and their ligand-receptor pairs for different disease states |
| Ligand | Receptor | LRpair | Pathway | Tissue | Disease Stage |
| Page: 1 |
Top |
Single-cell gene regulatory network inference analysis |
| Find out the significant the regulons (TFs) and the target genes of each regulon across cell types for different disease states |
| TF | Cell Type | Tissue | Disease Stage | Target Gene | RSS | Regulon Activity |
| ∗The dot plots of a searched regulon are shown for all cell subpopulations in each disease state of each tissue based on the regulon specific score inferred using pySCENIC and by calculating the average expression. |
| Page: 1 |
Top |
Somatic mutation of malignant transformation related genes |
| Annotation of somatic variants for genes involved in malignant transformation |
| Hugo Symbol | Variant Class | Variant Classification | dbSNP RS | HGVSc | HGVSp | HGVSp Short | SWISSPROT | BIOTYPE | SIFT | PolyPhen | Tumor Sample Barcode | Tissue | Histology | Sex | Age | Stage | Therapy Types | Drugs | Outcome |
| IER2 | SNV | Missense_Mutation | c.146C>T | p.Ser49Leu | p.S49L | Q9BTL4 | protein_coding | deleterious(0) | probably_damaging(0.986) | TCGA-C8-A12Z-01 | Breast | breast invasive carcinoma | Female | <65 | I/II | Chemotherapy | 5-fluorouracil | CR | |
| IER2 | SNV | Missense_Mutation | c.244G>C | p.Glu82Gln | p.E82Q | Q9BTL4 | protein_coding | tolerated(0.34) | benign(0.057) | TCGA-EK-A3GJ-01 | Cervix | cervical & endocervical cancer | Female | <65 | I/II | Unknown | Unknown | SD | |
| IER2 | SNV | Missense_Mutation | novel | c.246N>T | p.Glu82Asp | p.E82D | Q9BTL4 | protein_coding | tolerated(0.58) | benign(0.012) | TCGA-AZ-4315-01 | Colorectum | colon adenocarcinoma | Male | <65 | I/II | Unknown | Unknown | SD |
| IER2 | SNV | Missense_Mutation | novel | c.371N>T | p.Ser124Ile | p.S124I | Q9BTL4 | protein_coding | deleterious(0) | possibly_damaging(0.787) | TCGA-AP-A1E0-01 | Endometrium | uterine corpus endometrioid carcinoma | Female | <65 | III/IV | Chemotherapy | paclitaxel | SD |
| IER2 | SNV | Missense_Mutation | novel | c.504G>T | p.Glu168Asp | p.E168D | Q9BTL4 | protein_coding | tolerated(0.13) | probably_damaging(0.931) | TCGA-B5-A3FC-01 | Endometrium | uterine corpus endometrioid carcinoma | Female | <65 | I/II | Unknown | Unknown | SD |
| IER2 | SNV | Missense_Mutation | novel | c.125N>T | p.Ser42Ile | p.S42I | Q9BTL4 | protein_coding | deleterious(0) | probably_damaging(0.99) | TCGA-EO-A22R-01 | Endometrium | uterine corpus endometrioid carcinoma | Female | <65 | I/II | Unknown | Unknown | SD |
| IER2 | SNV | Missense_Mutation | novel | c.91N>T | p.His31Tyr | p.H31Y | Q9BTL4 | protein_coding | deleterious(0) | probably_damaging(0.999) | TCGA-EO-A22X-01 | Endometrium | uterine corpus endometrioid carcinoma | Female | <65 | III/IV | Unspecific | Carboplatin | Complete Response |
| IER2 | SNV | Missense_Mutation | c.628N>T | p.Asp210Tyr | p.D210Y | Q9BTL4 | protein_coding | deleterious(0) | probably_damaging(0.929) | TCGA-CC-A7IG-01 | Liver | liver hepatocellular carcinoma | Male | <65 | I/II | Unknown | Unknown | PD | |
| IER2 | SNV | Missense_Mutation | rs771644993 | c.541N>T | p.Arg181Cys | p.R181C | Q9BTL4 | protein_coding | deleterious(0.01) | possibly_damaging(0.871) | TCGA-44-A47A-01 | Lung | lung adenocarcinoma | Female | >=65 | I/II | Unknown | Unknown | PD |
| IER2 | SNV | Missense_Mutation | c.469G>T | p.Ala157Ser | p.A157S | Q9BTL4 | protein_coding | tolerated(0.73) | benign(0.006) | TCGA-69-7979-01 | Lung | lung adenocarcinoma | Female | >=65 | I/II | Unknown | Unknown | SD |
| Page: 1 2 |
Top |
Related drugs of malignant transformation related genes |
| Identification of chemicals and drugs interact with genes involved in malignant transfromation |
| (DGIdb 4.0) |
| Entrez ID | Symbol | Category | Interaction Types | Drug Claim Name | Drug Name | PMIDs |
| Page: 1 |

Copyright 2023-Present -The University of Texas Health Science Center at Houston |