
|
|||||
|
 | |
| |
| |
| |
| |
| |
|
Gene: IDS |
Gene summary for IDS |
| Gene information | Species | Human | Gene symbol | IDS | Gene ID | 3423 |
| Gene name | iduronate 2-sulfatase | |
| Gene Alias | ID2S | |
| Cytomap | Xq28 | |
| Gene Type | protein-coding | GO ID | GO:0006022 | UniProtAcc | P22304 |
Top |
Malignant transformation analysis |
| Identification of the aberrant gene expression in precancerous and cancerous lesions by comparing the gene expression of stem-like cells in diseased tissues with normal stem cells |
| Entrez ID | Symbol | Replicates | Species | Organ | Tissue | Adj P-value | Log2FC | Malignancy |
| 3423 | IDS | LZE4T | Human | Esophagus | ESCC | 1.25e-27 | 7.24e-01 | 0.0811 |
| 3423 | IDS | LZE5T | Human | Esophagus | ESCC | 3.41e-03 | 6.68e-01 | 0.0514 |
| 3423 | IDS | LZE7T | Human | Esophagus | ESCC | 9.73e-09 | 7.89e-01 | 0.0667 |
| 3423 | IDS | LZE8T | Human | Esophagus | ESCC | 1.28e-07 | 3.56e-01 | 0.067 |
| 3423 | IDS | LZE20T | Human | Esophagus | ESCC | 1.02e-08 | 5.12e-01 | 0.0662 |
| 3423 | IDS | LZE22T | Human | Esophagus | ESCC | 1.27e-03 | 5.88e-01 | 0.068 |
| 3423 | IDS | LZE24D1 | Human | Esophagus | HGIN | 1.56e-02 | 1.03e+00 | 0.054 |
| 3423 | IDS | LZE24T | Human | Esophagus | ESCC | 6.40e-44 | 1.60e+00 | 0.0596 |
| 3423 | IDS | LZE21T | Human | Esophagus | ESCC | 4.43e-02 | 3.40e-01 | 0.0655 |
| 3423 | IDS | LZE6T | Human | Esophagus | ESCC | 9.50e-05 | 3.73e-01 | 0.0845 |
| 3423 | IDS | P1T-E | Human | Esophagus | ESCC | 8.10e-08 | 7.75e-01 | 0.0875 |
| 3423 | IDS | P2T-E | Human | Esophagus | ESCC | 2.91e-11 | 3.38e-01 | 0.1177 |
| 3423 | IDS | P4T-E | Human | Esophagus | ESCC | 9.22e-23 | 5.31e-01 | 0.1323 |
| 3423 | IDS | P5T-E | Human | Esophagus | ESCC | 1.76e-23 | 6.19e-01 | 0.1327 |
| 3423 | IDS | P8T-E | Human | Esophagus | ESCC | 7.76e-44 | 1.00e+00 | 0.0889 |
| 3423 | IDS | P9T-E | Human | Esophagus | ESCC | 1.70e-18 | 6.48e-01 | 0.1131 |
| 3423 | IDS | P10T-E | Human | Esophagus | ESCC | 2.52e-53 | 1.27e+00 | 0.116 |
| 3423 | IDS | P11T-E | Human | Esophagus | ESCC | 1.64e-22 | 8.73e-01 | 0.1426 |
| 3423 | IDS | P12T-E | Human | Esophagus | ESCC | 5.96e-37 | 7.58e-01 | 0.1122 |
| 3423 | IDS | P15T-E | Human | Esophagus | ESCC | 8.16e-23 | 5.56e-01 | 0.1149 |
| Page: 1 2 3 4 5 6 |
| Tissue | Expression Dynamics | Abbreviation |
| Esophagus |  | ESCC: Esophageal squamous cell carcinoma |
| HGIN: High-grade intraepithelial neoplasias | ||
| LGIN: Low-grade intraepithelial neoplasias | ||
| Liver | 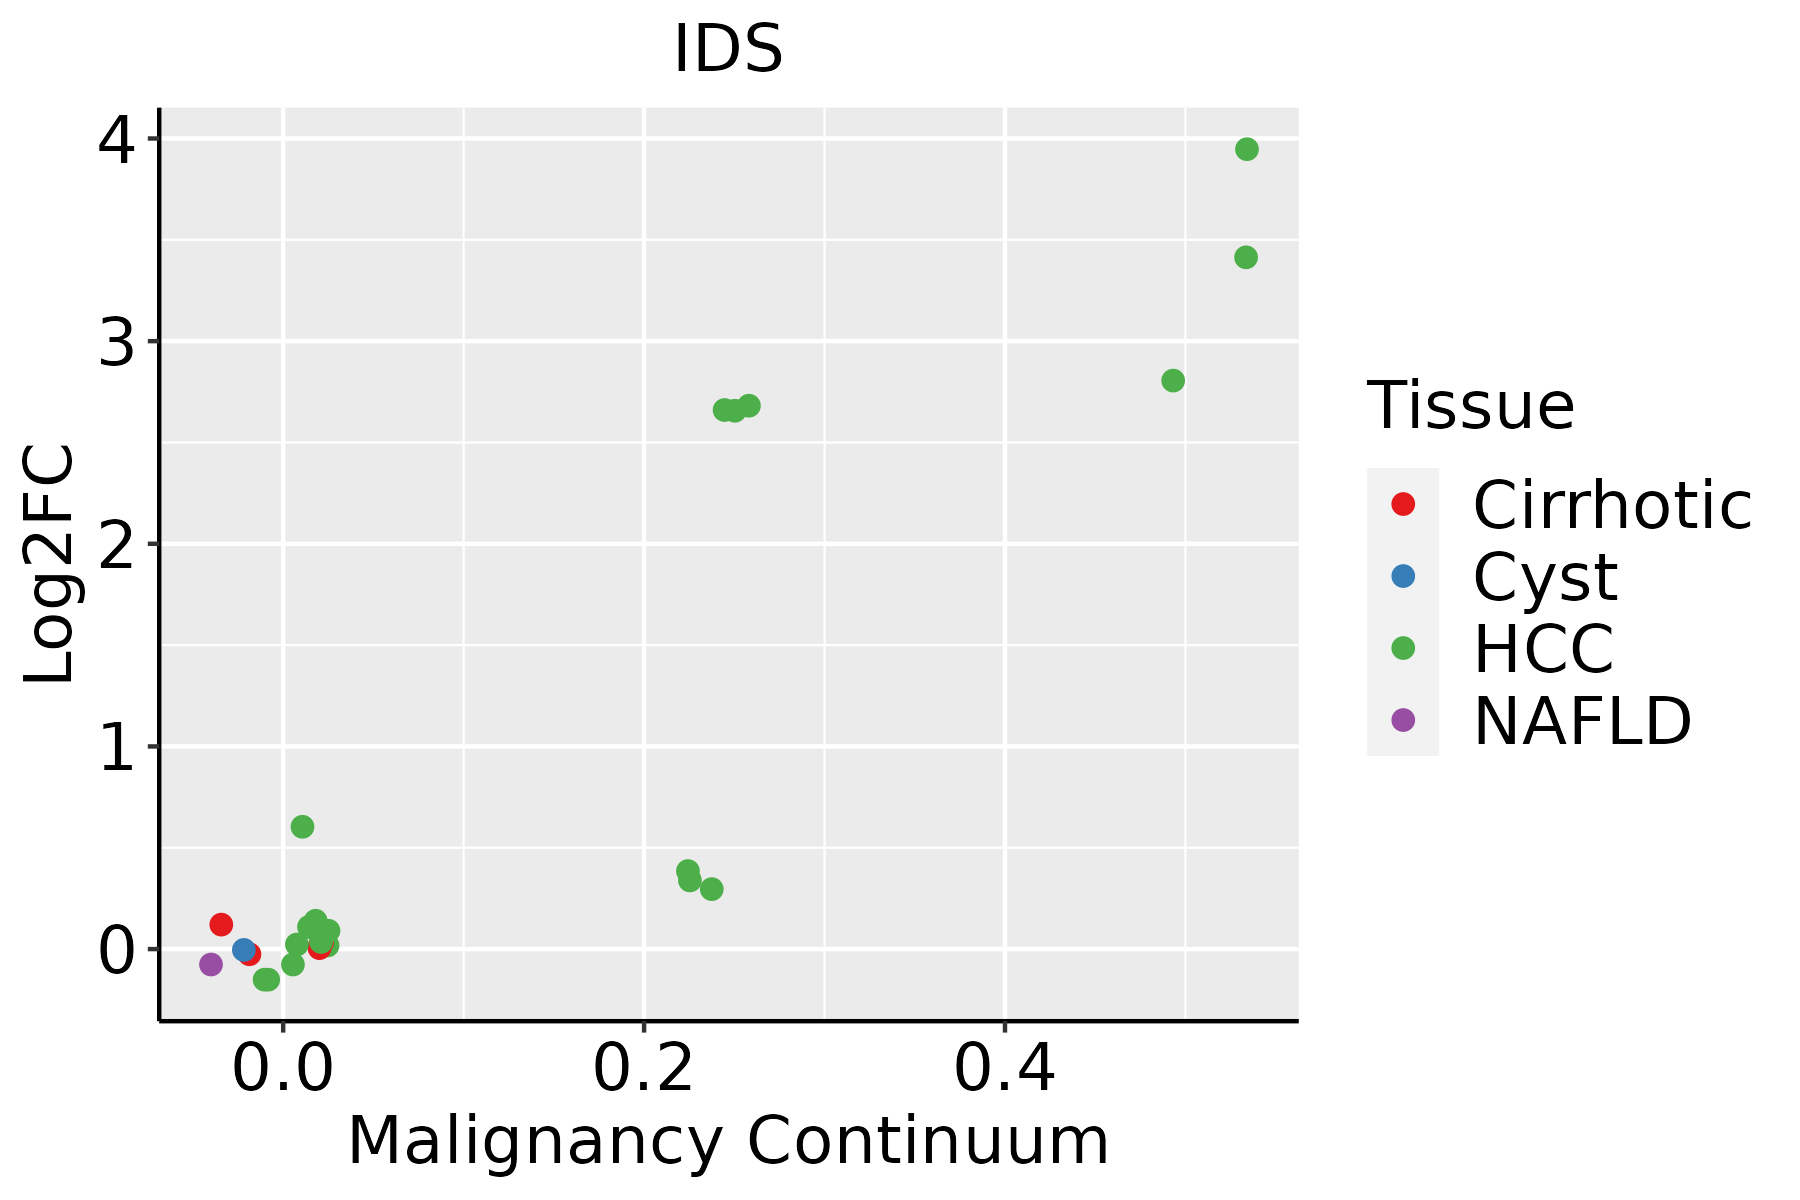 | HCC: Hepatocellular carcinoma |
| NAFLD: Non-alcoholic fatty liver disease | ||
| Oral Cavity | 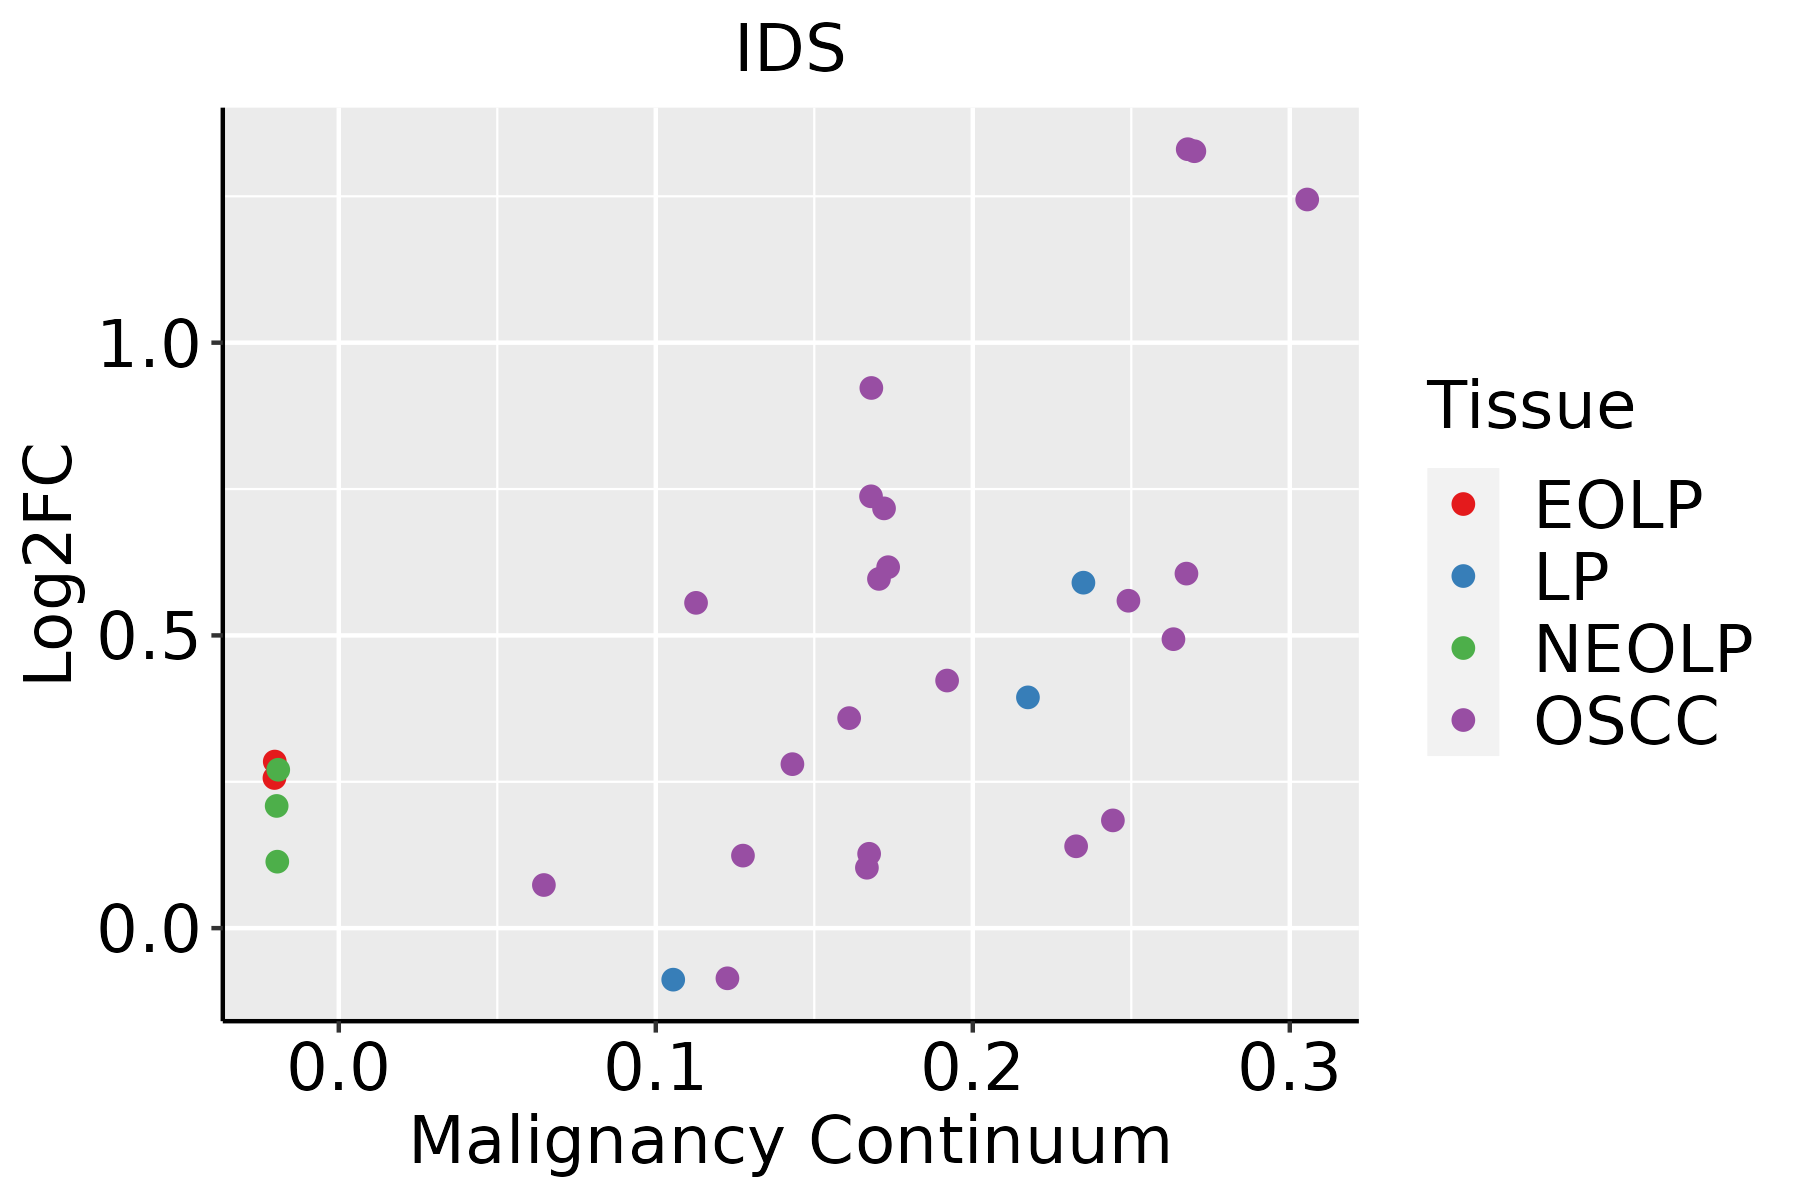 | EOLP: Erosive Oral lichen planus |
| LP: leukoplakia | ||
| NEOLP: Non-erosive oral lichen planus | ||
| OSCC: Oral squamous cell carcinoma | ||
| Thyroid | 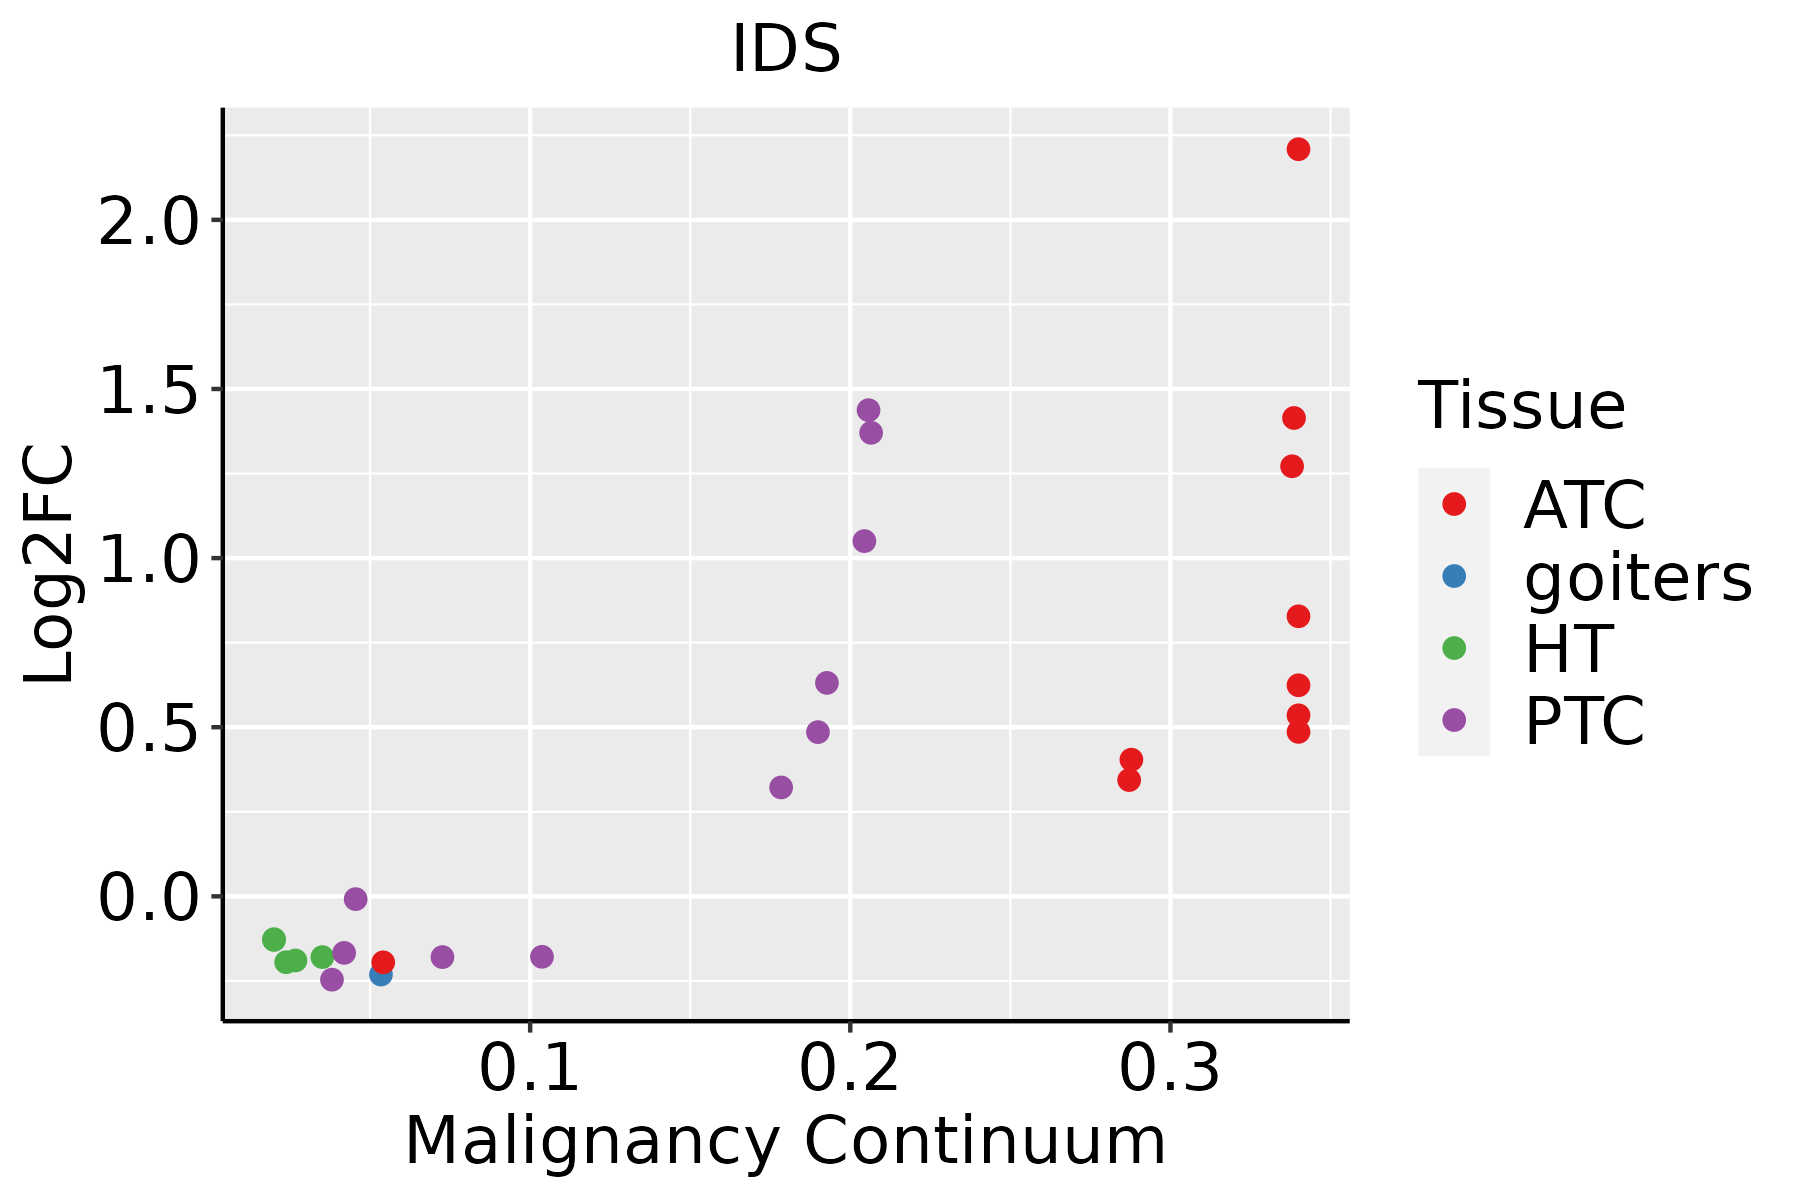 | ATC: Anaplastic thyroid cancer |
| HT: Hashimoto's thyroiditis | ||
| PTC: Papillary thyroid cancer |
| ∗log2FC in expression of this searched gene in stem-like cells from each diseased tissue sample relative to stem-like cells in normal samples in each tissue plotted against the malignancy continuum. Samples are colored based on if they are from different disease stage. |
Top |
Malignant transformation related pathway analysis |
| Find out the enriched GO biological processes and KEGG pathways involved in transition from healthy to precancer to cancer |
| Tissue | Disease Stage | Enriched GO biological Processes |
| Colorectum | AD |  |
| Colorectum | SER |  |
| Colorectum | MSS |  |
| Colorectum | MSI-H |  |
| Colorectum | FAP |  |
| ∗Top 15 enriched GO BP terms are showed in the bar plot of each disease state in each tissue. Each row represents a significant GO biological process which is colored according to the -log10(p.adjust). |
| Page: 1 2 3 4 5 6 7 8 9 |
| GO ID | Tissue | Disease Stage | Description | Gene Ratio | Bg Ratio | pvalue | p.adjust | Count |
| GO:19011362 | Esophagus | ESCC | carbohydrate derivative catabolic process | 99/8552 | 172/18723 | 1.11e-03 | 5.54e-03 | 99 |
| GO:1901136 | Liver | HCC | carbohydrate derivative catabolic process | 98/7958 | 172/18723 | 8.71e-05 | 7.62e-04 | 98 |
| GO:19011361 | Oral cavity | OSCC | carbohydrate derivative catabolic process | 89/7305 | 172/18723 | 4.52e-04 | 2.73e-03 | 89 |
| GO:19011363 | Thyroid | ATC | carbohydrate derivative catabolic process | 73/6293 | 172/18723 | 9.43e-03 | 3.47e-02 | 73 |
| Page: 1 |
| Pathway ID | Tissue | Disease Stage | Description | Gene Ratio | Bg Ratio | pvalue | p.adjust | qvalue | Count |
| hsa0414222 | Esophagus | ESCC | Lysosome | 102/4205 | 132/8465 | 5.11e-11 | 7.13e-10 | 3.65e-10 | 102 |
| hsa0414232 | Esophagus | ESCC | Lysosome | 102/4205 | 132/8465 | 5.11e-11 | 7.13e-10 | 3.65e-10 | 102 |
| hsa041422 | Liver | HCC | Lysosome | 100/4020 | 132/8465 | 2.32e-11 | 4.31e-10 | 2.40e-10 | 100 |
| hsa041423 | Liver | HCC | Lysosome | 100/4020 | 132/8465 | 2.32e-11 | 4.31e-10 | 2.40e-10 | 100 |
| hsa041425 | Oral cavity | OSCC | Lysosome | 87/3704 | 132/8465 | 1.97e-07 | 1.35e-06 | 6.86e-07 | 87 |
| hsa0414212 | Oral cavity | OSCC | Lysosome | 87/3704 | 132/8465 | 1.97e-07 | 1.35e-06 | 6.86e-07 | 87 |
| Page: 1 |
Top |
Cell-cell communication analysis |
| Identification of potential cell-cell interactions between two cell types and their ligand-receptor pairs for different disease states |
| Ligand | Receptor | LRpair | Pathway | Tissue | Disease Stage |
| Page: 1 |
Top |
Single-cell gene regulatory network inference analysis |
| Find out the significant the regulons (TFs) and the target genes of each regulon across cell types for different disease states |
| TF | Cell Type | Tissue | Disease Stage | Target Gene | RSS | Regulon Activity |
| ∗The dot plots of a searched regulon are shown for all cell subpopulations in each disease state of each tissue based on the regulon specific score inferred using pySCENIC and by calculating the average expression. |
| Page: 1 |
Top |
Somatic mutation of malignant transformation related genes |
| Annotation of somatic variants for genes involved in malignant transformation |
| Hugo Symbol | Variant Class | Variant Classification | dbSNP RS | HGVSc | HGVSp | HGVSp Short | SWISSPROT | BIOTYPE | SIFT | PolyPhen | Tumor Sample Barcode | Tissue | Histology | Sex | Age | Stage | Therapy Types | Drugs | Outcome |
| IDS | SNV | Missense_Mutation | c.23G>A | p.Arg8Gln | p.R8Q | P22304 | protein_coding | tolerated_low_confidence(0.43) | benign(0) | TCGA-A1-A0SK-01 | Breast | breast invasive carcinoma | Female | <65 | I/II | Unknown | Unknown | PD | |
| IDS | SNV | Missense_Mutation | c.1174N>A | p.Glu392Lys | p.E392K | P22304 | protein_coding | tolerated(0.62) | benign(0.003) | TCGA-A1-A0SO-01 | Breast | breast invasive carcinoma | Female | >=65 | I/II | Chemotherapy | SD | ||
| IDS | SNV | Missense_Mutation | c.1142N>G | p.Leu381Arg | p.L381R | P22304 | protein_coding | tolerated(0.26) | benign(0.023) | TCGA-A8-A09W-01 | Breast | breast invasive carcinoma | Female | >=65 | III/IV | Unknown | Unknown | SD | |
| IDS | SNV | Missense_Mutation | novel | c.332N>G | p.Val111Gly | p.V111G | P22304 | protein_coding | tolerated(0.36) | benign(0.326) | TCGA-AO-A1KP-01 | Breast | breast invasive carcinoma | Female | >=65 | I/II | Chemotherapy | fluorouracil | SD |
| IDS | SNV | Missense_Mutation | c.551N>A | p.Cys184Tyr | p.C184Y | P22304 | protein_coding | deleterious(0.02) | probably_damaging(0.994) | TCGA-BH-A0HA-01 | Breast | breast invasive carcinoma | Female | <65 | I/II | Unknown | Unknown | SD | |
| IDS | SNV | Missense_Mutation | novel | c.1605G>A | p.Met535Ile | p.M535I | P22304 | protein_coding | tolerated(0.32) | benign(0) | TCGA-BH-A1FD-01 | Breast | breast invasive carcinoma | Female | >=65 | I/II | Unknown | Unknown | PD |
| IDS | insertion | Nonsense_Mutation | novel | c.829_830insCTTCTCTTACCACATGAATGCTGTGGCAGGCA | p.Gln277ProfsTer6 | p.Q277Pfs*6 | P22304 | protein_coding | TCGA-A2-A04Y-01 | Breast | breast invasive carcinoma | Female | <65 | I/II | Chemotherapy | cytoxan | SD | ||
| IDS | insertion | Nonsense_Mutation | novel | c.545_546insTTCACTGTAATAAGTCATAGCTGTGAGTG | p.Leu183SerfsTer3 | p.L183Sfs*3 | P22304 | protein_coding | TCGA-A8-A09W-01 | Breast | breast invasive carcinoma | Female | >=65 | III/IV | Unknown | Unknown | SD | ||
| IDS | insertion | Frame_Shift_Ins | novel | c.27_28insAAGAACCAAAGAGAGCATGTAGAAGTAT | p.Leu10LysfsTer46 | p.L10Kfs*46 | P22304 | protein_coding | TCGA-AQ-A04J-01 | Breast | breast invasive carcinoma | Female | <65 | I/II | Chemotherapy | cytoxan | SD | ||
| IDS | insertion | Frame_Shift_Ins | novel | c.164_165insTCTCTTTC | p.Asp56LeufsTer7 | p.D56Lfs*7 | P22304 | protein_coding | TCGA-AR-A0TY-01 | Breast | breast invasive carcinoma | Female | <65 | I/II | Unspecific | Paclitaxel | PD |
| Page: 1 2 3 4 5 6 7 8 9 |
Top |
Related drugs of malignant transformation related genes |
| Identification of chemicals and drugs interact with genes involved in malignant transfromation |
| (DGIdb 4.0) |
| Entrez ID | Symbol | Category | Interaction Types | Drug Claim Name | Drug Name | PMIDs |
| 3423 | IDS | ENZYME, DRUGGABLE GENOME | Recombinant human iduronate-2-sulfatase | |||
| 3423 | IDS | ENZYME, DRUGGABLE GENOME | Idursulfase | IDURSULFASE | ||
| 3423 | IDS | ENZYME, DRUGGABLE GENOME | IDURONATE-2 SULFATASE |
| Page: 1 |

Copyright 2023-Present -The University of Texas Health Science Center at Houston |