
|
|||||
|
 | |
| |
| |
| |
| |
| |
|
Gene: IDO1 |
Gene summary for IDO1 |
| Gene information | Species | Human | Gene symbol | IDO1 | Gene ID | 3620 |
| Gene name | indoleamine 2,3-dioxygenase 1 | |
| Gene Alias | IDO | |
| Cytomap | 8p11.21 | |
| Gene Type | protein-coding | GO ID | GO:0000003 | UniProtAcc | P14902 |
Top |
Malignant transformation analysis |
| Identification of the aberrant gene expression in precancerous and cancerous lesions by comparing the gene expression of stem-like cells in diseased tissues with normal stem cells |
| Entrez ID | Symbol | Replicates | Species | Organ | Tissue | Adj P-value | Log2FC | Malignancy |
| 3620 | IDO1 | CA_HPV_1 | Human | Cervix | CC | 2.68e-03 | 3.61e-01 | 0.0264 |
| 3620 | IDO1 | CCI_2 | Human | Cervix | CC | 1.06e-05 | 9.71e-01 | 0.5249 |
| 3620 | IDO1 | Tumor | Human | Cervix | CC | 9.18e-52 | 1.03e+00 | 0.1241 |
| 3620 | IDO1 | sample1 | Human | Cervix | CC | 1.63e-18 | 8.09e-01 | 0.0959 |
| 3620 | IDO1 | sample3 | Human | Cervix | CC | 9.31e-66 | 1.19e+00 | 0.1387 |
| 3620 | IDO1 | H2 | Human | Cervix | HSIL_HPV | 2.09e-04 | 3.24e-01 | 0.0632 |
| 3620 | IDO1 | T1 | Human | Cervix | CC | 9.98e-36 | 8.32e-01 | 0.0918 |
| 3620 | IDO1 | T3 | Human | Cervix | CC | 6.61e-70 | 1.22e+00 | 0.1389 |
| 3620 | IDO1 | AEH-subject1 | Human | Endometrium | AEH | 3.96e-15 | 5.20e-01 | -0.3059 |
| 3620 | IDO1 | AEH-subject2 | Human | Endometrium | AEH | 6.15e-24 | 7.50e-01 | -0.2525 |
| 3620 | IDO1 | AEH-subject5 | Human | Endometrium | AEH | 2.08e-09 | 3.77e-01 | -0.2953 |
| 3620 | IDO1 | EEC-subject2 | Human | Endometrium | EEC | 3.69e-04 | 3.36e-01 | -0.2607 |
| 3620 | IDO1 | EEC-subject4 | Human | Endometrium | EEC | 1.36e-18 | 5.66e-01 | -0.2571 |
| 3620 | IDO1 | GSM5276935 | Human | Endometrium | EEC | 9.22e-30 | 6.45e-01 | -0.123 |
| 3620 | IDO1 | GSM6177620_NYU_UCEC1_lib1_lib1 | Human | Endometrium | EEC | 7.96e-05 | 3.84e-01 | -0.1869 |
| 3620 | IDO1 | GSM6177620_NYU_UCEC1_lib2_lib2 | Human | Endometrium | EEC | 3.88e-11 | 6.35e-01 | -0.1875 |
| 3620 | IDO1 | GSM6177620_NYU_UCEC1_lib3_lib3 | Human | Endometrium | EEC | 1.07e-10 | 6.05e-01 | -0.1883 |
| 3620 | IDO1 | GSM6177622_NYU_UCEC3_lib1_lib1 | Human | Endometrium | EEC | 1.53e-02 | 2.52e-01 | -0.1917 |
| 3620 | IDO1 | GSM6177623_NYU_UCEC3_Vis | Human | Endometrium | EEC | 1.21e-07 | 4.26e-01 | -0.1269 |
| 3620 | IDO1 | LZE8T | Human | Esophagus | ESCC | 2.51e-20 | 7.40e-01 | 0.067 |
| Page: 1 2 3 |
| Tissue | Expression Dynamics | Abbreviation |
| Cervix | 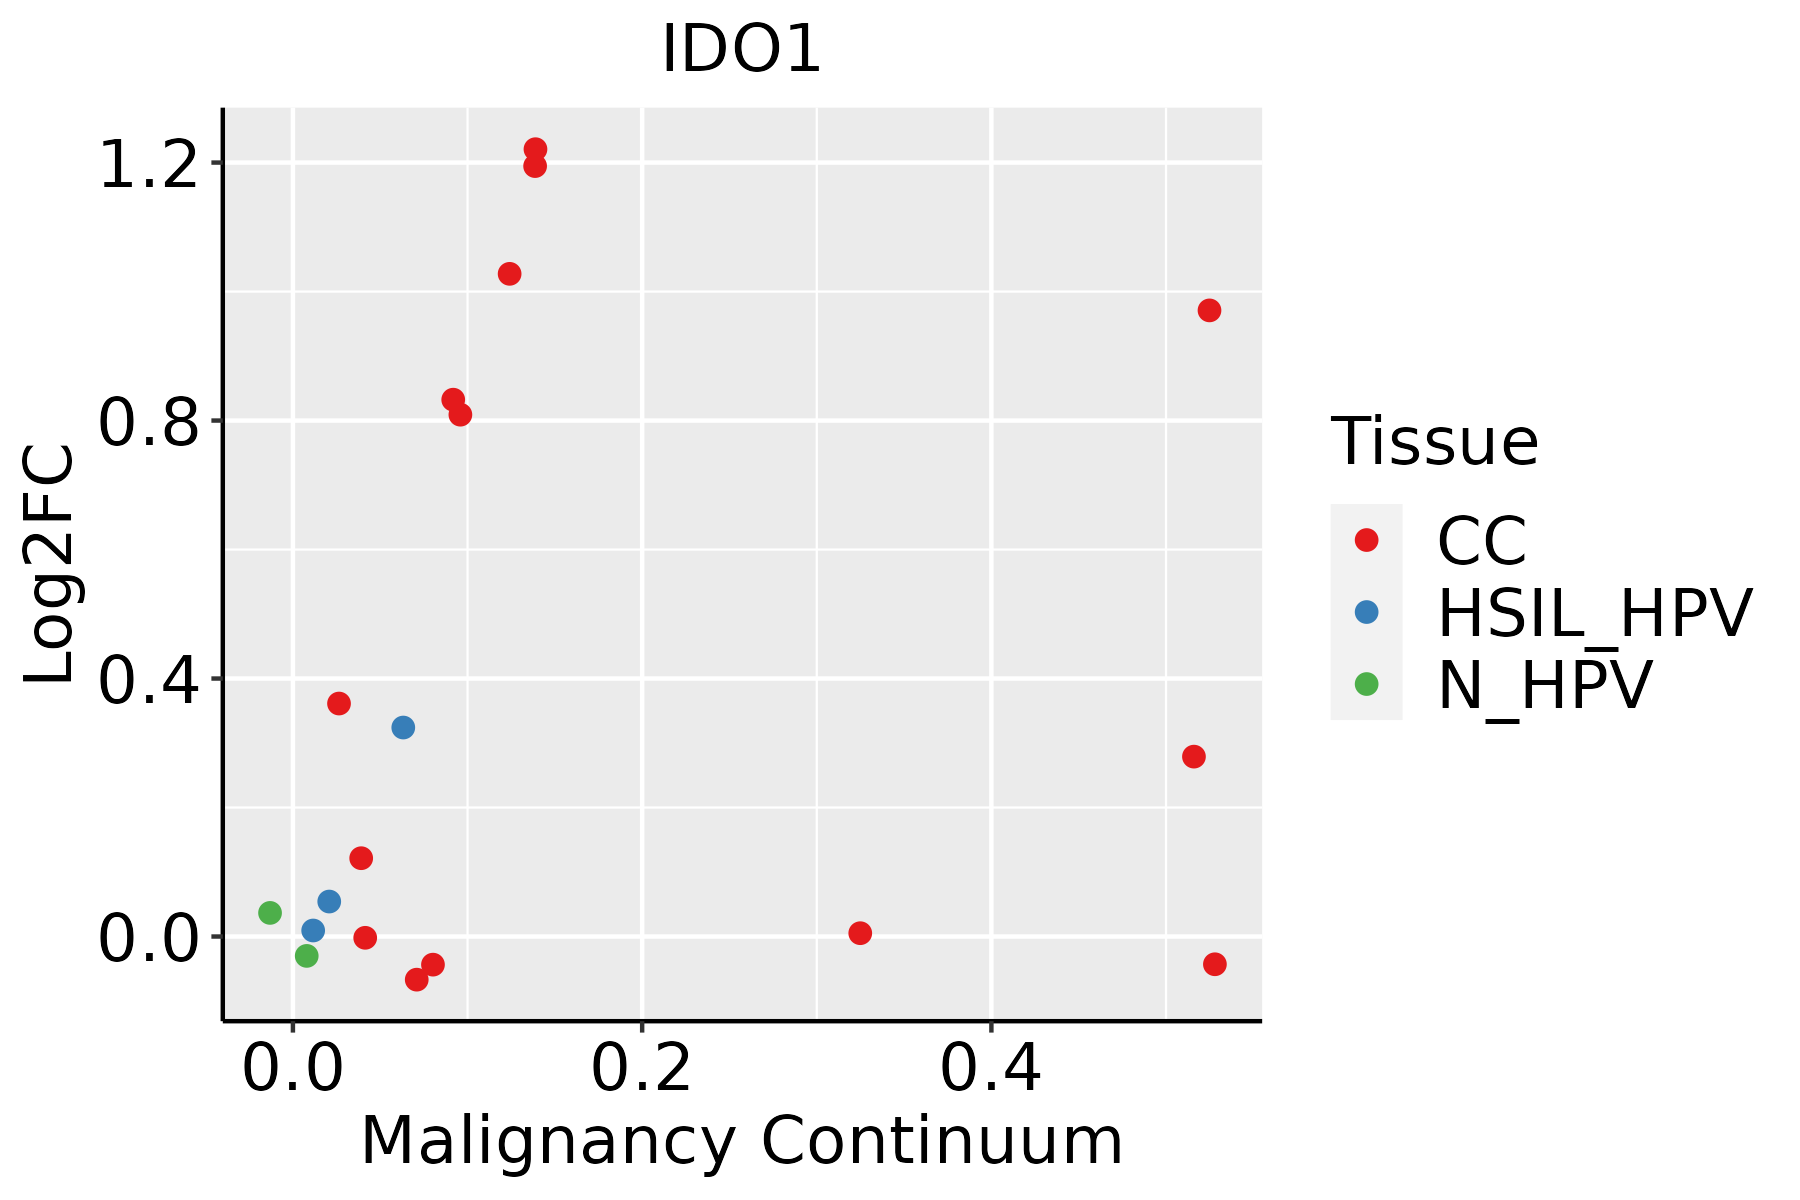 | CC: Cervix cancer |
| HSIL_HPV: HPV-infected high-grade squamous intraepithelial lesions | ||
| N_HPV: HPV-infected normal cervix | ||
| Endometrium |  | AEH: Atypical endometrial hyperplasia |
| EEC: Endometrioid Cancer | ||
| Esophagus | 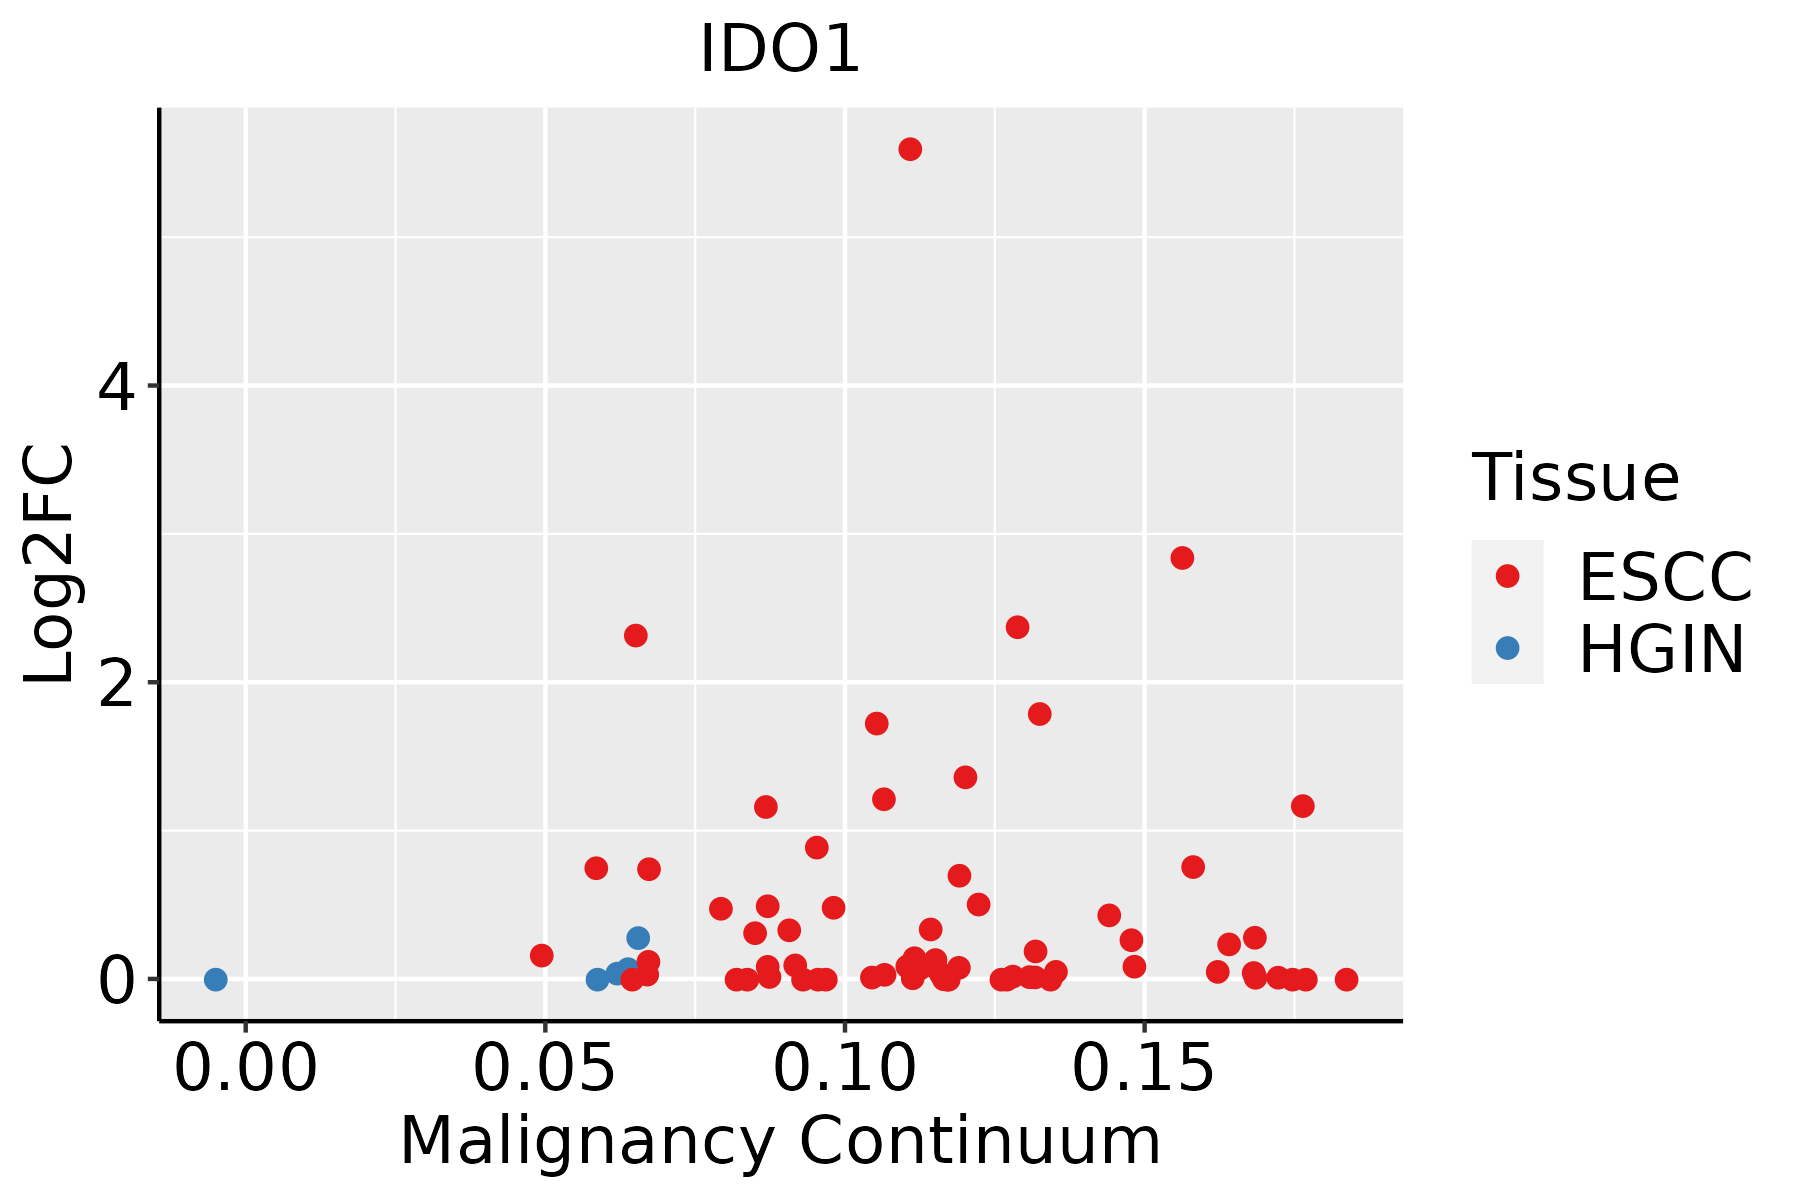 | ESCC: Esophageal squamous cell carcinoma |
| HGIN: High-grade intraepithelial neoplasias | ||
| LGIN: Low-grade intraepithelial neoplasias | ||
| Liver |  | HCC: Hepatocellular carcinoma |
| NAFLD: Non-alcoholic fatty liver disease | ||
| Oral Cavity | 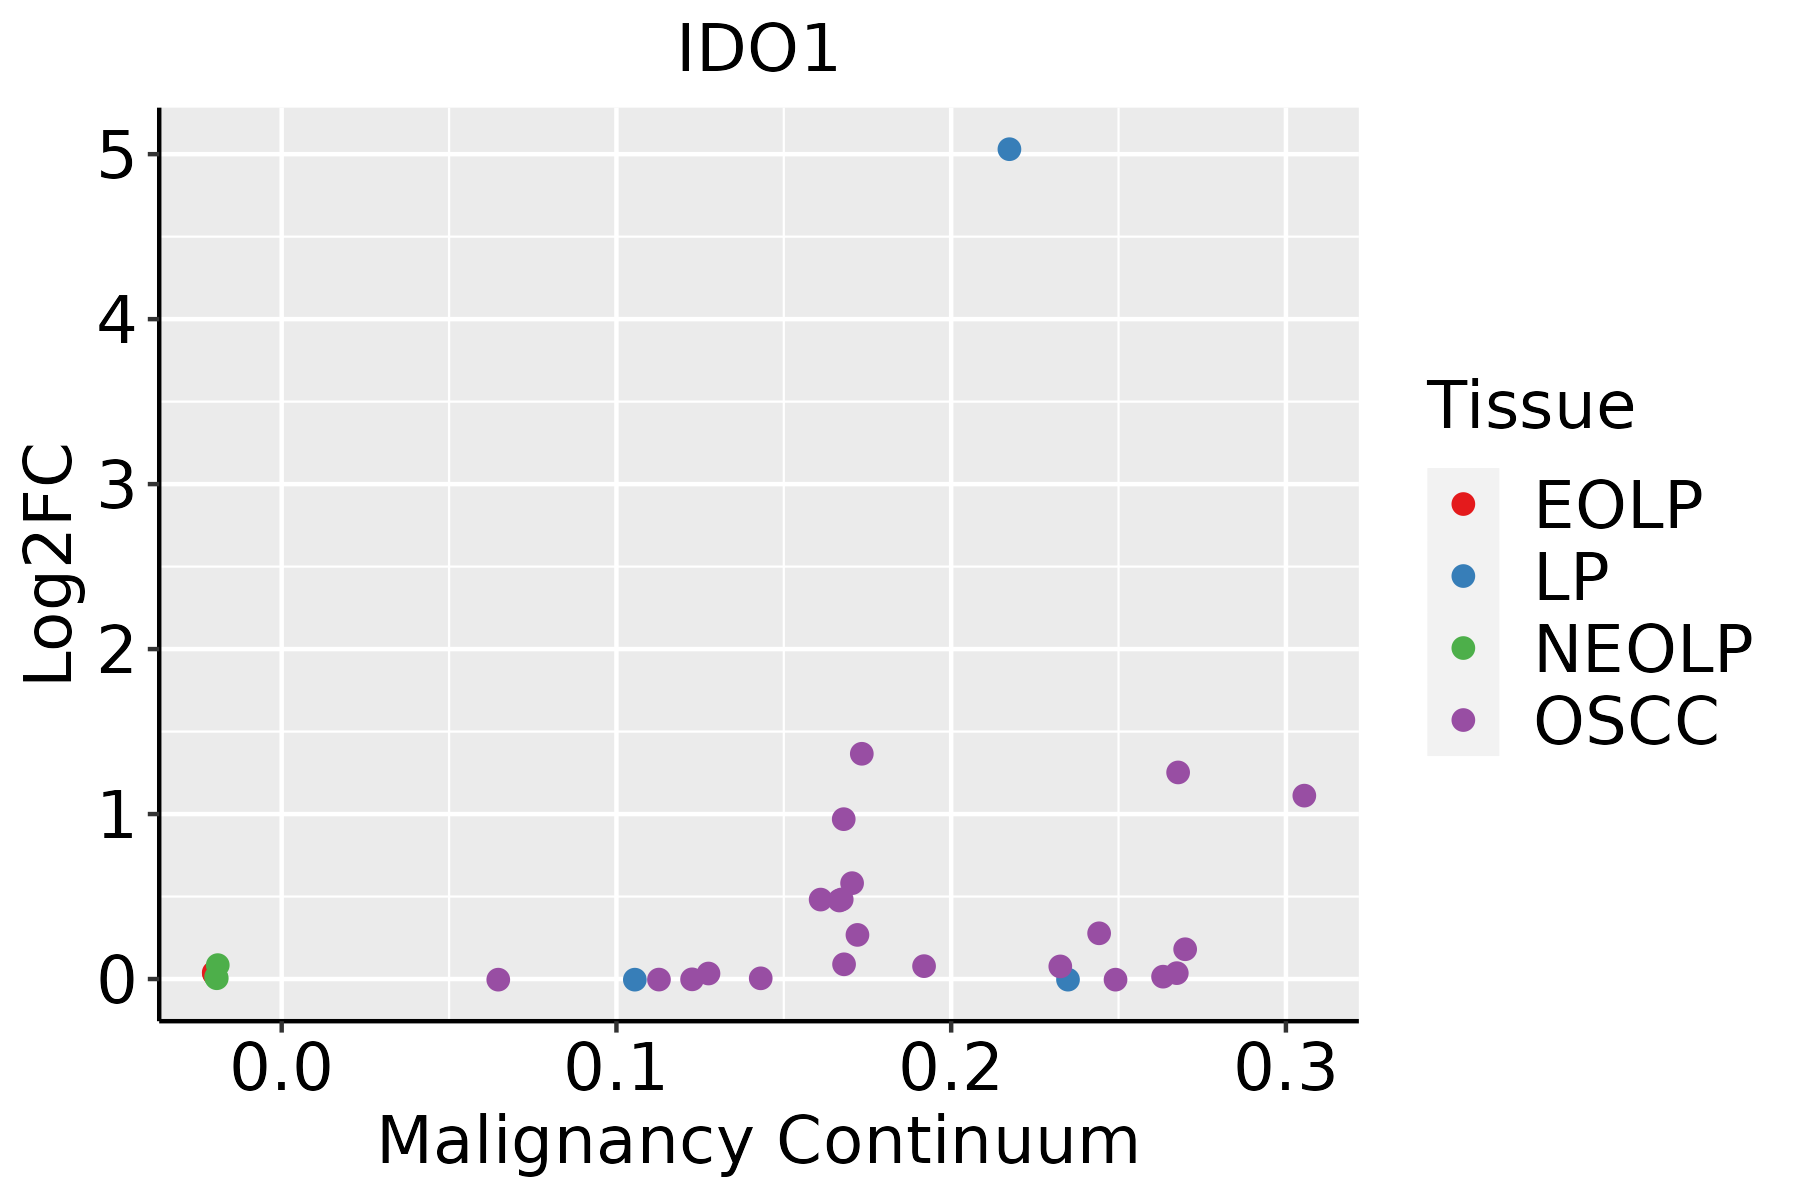 | EOLP: Erosive Oral lichen planus |
| LP: leukoplakia | ||
| NEOLP: Non-erosive oral lichen planus | ||
| OSCC: Oral squamous cell carcinoma |
| ∗log2FC in expression of this searched gene in stem-like cells from each diseased tissue sample relative to stem-like cells in normal samples in each tissue plotted against the malignancy continuum. Samples are colored based on if they are from different disease stage. |
Top |
Malignant transformation related pathway analysis |
| Find out the enriched GO biological processes and KEGG pathways involved in transition from healthy to precancer to cancer |
| Tissue | Disease Stage | Enriched GO biological Processes |
| Colorectum | AD |  |
| Colorectum | SER |  |
| Colorectum | MSS |  |
| Colorectum | MSI-H |  |
| Colorectum | FAP |  |
| ∗Top 15 enriched GO BP terms are showed in the bar plot of each disease state in each tissue. Each row represents a significant GO biological process which is colored according to the -log10(p.adjust). |
| Page: 1 2 3 4 5 6 7 8 9 |
| GO ID | Tissue | Disease Stage | Description | Gene Ratio | Bg Ratio | pvalue | p.adjust | Count |
| GO:00229009 | Cervix | CC | electron transport chain | 53/2311 | 175/18723 | 2.23e-10 | 3.43e-08 | 53 |
| GO:00060919 | Cervix | CC | generation of precursor metabolites and energy | 105/2311 | 490/18723 | 7.40e-09 | 6.61e-07 | 105 |
| GO:00075654 | Cervix | CC | female pregnancy | 43/2311 | 193/18723 | 7.62e-05 | 1.04e-03 | 43 |
| GO:00467008 | Cervix | CC | heterocycle catabolic process | 80/2311 | 445/18723 | 3.23e-04 | 3.42e-03 | 80 |
| GO:00447064 | Cervix | CC | multi-multicellular organism process | 45/2311 | 220/18723 | 4.14e-04 | 4.21e-03 | 45 |
| GO:00442709 | Cervix | CC | cellular nitrogen compound catabolic process | 79/2311 | 451/18723 | 7.80e-04 | 6.91e-03 | 79 |
| GO:00194398 | Cervix | CC | aromatic compound catabolic process | 79/2311 | 467/18723 | 2.14e-03 | 1.54e-02 | 79 |
| GO:19013618 | Cervix | CC | organic cyclic compound catabolic process | 80/2311 | 495/18723 | 6.77e-03 | 3.72e-02 | 80 |
| GO:000911710 | Cervix | CC | nucleotide metabolic process | 79/2311 | 489/18723 | 7.16e-03 | 3.85e-02 | 79 |
| GO:000756512 | Cervix | HSIL_HPV | female pregnancy | 26/737 | 193/18723 | 4.32e-08 | 3.41e-06 | 26 |
| GO:004470611 | Cervix | HSIL_HPV | multi-multicellular organism process | 27/737 | 220/18723 | 1.69e-07 | 1.03e-05 | 27 |
| GO:002290014 | Cervix | HSIL_HPV | electron transport chain | 18/737 | 175/18723 | 1.93e-04 | 3.56e-03 | 18 |
| GO:000609114 | Cervix | HSIL_HPV | generation of precursor metabolites and energy | 32/737 | 490/18723 | 3.69e-03 | 3.27e-02 | 32 |
| GO:000609110 | Endometrium | AEH | generation of precursor metabolites and energy | 121/2100 | 490/18723 | 1.65e-17 | 8.23e-15 | 121 |
| GO:002290010 | Endometrium | AEH | electron transport chain | 60/2100 | 175/18723 | 4.37e-16 | 1.75e-13 | 60 |
| GO:00075655 | Endometrium | AEH | female pregnancy | 43/2100 | 193/18723 | 7.52e-06 | 1.80e-04 | 43 |
| GO:004427010 | Endometrium | AEH | cellular nitrogen compound catabolic process | 80/2100 | 451/18723 | 2.09e-05 | 4.13e-04 | 80 |
| GO:00467009 | Endometrium | AEH | heterocycle catabolic process | 79/2100 | 445/18723 | 2.27e-05 | 4.35e-04 | 79 |
| GO:00447065 | Endometrium | AEH | multi-multicellular organism process | 45/2100 | 220/18723 | 4.55e-05 | 7.61e-04 | 45 |
| GO:00194399 | Endometrium | AEH | aromatic compound catabolic process | 80/2100 | 467/18723 | 7.21e-05 | 1.10e-03 | 80 |
| Page: 1 2 3 4 5 |
| Pathway ID | Tissue | Disease Stage | Description | Gene Ratio | Bg Ratio | pvalue | p.adjust | qvalue | Count |
| hsa012405 | Esophagus | ESCC | Biosynthesis of cofactors | 97/4205 | 153/8465 | 3.88e-04 | 1.35e-03 | 6.94e-04 | 97 |
| hsa0124012 | Esophagus | ESCC | Biosynthesis of cofactors | 97/4205 | 153/8465 | 3.88e-04 | 1.35e-03 | 6.94e-04 | 97 |
| hsa012402 | Liver | HCC | Biosynthesis of cofactors | 103/4020 | 153/8465 | 4.67e-07 | 5.05e-06 | 2.81e-06 | 103 |
| hsa012403 | Liver | HCC | Biosynthesis of cofactors | 103/4020 | 153/8465 | 4.67e-07 | 5.05e-06 | 2.81e-06 | 103 |
| hsa012404 | Oral cavity | OSCC | Biosynthesis of cofactors | 88/3704 | 153/8465 | 3.84e-04 | 1.20e-03 | 6.12e-04 | 88 |
| hsa0124011 | Oral cavity | OSCC | Biosynthesis of cofactors | 88/3704 | 153/8465 | 3.84e-04 | 1.20e-03 | 6.12e-04 | 88 |
| Page: 1 |
Top |
Cell-cell communication analysis |
| Identification of potential cell-cell interactions between two cell types and their ligand-receptor pairs for different disease states |
| Ligand | Receptor | LRpair | Pathway | Tissue | Disease Stage |
| Page: 1 |
Top |
Single-cell gene regulatory network inference analysis |
| Find out the significant the regulons (TFs) and the target genes of each regulon across cell types for different disease states |
| TF | Cell Type | Tissue | Disease Stage | Target Gene | RSS | Regulon Activity |
| ∗The dot plots of a searched regulon are shown for all cell subpopulations in each disease state of each tissue based on the regulon specific score inferred using pySCENIC and by calculating the average expression. |
| Page: 1 |
Top |
Somatic mutation of malignant transformation related genes |
| Annotation of somatic variants for genes involved in malignant transformation |
| Hugo Symbol | Variant Class | Variant Classification | dbSNP RS | HGVSc | HGVSp | HGVSp Short | SWISSPROT | BIOTYPE | SIFT | PolyPhen | Tumor Sample Barcode | Tissue | Histology | Sex | Age | Stage | Therapy Types | Drugs | Outcome |
| IDO1 | SNV | Missense_Mutation | rs761098064 | c.950N>A | p.Arg317His | p.R317H | P14902 | protein_coding | deleterious(0) | probably_damaging(1) | TCGA-BH-A1ES-06 | Breast | breast invasive carcinoma | Female | <65 | I/II | Unknown | Unknown | PD |
| IDO1 | SNV | Missense_Mutation | rs756117395 | c.986G>A | p.Arg329Gln | p.R329Q | P14902 | protein_coding | tolerated(0.69) | benign(0) | TCGA-S3-A6ZH-01 | Breast | breast invasive carcinoma | Female | <65 | III/IV | Chemotherapy | adriamycin | CR |
| IDO1 | SNV | Missense_Mutation | rs370075063 | c.463N>T | p.Arg155Cys | p.R155C | P14902 | protein_coding | deleterious(0) | possibly_damaging(0.852) | TCGA-AA-3984-01 | Colorectum | colon adenocarcinoma | Female | <65 | I/II | Unknown | Unknown | SD |
| IDO1 | SNV | Missense_Mutation | rs774225205 | c.691N>T | p.Arg231Cys | p.R231C | P14902 | protein_coding | deleterious(0) | probably_damaging(1) | TCGA-AA-3984-01 | Colorectum | colon adenocarcinoma | Female | <65 | I/II | Unknown | Unknown | SD |
| IDO1 | SNV | Missense_Mutation | c.1107A>C | p.Glu369Asp | p.E369D | P14902 | protein_coding | tolerated(0.36) | benign(0.423) | TCGA-AD-6889-01 | Colorectum | colon adenocarcinoma | Male | >=65 | I/II | Chemotherapy | xeloda | PD | |
| IDO1 | SNV | Missense_Mutation | c.820G>A | p.Asp274Asn | p.D274N | P14902 | protein_coding | deleterious(0) | probably_damaging(1) | TCGA-AD-6895-01 | Colorectum | colon adenocarcinoma | Male | >=65 | III/IV | Unknown | Unknown | SD | |
| IDO1 | SNV | Missense_Mutation | c.87N>T | p.Gln29His | p.Q29H | P14902 | protein_coding | deleterious(0) | benign(0.269) | TCGA-CK-4951-01 | Colorectum | colon adenocarcinoma | Female | >=65 | I/II | Unknown | Unknown | PD | |
| IDO1 | SNV | Missense_Mutation | c.998A>G | p.Asp333Gly | p.D333G | P14902 | protein_coding | deleterious(0) | possibly_damaging(0.637) | TCGA-CM-5861-01 | Colorectum | colon adenocarcinoma | Female | <65 | I/II | Unknown | Unknown | PD | |
| IDO1 | SNV | Missense_Mutation | rs12545878 | c.348N>T | p.Lys116Asn | p.K116N | P14902 | protein_coding | deleterious(0.02) | benign(0.387) | TCGA-AG-3892-01 | Colorectum | rectum adenocarcinoma | Female | <65 | I/II | Unknown | Unknown | SD |
| IDO1 | SNV | Missense_Mutation | rs370075063 | c.463C>T | p.Arg155Cys | p.R155C | P14902 | protein_coding | deleterious(0) | possibly_damaging(0.852) | TCGA-EI-6917-01 | Colorectum | rectum adenocarcinoma | Male | <65 | III/IV | Chemotherapy | 5fluorouracil+oxaciplatina+l-folinian | SD |
| Page: 1 2 3 4 5 |
Top |
Related drugs of malignant transformation related genes |
| Identification of chemicals and drugs interact with genes involved in malignant transfromation |
| (DGIdb 4.0) |
| Entrez ID | Symbol | Category | Interaction Types | Drug Claim Name | Drug Name | PMIDs |
| 3620 | IDO1 | ENZYME, CLINICALLY ACTIONABLE, DRUGGABLE GENOME | Benzimidazole and imadazopyridine carboximidamide compound 1 | |||
| 3620 | IDO1 | ENZYME, CLINICALLY ACTIONABLE, DRUGGABLE GENOME | Cyclic hydroxamate derivative 1 | |||
| 3620 | IDO1 | ENZYME, CLINICALLY ACTIONABLE, DRUGGABLE GENOME | PHENYLHYDRAZINE | PHENYLHYDRAZINE | 24262887 | |
| 3620 | IDO1 | ENZYME, CLINICALLY ACTIONABLE, DRUGGABLE GENOME | inhibitor | 363894234 | ||
| 3620 | IDO1 | ENZYME, CLINICALLY ACTIONABLE, DRUGGABLE GENOME | Biphenyl derivative 2 | |||
| 3620 | IDO1 | ENZYME, CLINICALLY ACTIONABLE, DRUGGABLE GENOME | PMID29473428-Compound-14 | |||
| 3620 | IDO1 | ENZYME, CLINICALLY ACTIONABLE, DRUGGABLE GENOME | 2,3-diamino-benzo[b]thiophene derivative 8 | |||
| 3620 | IDO1 | ENZYME, CLINICALLY ACTIONABLE, DRUGGABLE GENOME | NLG8189 | |||
| 3620 | IDO1 | ENZYME, CLINICALLY ACTIONABLE, DRUGGABLE GENOME | PMID29473428-Compound-53 | |||
| 3620 | IDO1 | ENZYME, CLINICALLY ACTIONABLE, DRUGGABLE GENOME | inhibitor | 249565907 |
| Page: 1 2 3 4 5 6 7 8 9 10 11 12 |

Copyright 2023-Present -The University of Texas Health Science Center at Houston |