
|
|||||
|
 | |
| |
| |
| |
| |
| |
|
Gene: IDI1 |
Gene summary for IDI1 |
| Gene information | Species | Human | Gene symbol | IDI1 | Gene ID | 3422 |
| Gene name | isopentenyl-diphosphate delta isomerase 1 | |
| Gene Alias | IPP1 | |
| Cytomap | 10p15.3 | |
| Gene Type | protein-coding | GO ID | GO:0006066 | UniProtAcc | Q13907 |
Top |
Malignant transformation analysis |
| Identification of the aberrant gene expression in precancerous and cancerous lesions by comparing the gene expression of stem-like cells in diseased tissues with normal stem cells |
| Entrez ID | Symbol | Replicates | Species | Organ | Tissue | Adj P-value | Log2FC | Malignancy |
| 3422 | IDI1 | HTA11_2487_2000001011 | Human | Colorectum | SER | 4.96e-06 | 4.07e-01 | -0.1808 |
| 3422 | IDI1 | HTA11_78_2000001011 | Human | Colorectum | AD | 2.08e-02 | 2.19e-01 | -0.1088 |
| 3422 | IDI1 | HTA11_347_2000001011 | Human | Colorectum | AD | 3.90e-09 | 2.78e-01 | -0.1954 |
| 3422 | IDI1 | HTA11_411_2000001011 | Human | Colorectum | SER | 1.22e-04 | 9.13e-01 | -0.2602 |
| 3422 | IDI1 | HTA11_2112_2000001011 | Human | Colorectum | SER | 8.00e-04 | 7.69e-01 | -0.2196 |
| 3422 | IDI1 | HTA11_696_2000001011 | Human | Colorectum | AD | 1.78e-07 | 3.78e-01 | -0.1464 |
| 3422 | IDI1 | HTA11_1391_2000001011 | Human | Colorectum | AD | 2.60e-03 | 1.52e-01 | -0.059 |
| 3422 | IDI1 | HTA11_99999965104_69814 | Human | Colorectum | MSS | 5.06e-03 | 8.00e-02 | 0.281 |
| 3422 | IDI1 | A001-C-104 | Human | Colorectum | FAP | 1.71e-02 | -1.29e-01 | 0.0184 |
| 3422 | IDI1 | LZE2T | Human | Esophagus | ESCC | 4.75e-03 | 2.31e-01 | 0.082 |
| 3422 | IDI1 | LZE4T | Human | Esophagus | ESCC | 1.16e-09 | 4.47e-01 | 0.0811 |
| 3422 | IDI1 | LZE5T | Human | Esophagus | ESCC | 5.62e-03 | 4.47e-01 | 0.0514 |
| 3422 | IDI1 | LZE8T | Human | Esophagus | ESCC | 8.35e-09 | -4.45e-02 | 0.067 |
| 3422 | IDI1 | LZE20T | Human | Esophagus | ESCC | 2.69e-02 | 1.33e-01 | 0.0662 |
| 3422 | IDI1 | LZE24T | Human | Esophagus | ESCC | 2.01e-14 | 6.01e-01 | 0.0596 |
| 3422 | IDI1 | LZE21T | Human | Esophagus | ESCC | 6.88e-05 | 3.44e-01 | 0.0655 |
| 3422 | IDI1 | LZE6T | Human | Esophagus | ESCC | 4.99e-10 | 6.32e-01 | 0.0845 |
| 3422 | IDI1 | P1T-E | Human | Esophagus | ESCC | 5.07e-08 | 6.80e-01 | 0.0875 |
| 3422 | IDI1 | P2T-E | Human | Esophagus | ESCC | 1.69e-15 | 1.33e-01 | 0.1177 |
| 3422 | IDI1 | P4T-E | Human | Esophagus | ESCC | 1.15e-22 | 9.11e-01 | 0.1323 |
| Page: 1 2 3 4 5 6 7 |
| Tissue | Expression Dynamics | Abbreviation |
| Colorectum (GSE201348) | 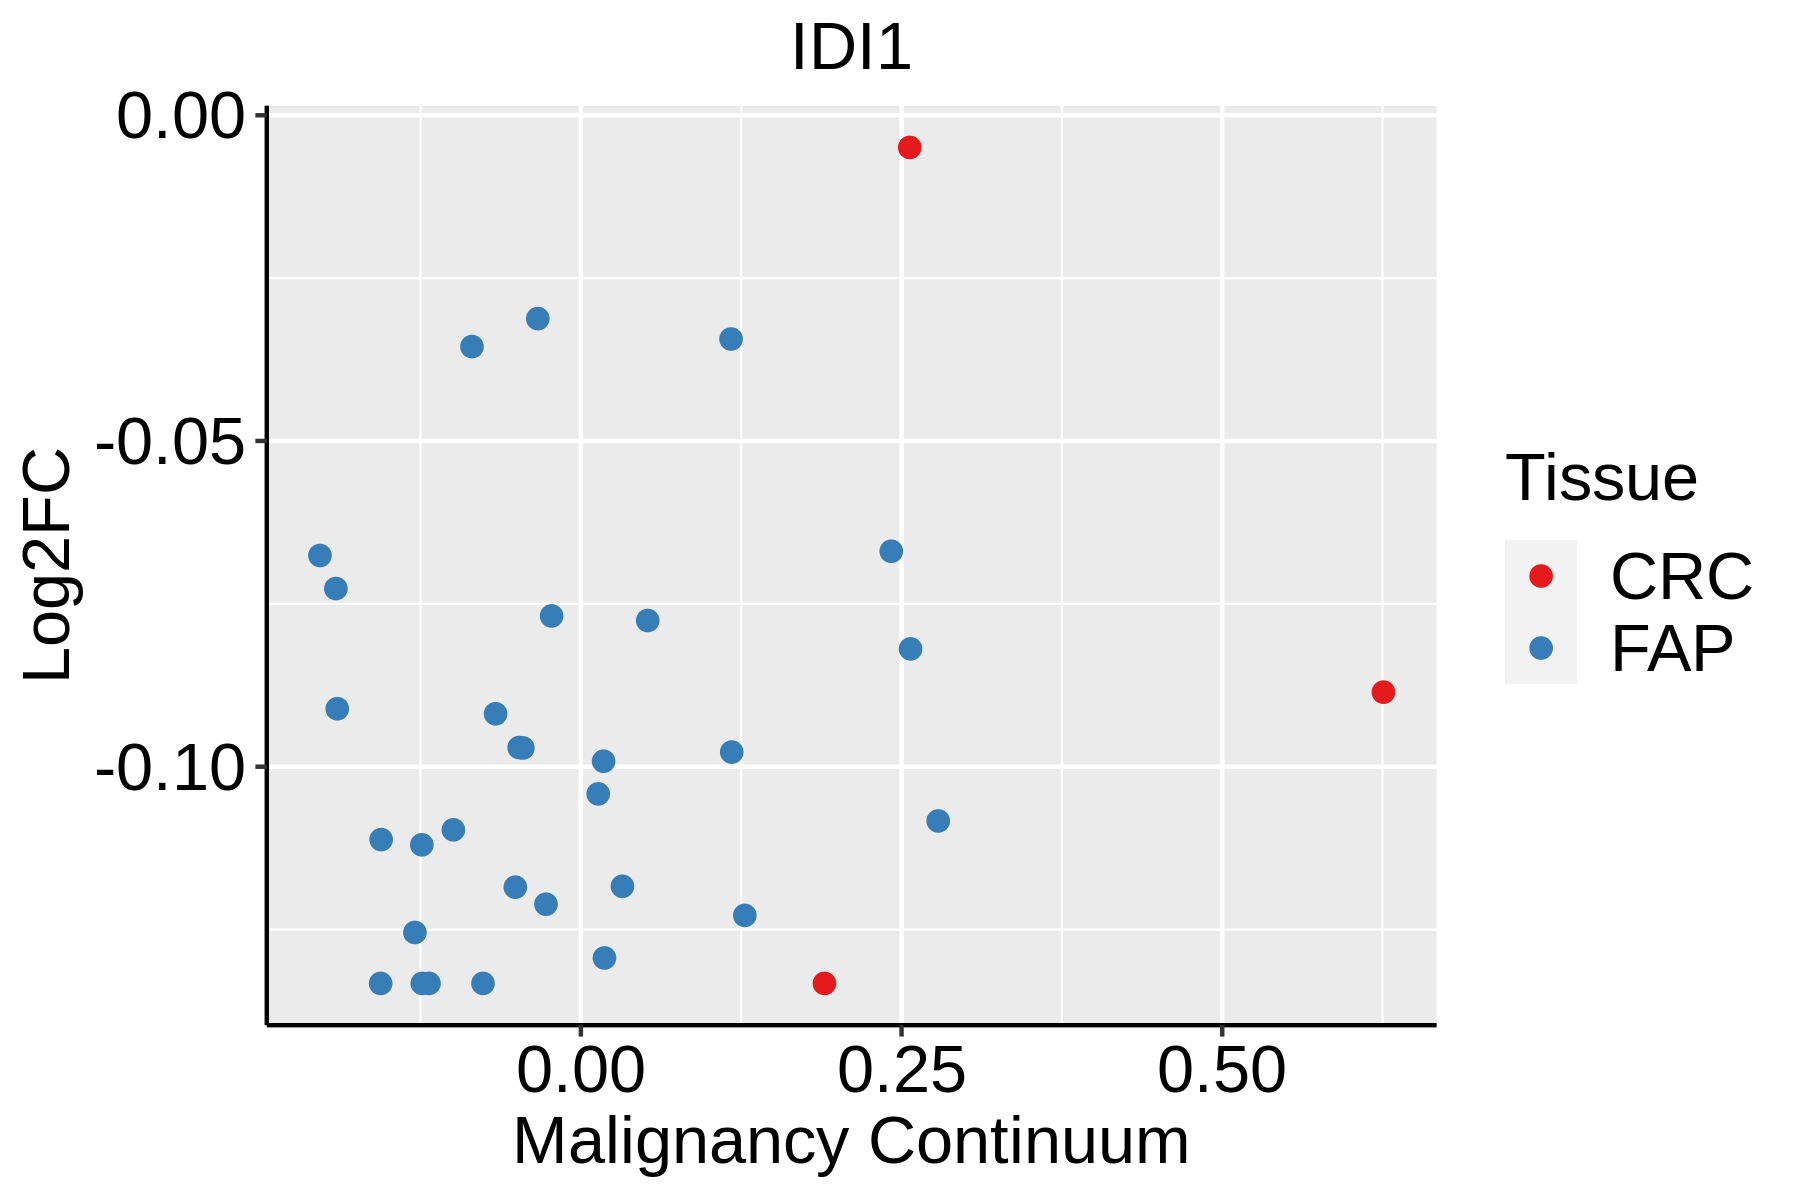 | FAP: Familial adenomatous polyposis |
| CRC: Colorectal cancer | ||
| Colorectum (HTA11) |  | AD: Adenomas |
| SER: Sessile serrated lesions | ||
| MSI-H: Microsatellite-high colorectal cancer | ||
| MSS: Microsatellite stable colorectal cancer | ||
| Esophagus | 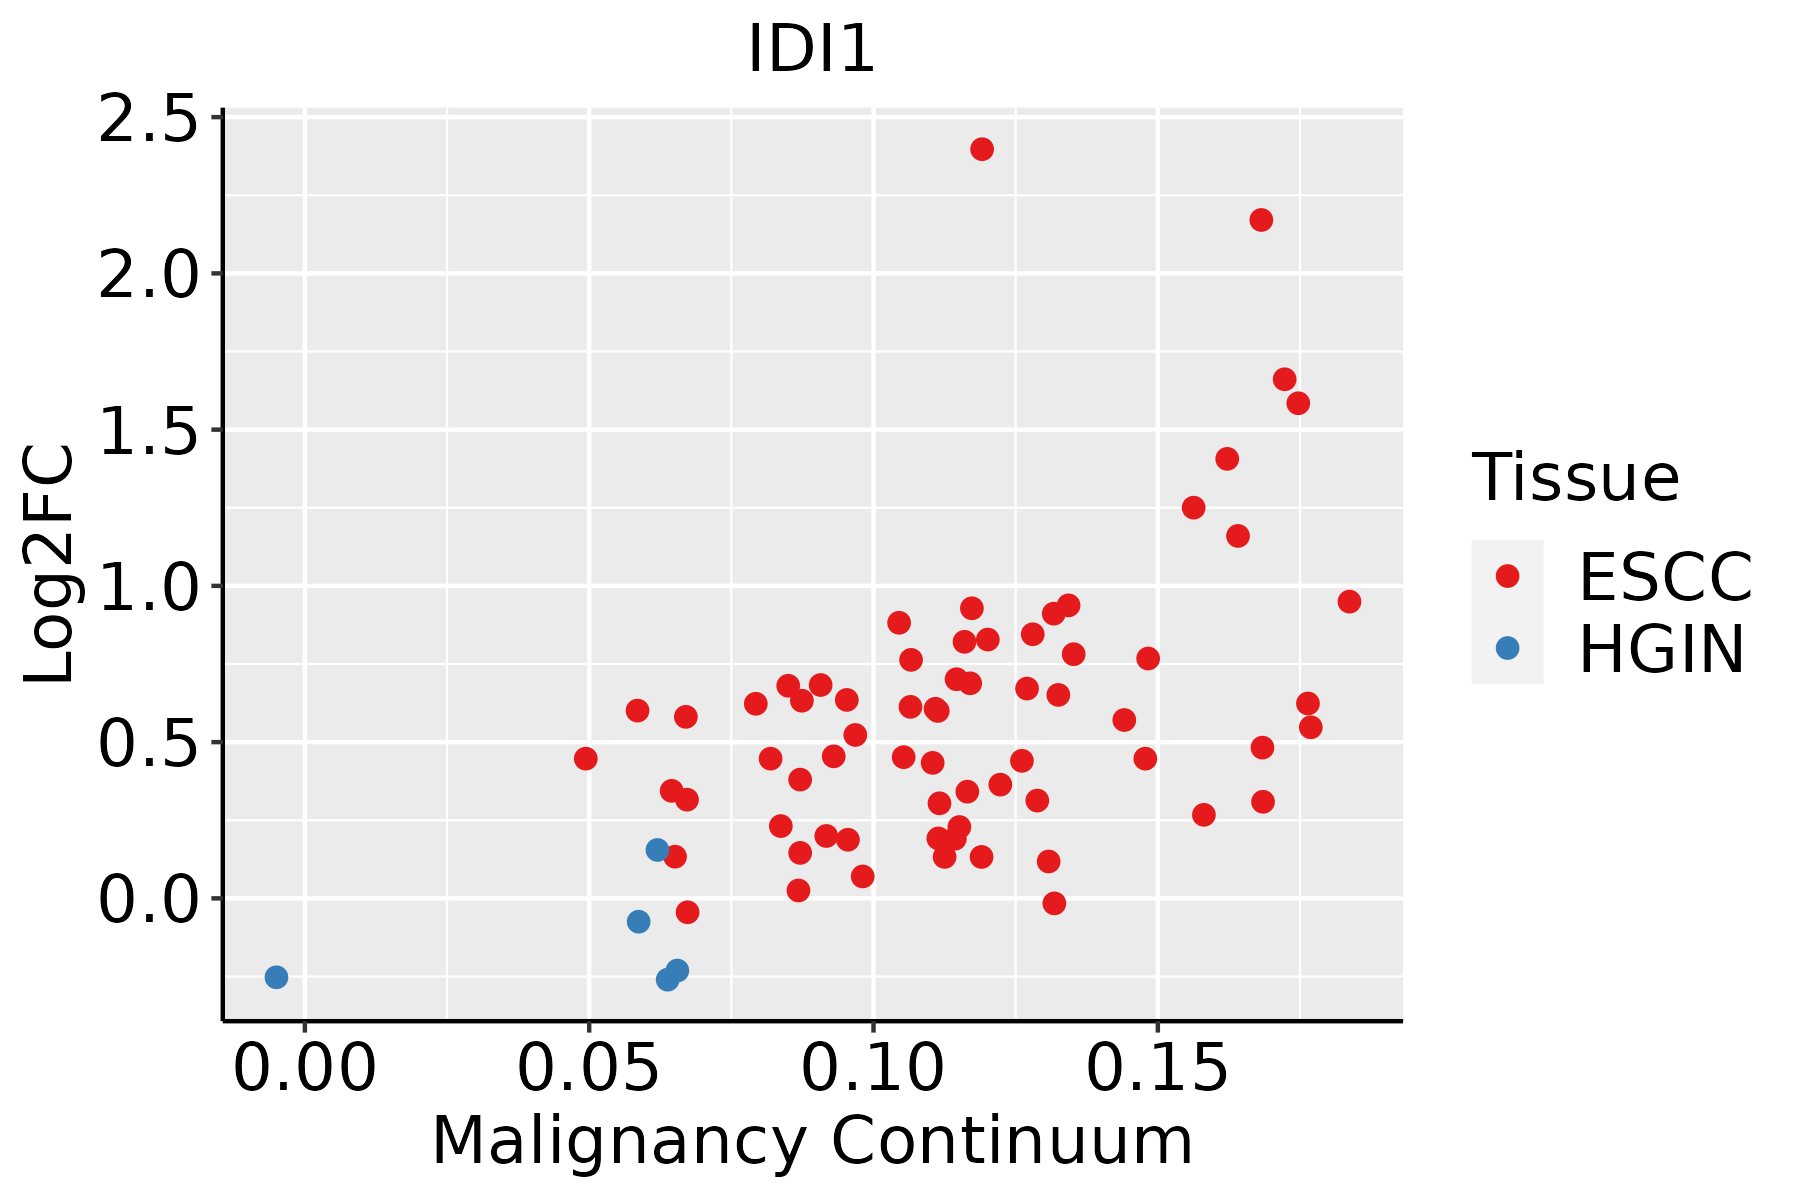 | ESCC: Esophageal squamous cell carcinoma |
| HGIN: High-grade intraepithelial neoplasias | ||
| LGIN: Low-grade intraepithelial neoplasias | ||
| Liver |  | HCC: Hepatocellular carcinoma |
| NAFLD: Non-alcoholic fatty liver disease | ||
| Oral Cavity |  | EOLP: Erosive Oral lichen planus |
| LP: leukoplakia | ||
| NEOLP: Non-erosive oral lichen planus | ||
| OSCC: Oral squamous cell carcinoma | ||
| Prostate | 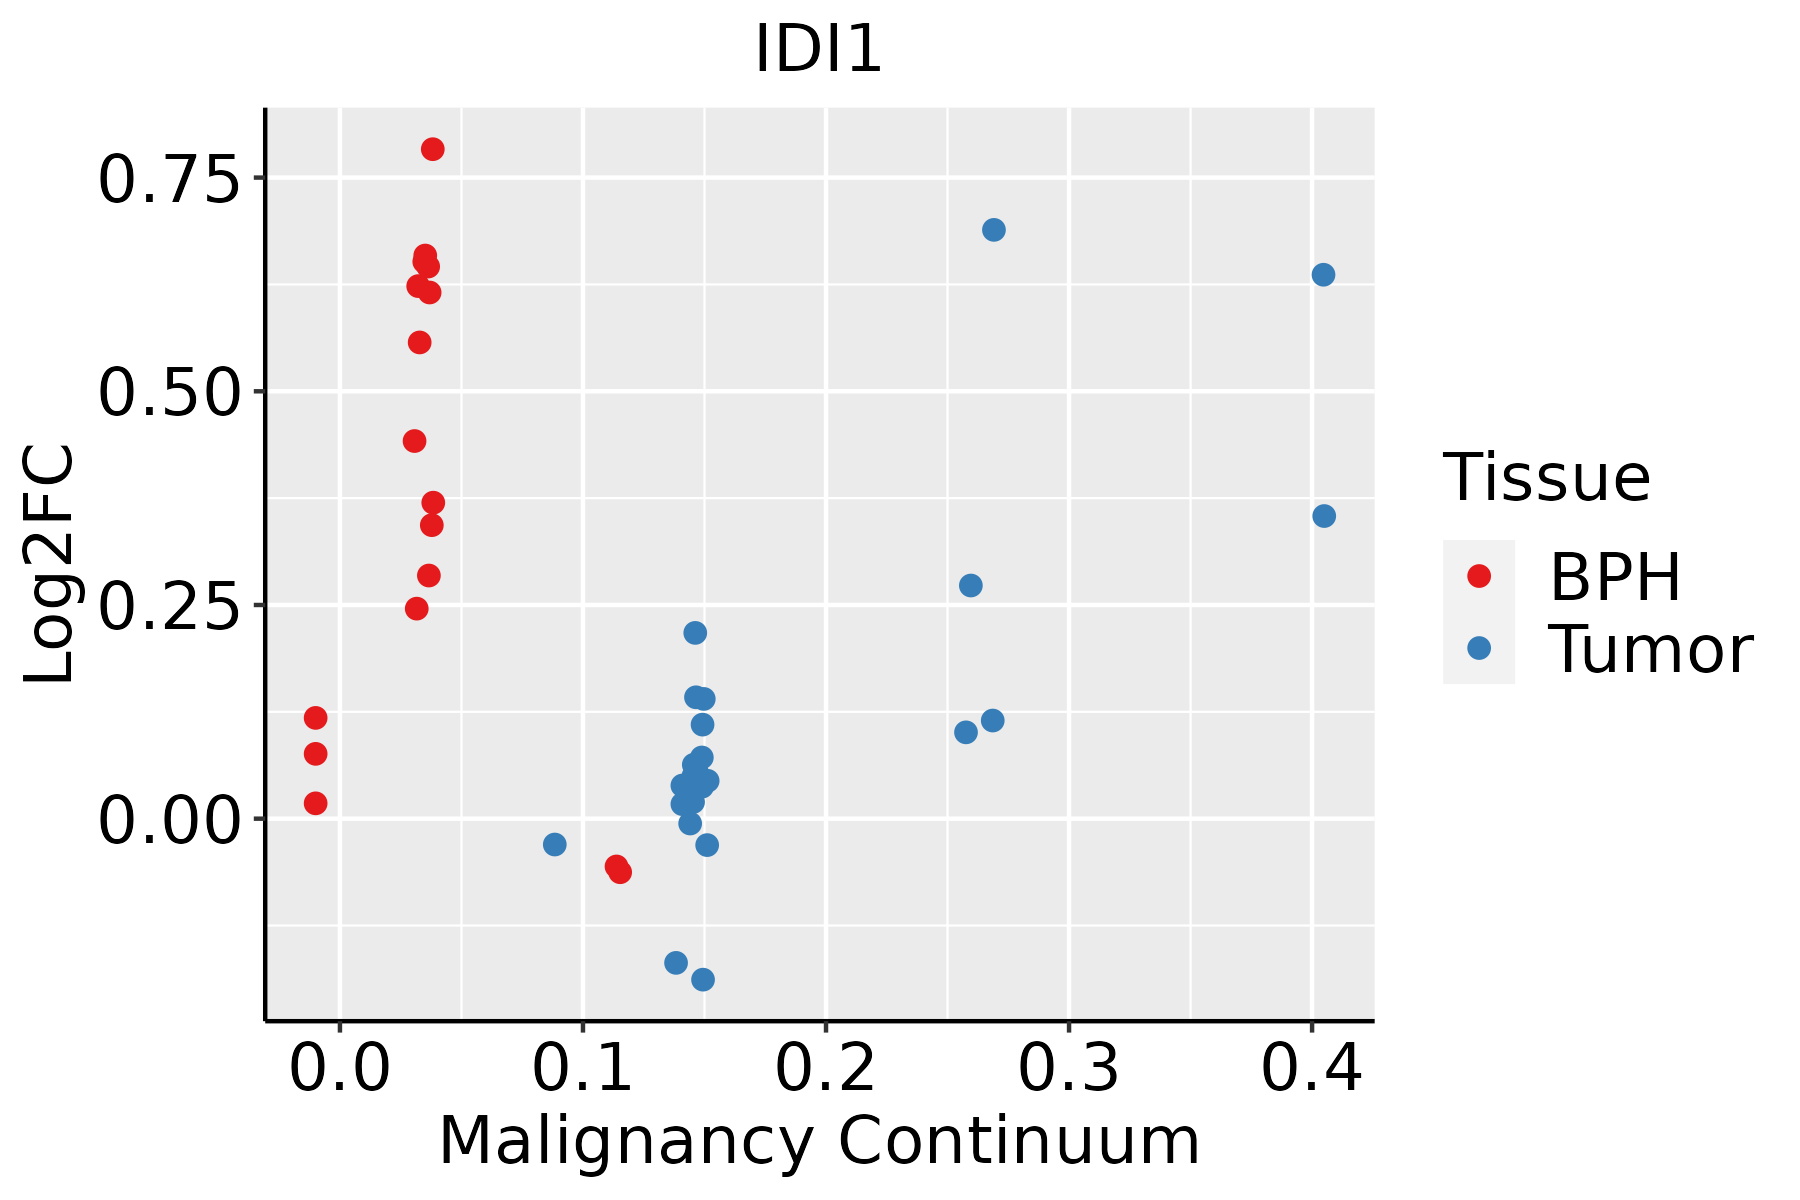 | BPH: Benign Prostatic Hyperplasia |
| Skin |  | AK: Actinic keratosis |
| cSCC: Cutaneous squamous cell carcinoma | ||
| SCCIS:squamous cell carcinoma in situ | ||
| Thyroid | 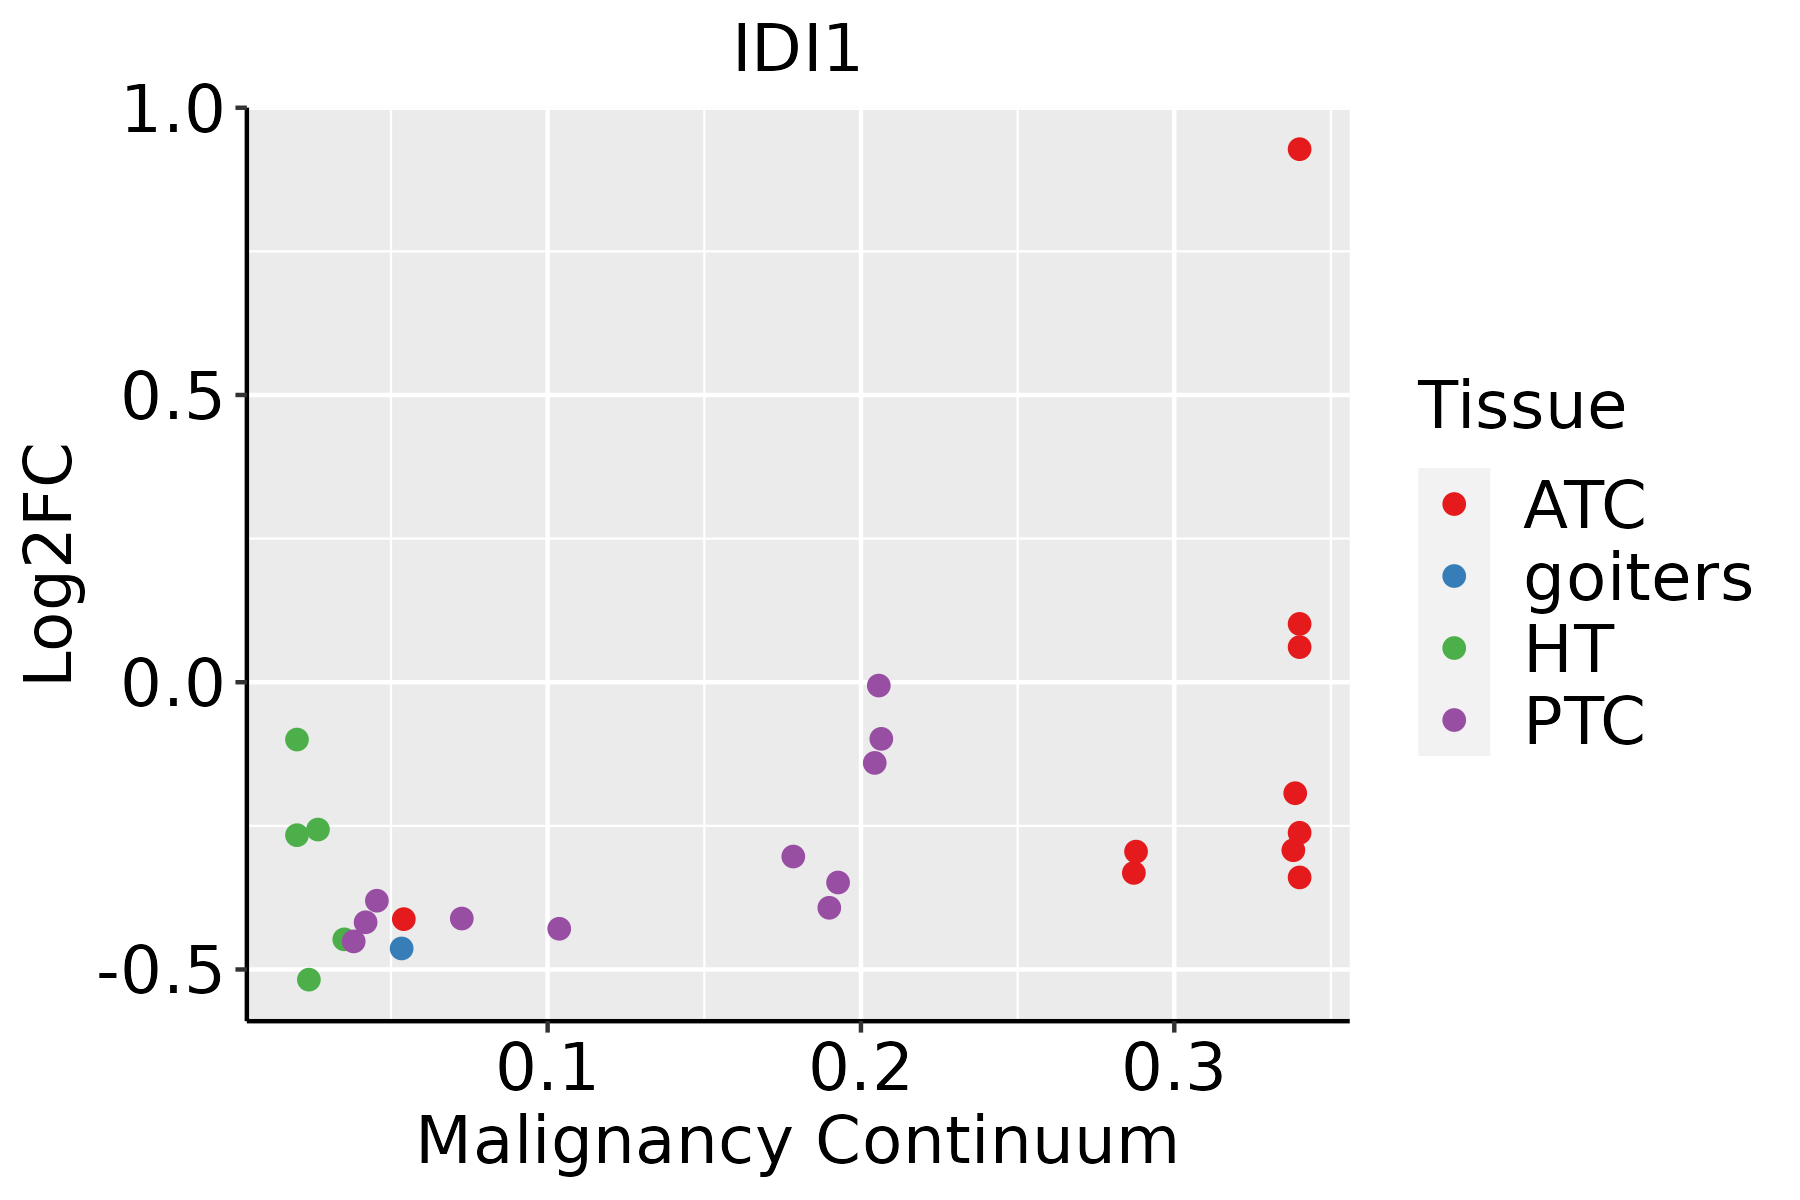 | ATC: Anaplastic thyroid cancer |
| HT: Hashimoto's thyroiditis | ||
| PTC: Papillary thyroid cancer |
| ∗log2FC in expression of this searched gene in stem-like cells from each diseased tissue sample relative to stem-like cells in normal samples in each tissue plotted against the malignancy continuum. Samples are colored based on if they are from different disease stage. |
Top |
Malignant transformation related pathway analysis |
| Find out the enriched GO biological processes and KEGG pathways involved in transition from healthy to precancer to cancer |
| Tissue | Disease Stage | Enriched GO biological Processes |
| Colorectum | AD |  |
| Colorectum | SER |  |
| Colorectum | MSS |  |
| Colorectum | MSI-H |  |
| Colorectum | FAP |  |
| ∗Top 15 enriched GO BP terms are showed in the bar plot of each disease state in each tissue. Each row represents a significant GO biological process which is colored according to the -log10(p.adjust). |
| Page: 1 2 3 4 5 6 7 8 9 |
| GO ID | Tissue | Disease Stage | Description | Gene Ratio | Bg Ratio | pvalue | p.adjust | Count |
| GO:0006066 | Colorectum | AD | alcohol metabolic process | 106/3918 | 353/18723 | 3.02e-05 | 5.57e-04 | 106 |
| GO:0006644 | Colorectum | AD | phospholipid metabolic process | 101/3918 | 383/18723 | 5.80e-03 | 3.67e-02 | 101 |
| GO:0008202 | Colorectum | AD | steroid metabolic process | 85/3918 | 319/18723 | 8.07e-03 | 4.75e-02 | 85 |
| GO:00060661 | Colorectum | SER | alcohol metabolic process | 79/2897 | 353/18723 | 3.50e-04 | 5.50e-03 | 79 |
| GO:00066441 | Colorectum | SER | phospholipid metabolic process | 79/2897 | 383/18723 | 3.94e-03 | 3.24e-02 | 79 |
| GO:00060662 | Colorectum | MSS | alcohol metabolic process | 92/3467 | 353/18723 | 2.57e-04 | 3.46e-03 | 92 |
| GO:0008654 | Colorectum | FAP | phospholipid biosynthetic process | 54/2622 | 253/18723 | 8.88e-04 | 9.08e-03 | 54 |
| GO:00066442 | Colorectum | FAP | phospholipid metabolic process | 74/2622 | 383/18723 | 2.24e-03 | 1.83e-02 | 74 |
| GO:00060663 | Colorectum | FAP | alcohol metabolic process | 69/2622 | 353/18723 | 2.29e-03 | 1.85e-02 | 69 |
| GO:00086544 | Esophagus | ESCC | phospholipid biosynthetic process | 162/8552 | 253/18723 | 2.59e-09 | 5.73e-08 | 162 |
| GO:00066446 | Esophagus | ESCC | phospholipid metabolic process | 218/8552 | 383/18723 | 5.37e-06 | 5.59e-05 | 218 |
| GO:00060668 | Esophagus | ESCC | alcohol metabolic process | 202/8552 | 353/18723 | 7.32e-06 | 7.26e-05 | 202 |
| GO:00161263 | Esophagus | ESCC | sterol biosynthetic process | 46/8552 | 64/18723 | 1.91e-05 | 1.67e-04 | 46 |
| GO:00066953 | Esophagus | ESCC | cholesterol biosynthetic process | 41/8552 | 57/18723 | 5.25e-05 | 4.06e-04 | 41 |
| GO:19026533 | Esophagus | ESCC | secondary alcohol biosynthetic process | 41/8552 | 57/18723 | 5.25e-05 | 4.06e-04 | 41 |
| GO:19026524 | Esophagus | ESCC | secondary alcohol metabolic process | 87/8552 | 147/18723 | 6.58e-04 | 3.50e-03 | 87 |
| GO:00461653 | Esophagus | ESCC | alcohol biosynthetic process | 83/8552 | 140/18723 | 8.04e-04 | 4.16e-03 | 83 |
| GO:00082991 | Esophagus | ESCC | isoprenoid biosynthetic process | 21/8552 | 28/18723 | 1.57e-03 | 7.33e-03 | 21 |
| GO:00066946 | Esophagus | ESCC | steroid biosynthetic process | 98/8552 | 173/18723 | 2.34e-03 | 1.03e-02 | 98 |
| GO:00082034 | Esophagus | ESCC | cholesterol metabolic process | 79/8552 | 137/18723 | 3.11e-03 | 1.29e-02 | 79 |
| Page: 1 2 3 4 |
| Pathway ID | Tissue | Disease Stage | Description | Gene Ratio | Bg Ratio | pvalue | p.adjust | qvalue | Count |
| hsa009005 | Esophagus | ESCC | Terpenoid backbone biosynthesis | 20/4205 | 23/8465 | 2.14e-04 | 7.87e-04 | 4.03e-04 | 20 |
| hsa0090012 | Esophagus | ESCC | Terpenoid backbone biosynthesis | 20/4205 | 23/8465 | 2.14e-04 | 7.87e-04 | 4.03e-04 | 20 |
| hsa00900 | Liver | HCC | Terpenoid backbone biosynthesis | 17/4020 | 23/8465 | 9.26e-03 | 2.46e-02 | 1.37e-02 | 17 |
| hsa009001 | Liver | HCC | Terpenoid backbone biosynthesis | 17/4020 | 23/8465 | 9.26e-03 | 2.46e-02 | 1.37e-02 | 17 |
| hsa009004 | Oral cavity | OSCC | Terpenoid backbone biosynthesis | 19/3704 | 23/8465 | 1.55e-04 | 5.34e-04 | 2.72e-04 | 19 |
| hsa0090011 | Oral cavity | OSCC | Terpenoid backbone biosynthesis | 19/3704 | 23/8465 | 1.55e-04 | 5.34e-04 | 2.72e-04 | 19 |
| hsa009002 | Oral cavity | LP | Terpenoid backbone biosynthesis | 12/2418 | 23/8465 | 1.43e-02 | 4.59e-02 | 2.96e-02 | 12 |
| hsa009003 | Oral cavity | LP | Terpenoid backbone biosynthesis | 12/2418 | 23/8465 | 1.43e-02 | 4.59e-02 | 2.96e-02 | 12 |
| Page: 1 |
Top |
Cell-cell communication analysis |
| Identification of potential cell-cell interactions between two cell types and their ligand-receptor pairs for different disease states |
| Ligand | Receptor | LRpair | Pathway | Tissue | Disease Stage |
| Page: 1 |
Top |
Single-cell gene regulatory network inference analysis |
| Find out the significant the regulons (TFs) and the target genes of each regulon across cell types for different disease states |
| TF | Cell Type | Tissue | Disease Stage | Target Gene | RSS | Regulon Activity |
| ∗The dot plots of a searched regulon are shown for all cell subpopulations in each disease state of each tissue based on the regulon specific score inferred using pySCENIC and by calculating the average expression. |
| Page: 1 |
Top |
Somatic mutation of malignant transformation related genes |
| Annotation of somatic variants for genes involved in malignant transformation |
| Hugo Symbol | Variant Class | Variant Classification | dbSNP RS | HGVSc | HGVSp | HGVSp Short | SWISSPROT | BIOTYPE | SIFT | PolyPhen | Tumor Sample Barcode | Tissue | Histology | Sex | Age | Stage | Therapy Types | Drugs | Outcome |
| IDI1 | SNV | Missense_Mutation | c.128N>A | p.Arg43Gln | p.R43Q | Q13907 | protein_coding | tolerated_low_confidence(0.42) | benign(0.015) | TCGA-AR-A0TU-01 | Breast | breast invasive carcinoma | Female | <65 | I/II | Unspecific | Doxorubicin | SD | |
| IDI1 | SNV | Missense_Mutation | c.665N>A | p.Pro222His | p.P222H | Q13907 | protein_coding | deleterious(0.02) | probably_damaging(0.999) | TCGA-BH-A0HX-01 | Breast | breast invasive carcinoma | Female | <65 | I/II | Chemotherapy | adrimycin | SD | |
| IDI1 | SNV | Missense_Mutation | c.535N>C | p.Glu179Gln | p.E179Q | Q13907 | protein_coding | tolerated(1) | benign(0.003) | TCGA-D8-A1JA-01 | Breast | breast invasive carcinoma | Female | <65 | III/IV | Chemotherapy | adriamycin | PD | |
| IDI1 | SNV | Missense_Mutation | c.326N>A | p.Arg109Gln | p.R109Q | Q13907 | protein_coding | deleterious(0) | probably_damaging(1) | TCGA-D8-A27G-01 | Breast | breast invasive carcinoma | Female | >=65 | I/II | Unknown | Unknown | SD | |
| IDI1 | SNV | Missense_Mutation | novel | c.835G>A | p.Glu279Lys | p.E279K | Q13907 | protein_coding | tolerated(0.29) | benign(0.003) | TCGA-D8-A27V-01 | Breast | breast invasive carcinoma | Female | <65 | I/II | Hormone Therapy | tamoxiphen | SD |
| IDI1 | SNV | Missense_Mutation | novel | c.460N>A | p.Glu154Lys | p.E154K | Q13907 | protein_coding | deleterious(0.03) | possibly_damaging(0.864) | TCGA-C5-A2LZ-01 | Cervix | cervical & endocervical cancer | Female | >=65 | III/IV | Unknown | Unknown | PD |
| IDI1 | SNV | Missense_Mutation | novel | c.76N>T | p.Ala26Ser | p.A26S | Q13907 | protein_coding | tolerated_low_confidence(0.76) | benign(0.009) | TCGA-AA-A022-01 | Colorectum | colon adenocarcinoma | Female | >=65 | I/II | Unknown | Unknown | SD |
| IDI1 | SNV | Missense_Mutation | c.166N>T | p.Val56Leu | p.V56L | Q13907 | protein_coding | tolerated_low_confidence(0.33) | benign(0.003) | TCGA-G4-6304-01 | Colorectum | colon adenocarcinoma | Female | >=65 | I/II | Chemotherapy | fluorouracil | PD | |
| IDI1 | insertion | Frame_Shift_Ins | novel | c.726dupA | p.Ala243SerfsTer5 | p.A243Sfs*5 | Q13907 | protein_coding | TCGA-AZ-6598-01 | Colorectum | colon adenocarcinoma | Female | >=65 | I/II | Unknown | Unknown | SD | ||
| IDI1 | deletion | Frame_Shift_Del | c.388_395delGCTAAGAT | p.Ala130TyrfsTer12 | p.A130Yfs*12 | Q13907 | protein_coding | TCGA-WS-AB45-01 | Colorectum | colon adenocarcinoma | Female | <65 | I/II | Unknown | Unknown | SD |
| Page: 1 2 3 |
Top |
Related drugs of malignant transformation related genes |
| Identification of chemicals and drugs interact with genes involved in malignant transfromation |
| (DGIdb 4.0) |
| Entrez ID | Symbol | Category | Interaction Types | Drug Claim Name | Drug Name | PMIDs |
| 3422 | IDI1 | ENZYME | inhibitor | 135650699 |
| Page: 1 |

Copyright 2023-Present -The University of Texas Health Science Center at Houston |