
|
|||||
|
 | |
| |
| |
| |
| |
| |
|
Gene: IDH3G |
Gene summary for IDH3G |
| Gene information | Species | Human | Gene symbol | IDH3G | Gene ID | 3421 |
| Gene name | isocitrate dehydrogenase (NAD(+)) 3 non-catalytic subunit gamma | |
| Gene Alias | H-IDHG | |
| Cytomap | Xq28 | |
| Gene Type | protein-coding | GO ID | GO:0005975 | UniProtAcc | P51553 |
Top |
Malignant transformation analysis |
| Identification of the aberrant gene expression in precancerous and cancerous lesions by comparing the gene expression of stem-like cells in diseased tissues with normal stem cells |
| Entrez ID | Symbol | Replicates | Species | Organ | Tissue | Adj P-value | Log2FC | Malignancy |
| 3421 | IDH3G | LZE4T | Human | Esophagus | ESCC | 3.50e-11 | 3.53e-01 | 0.0811 |
| 3421 | IDH3G | LZE7T | Human | Esophagus | ESCC | 1.60e-08 | 4.77e-01 | 0.0667 |
| 3421 | IDH3G | LZE8T | Human | Esophagus | ESCC | 6.36e-09 | 3.28e-01 | 0.067 |
| 3421 | IDH3G | LZE20T | Human | Esophagus | ESCC | 1.29e-06 | 3.73e-01 | 0.0662 |
| 3421 | IDH3G | LZE22D1 | Human | Esophagus | HGIN | 7.60e-09 | 1.90e-01 | 0.0595 |
| 3421 | IDH3G | LZE22T | Human | Esophagus | ESCC | 2.92e-03 | 4.15e-01 | 0.068 |
| 3421 | IDH3G | LZE24T | Human | Esophagus | ESCC | 1.27e-39 | 1.10e+00 | 0.0596 |
| 3421 | IDH3G | LZE21T | Human | Esophagus | ESCC | 1.55e-06 | 5.22e-01 | 0.0655 |
| 3421 | IDH3G | LZE6T | Human | Esophagus | ESCC | 1.37e-10 | 4.09e-01 | 0.0845 |
| 3421 | IDH3G | P1T-E | Human | Esophagus | ESCC | 2.58e-21 | 1.02e+00 | 0.0875 |
| 3421 | IDH3G | P2T-E | Human | Esophagus | ESCC | 1.17e-38 | 8.55e-01 | 0.1177 |
| 3421 | IDH3G | P4T-E | Human | Esophagus | ESCC | 2.98e-32 | 6.29e-01 | 0.1323 |
| 3421 | IDH3G | P5T-E | Human | Esophagus | ESCC | 2.74e-25 | 5.57e-01 | 0.1327 |
| 3421 | IDH3G | P8T-E | Human | Esophagus | ESCC | 5.86e-29 | 6.14e-01 | 0.0889 |
| 3421 | IDH3G | P9T-E | Human | Esophagus | ESCC | 7.82e-39 | 8.34e-01 | 0.1131 |
| 3421 | IDH3G | P10T-E | Human | Esophagus | ESCC | 4.84e-38 | 9.24e-01 | 0.116 |
| 3421 | IDH3G | P11T-E | Human | Esophagus | ESCC | 1.10e-22 | 7.14e-01 | 0.1426 |
| 3421 | IDH3G | P12T-E | Human | Esophagus | ESCC | 3.48e-47 | 1.06e+00 | 0.1122 |
| 3421 | IDH3G | P15T-E | Human | Esophagus | ESCC | 5.21e-45 | 8.33e-01 | 0.1149 |
| 3421 | IDH3G | P16T-E | Human | Esophagus | ESCC | 1.76e-30 | 5.93e-01 | 0.1153 |
| Page: 1 2 3 4 5 6 7 |
| Tissue | Expression Dynamics | Abbreviation |
| Esophagus | 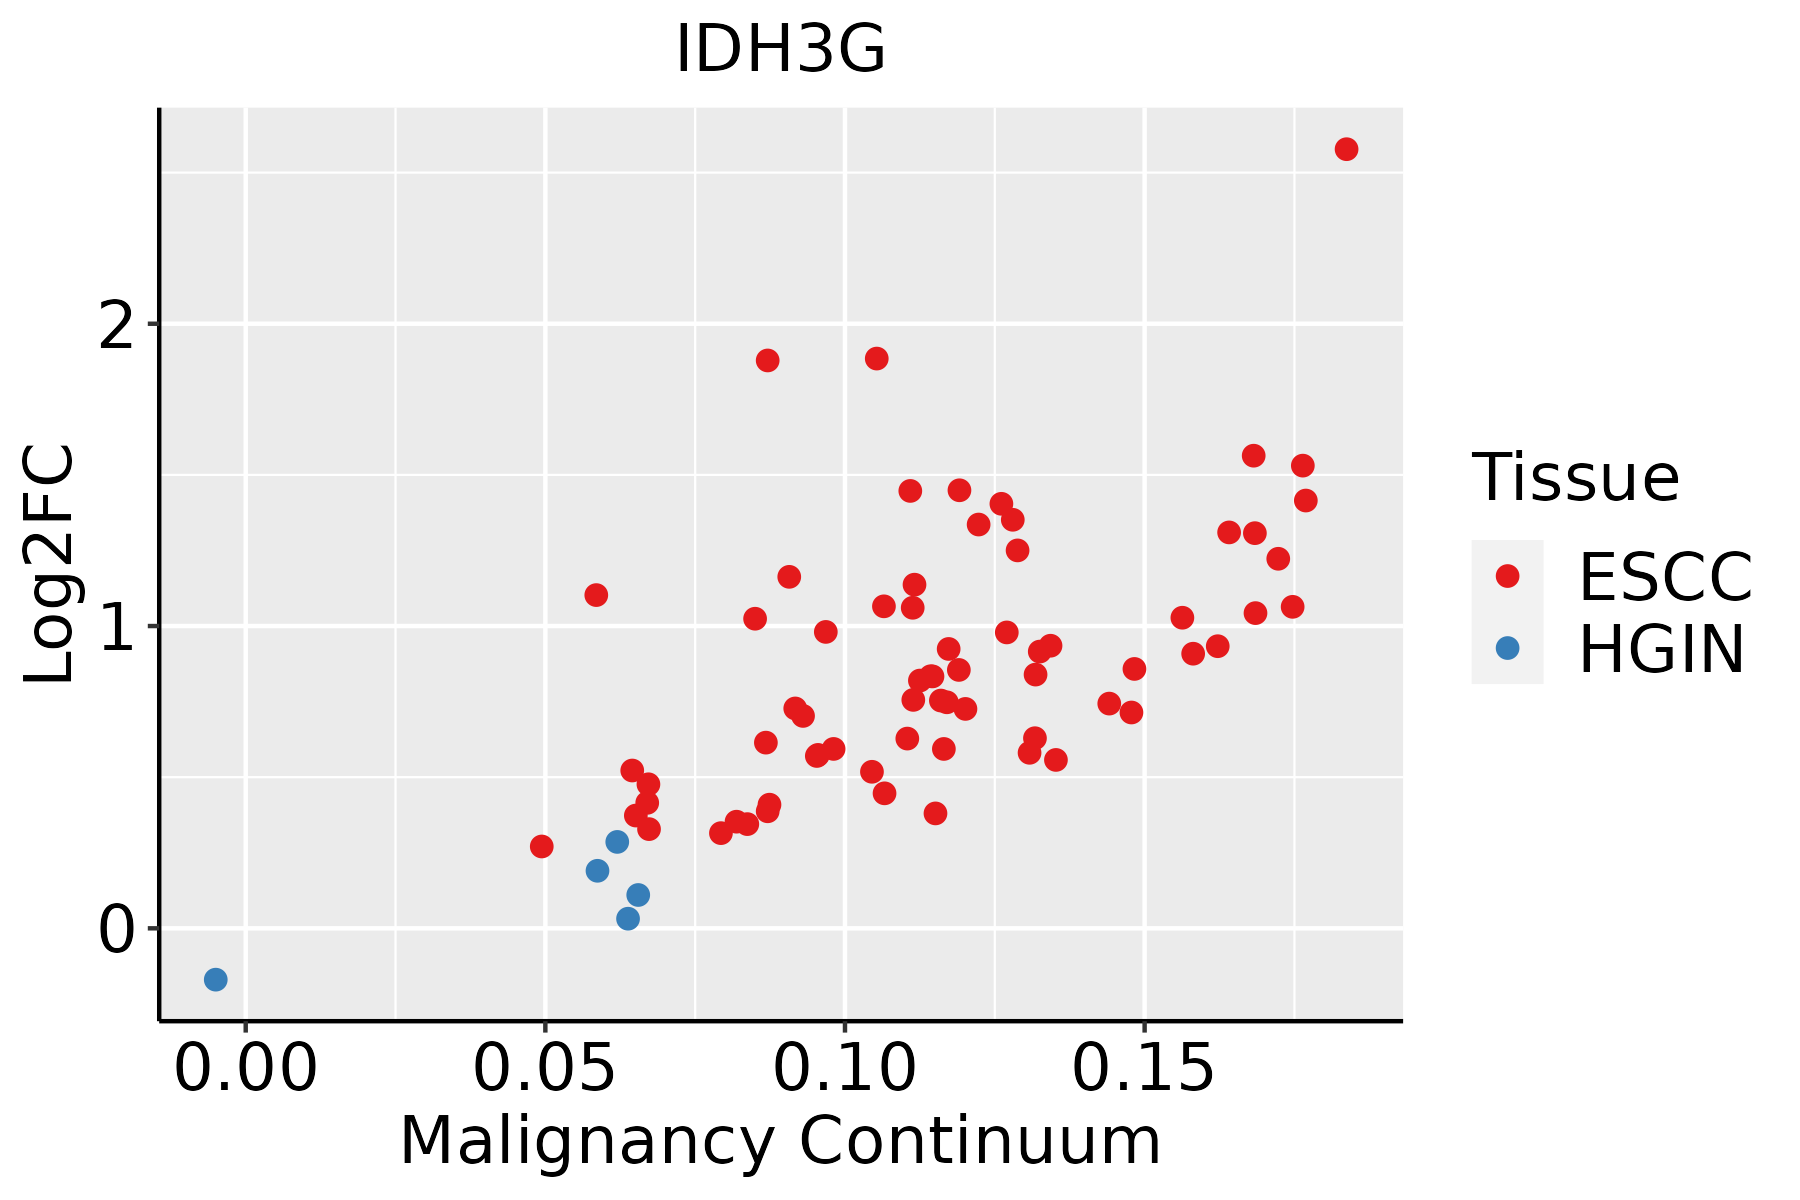 | ESCC: Esophageal squamous cell carcinoma |
| HGIN: High-grade intraepithelial neoplasias | ||
| LGIN: Low-grade intraepithelial neoplasias | ||
| Liver | 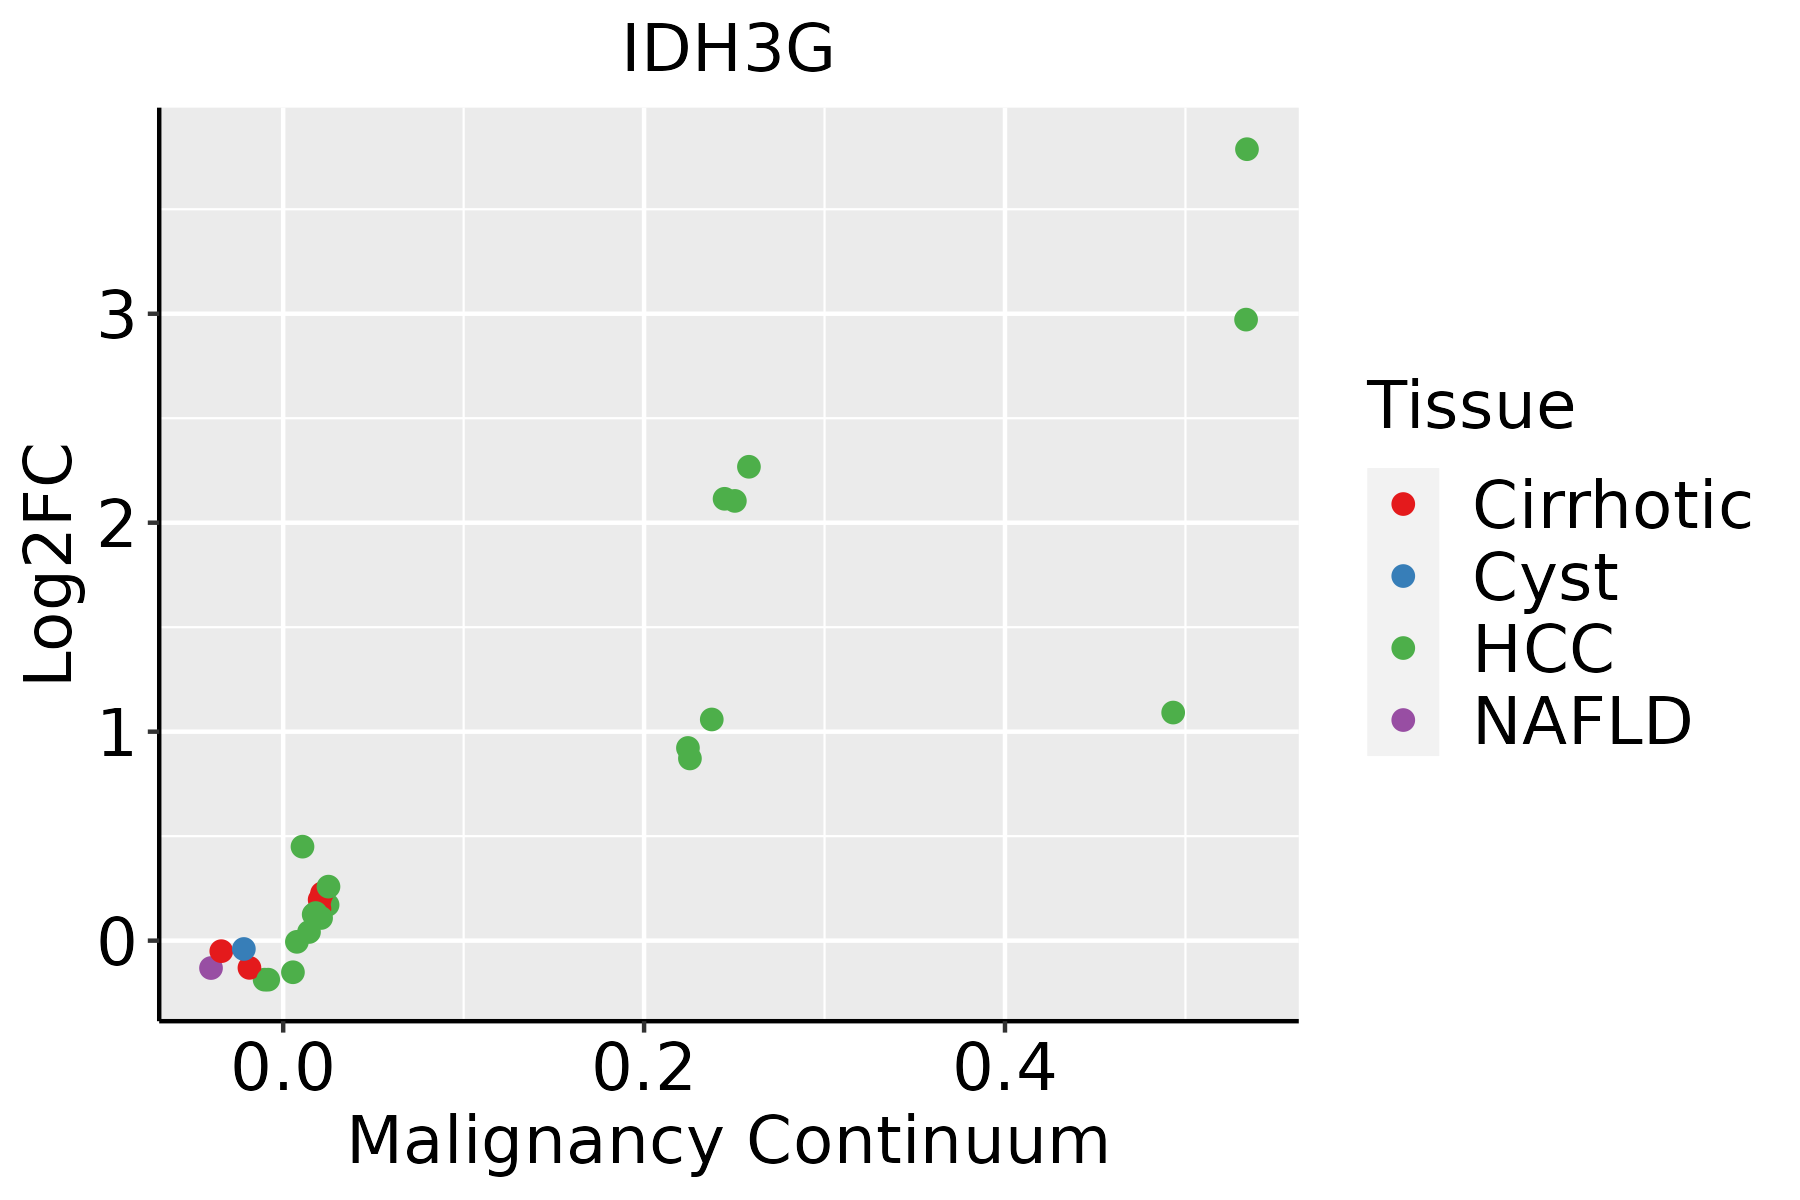 | HCC: Hepatocellular carcinoma |
| NAFLD: Non-alcoholic fatty liver disease | ||
| Oral Cavity | 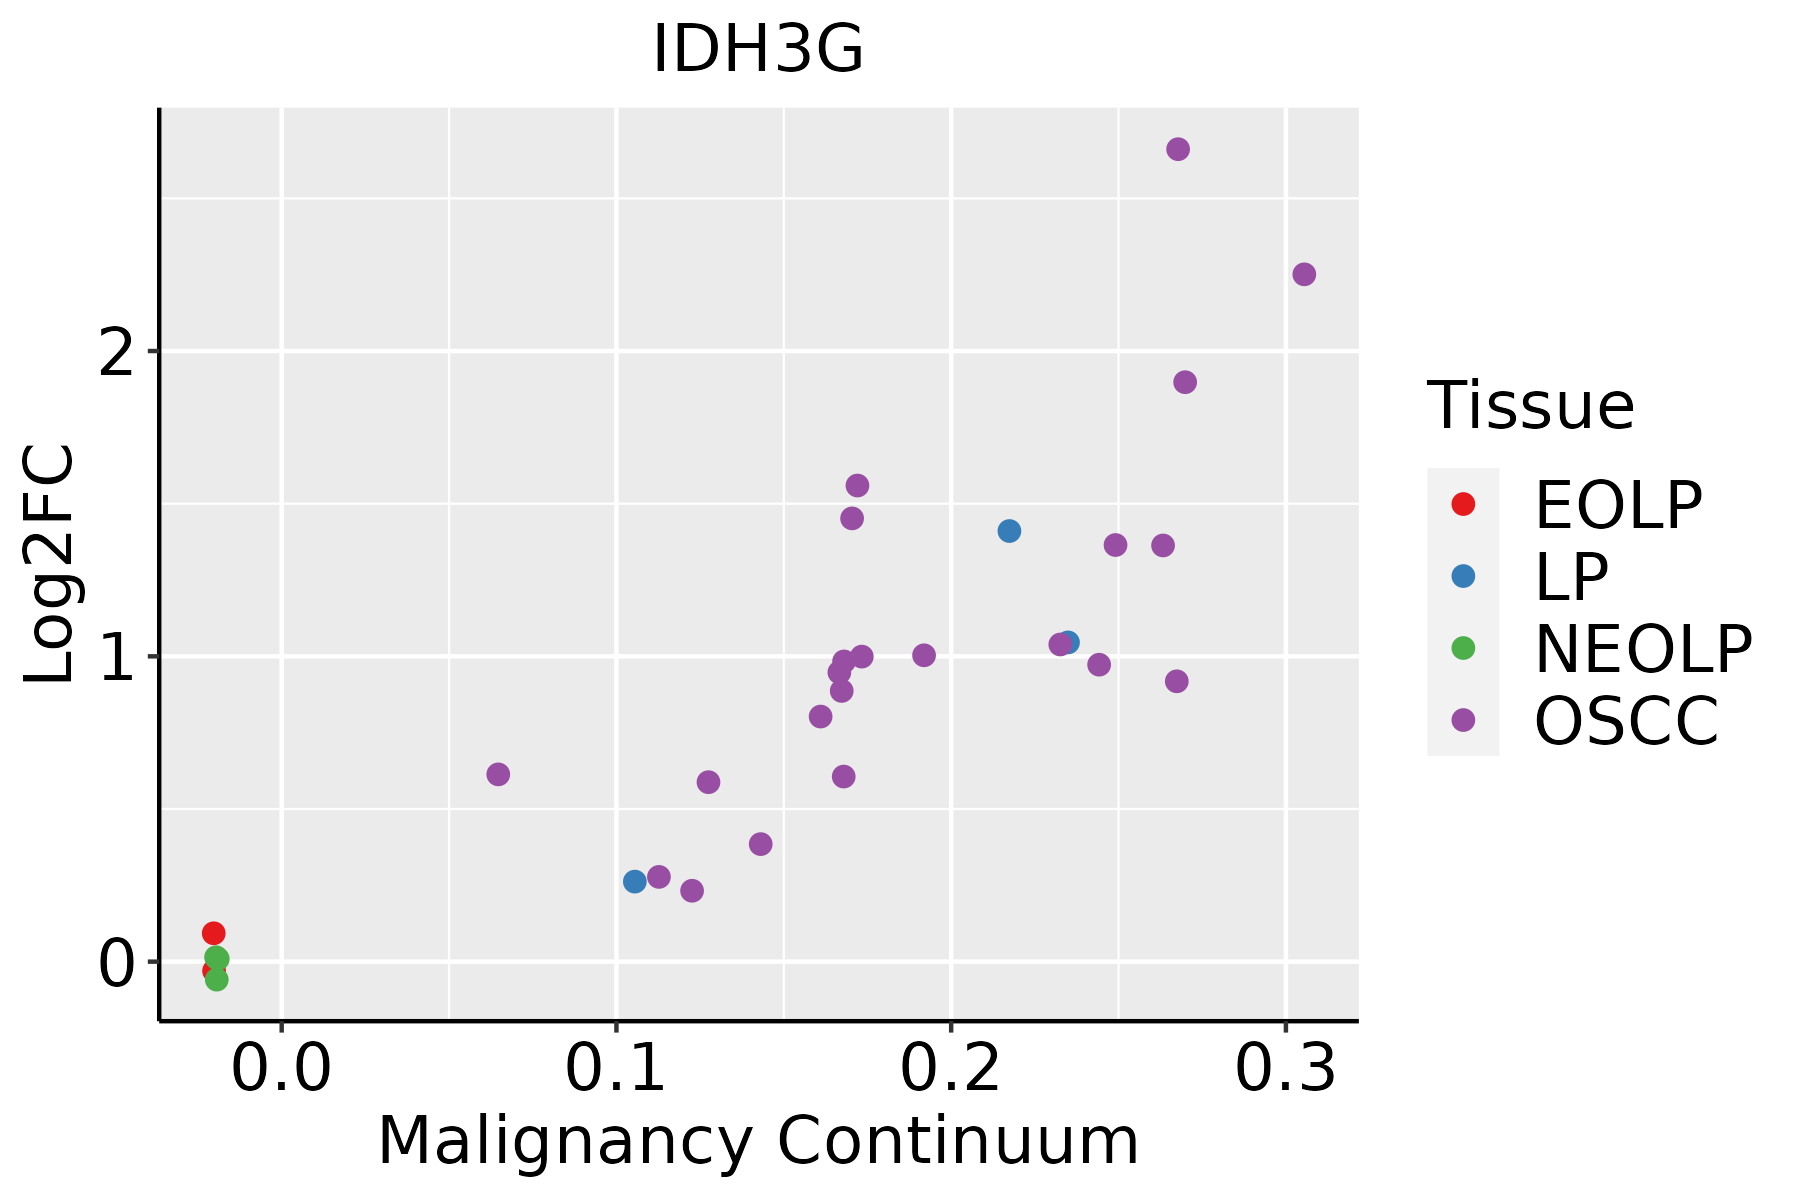 | EOLP: Erosive Oral lichen planus |
| LP: leukoplakia | ||
| NEOLP: Non-erosive oral lichen planus | ||
| OSCC: Oral squamous cell carcinoma | ||
| Skin | 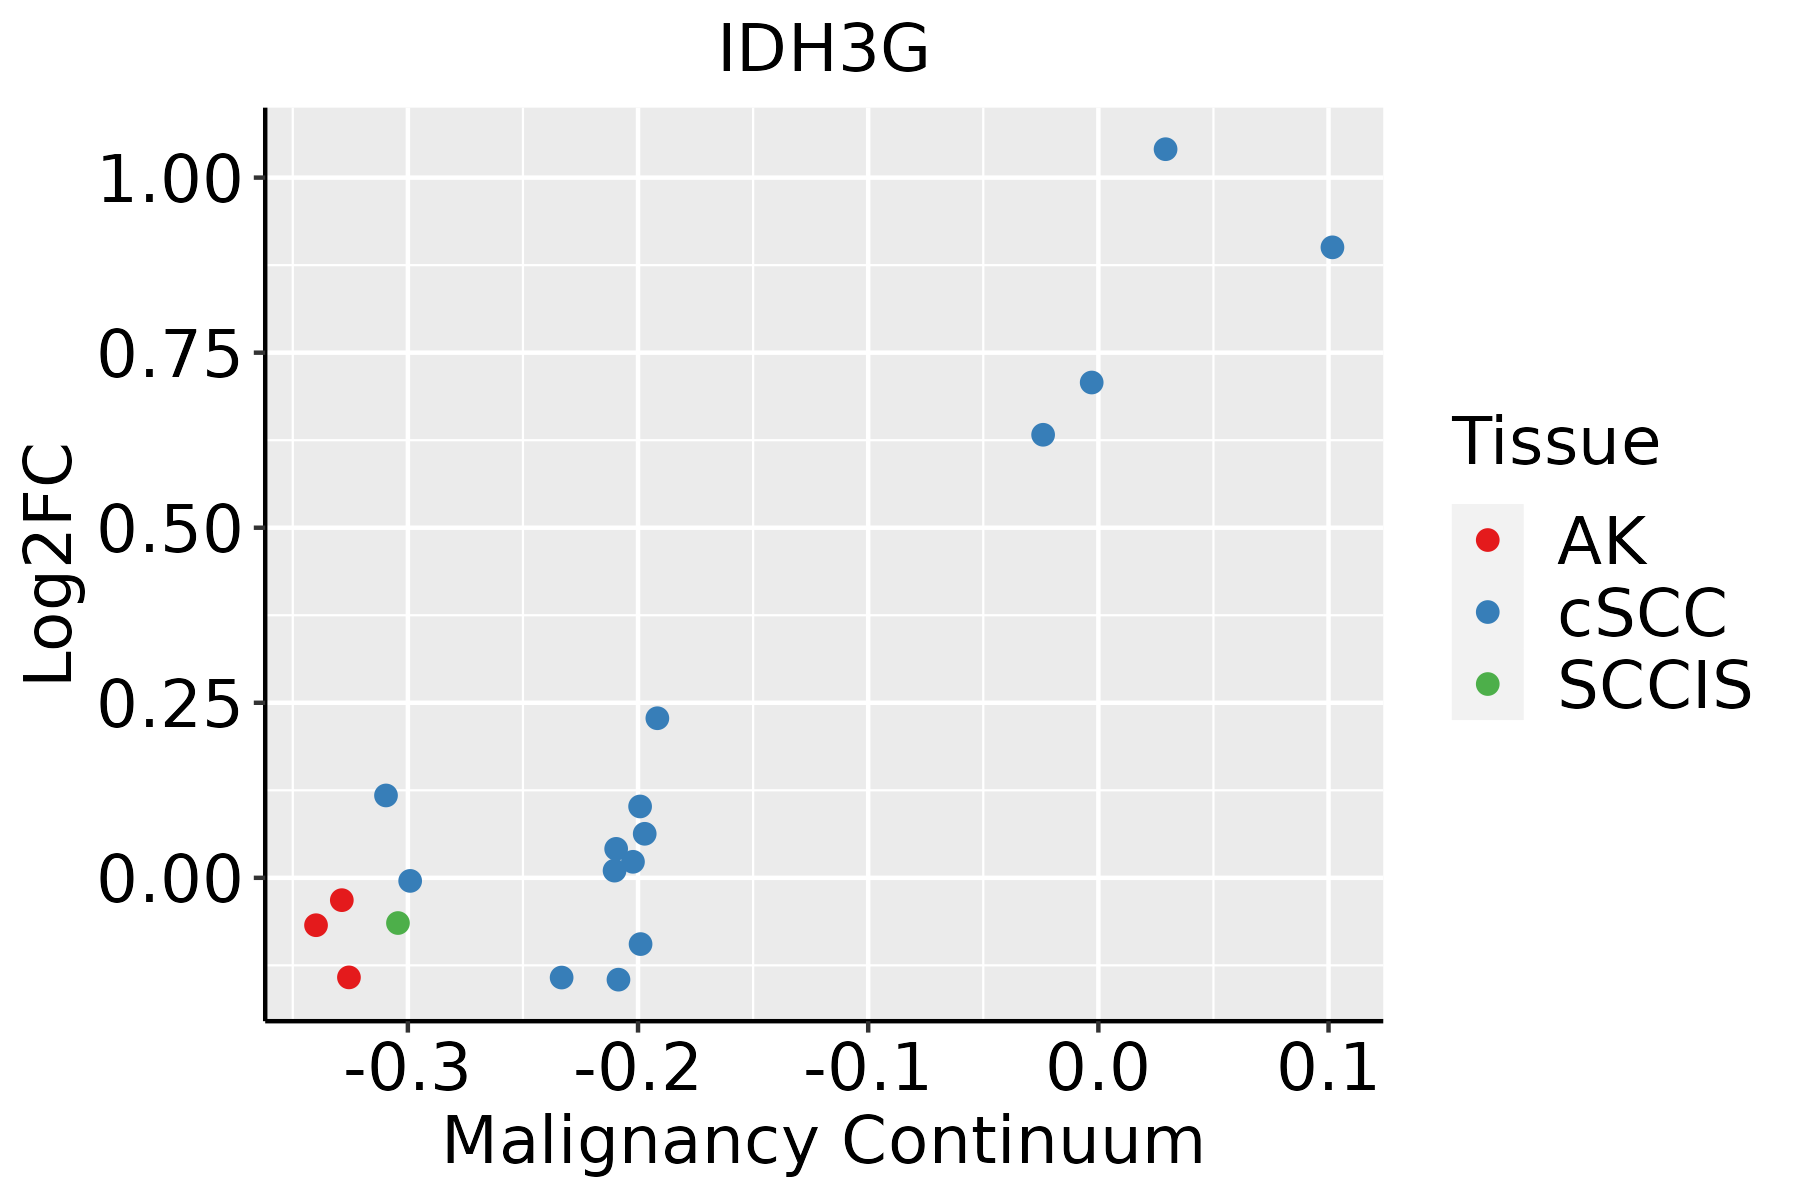 | AK: Actinic keratosis |
| cSCC: Cutaneous squamous cell carcinoma | ||
| SCCIS:squamous cell carcinoma in situ | ||
| Thyroid | 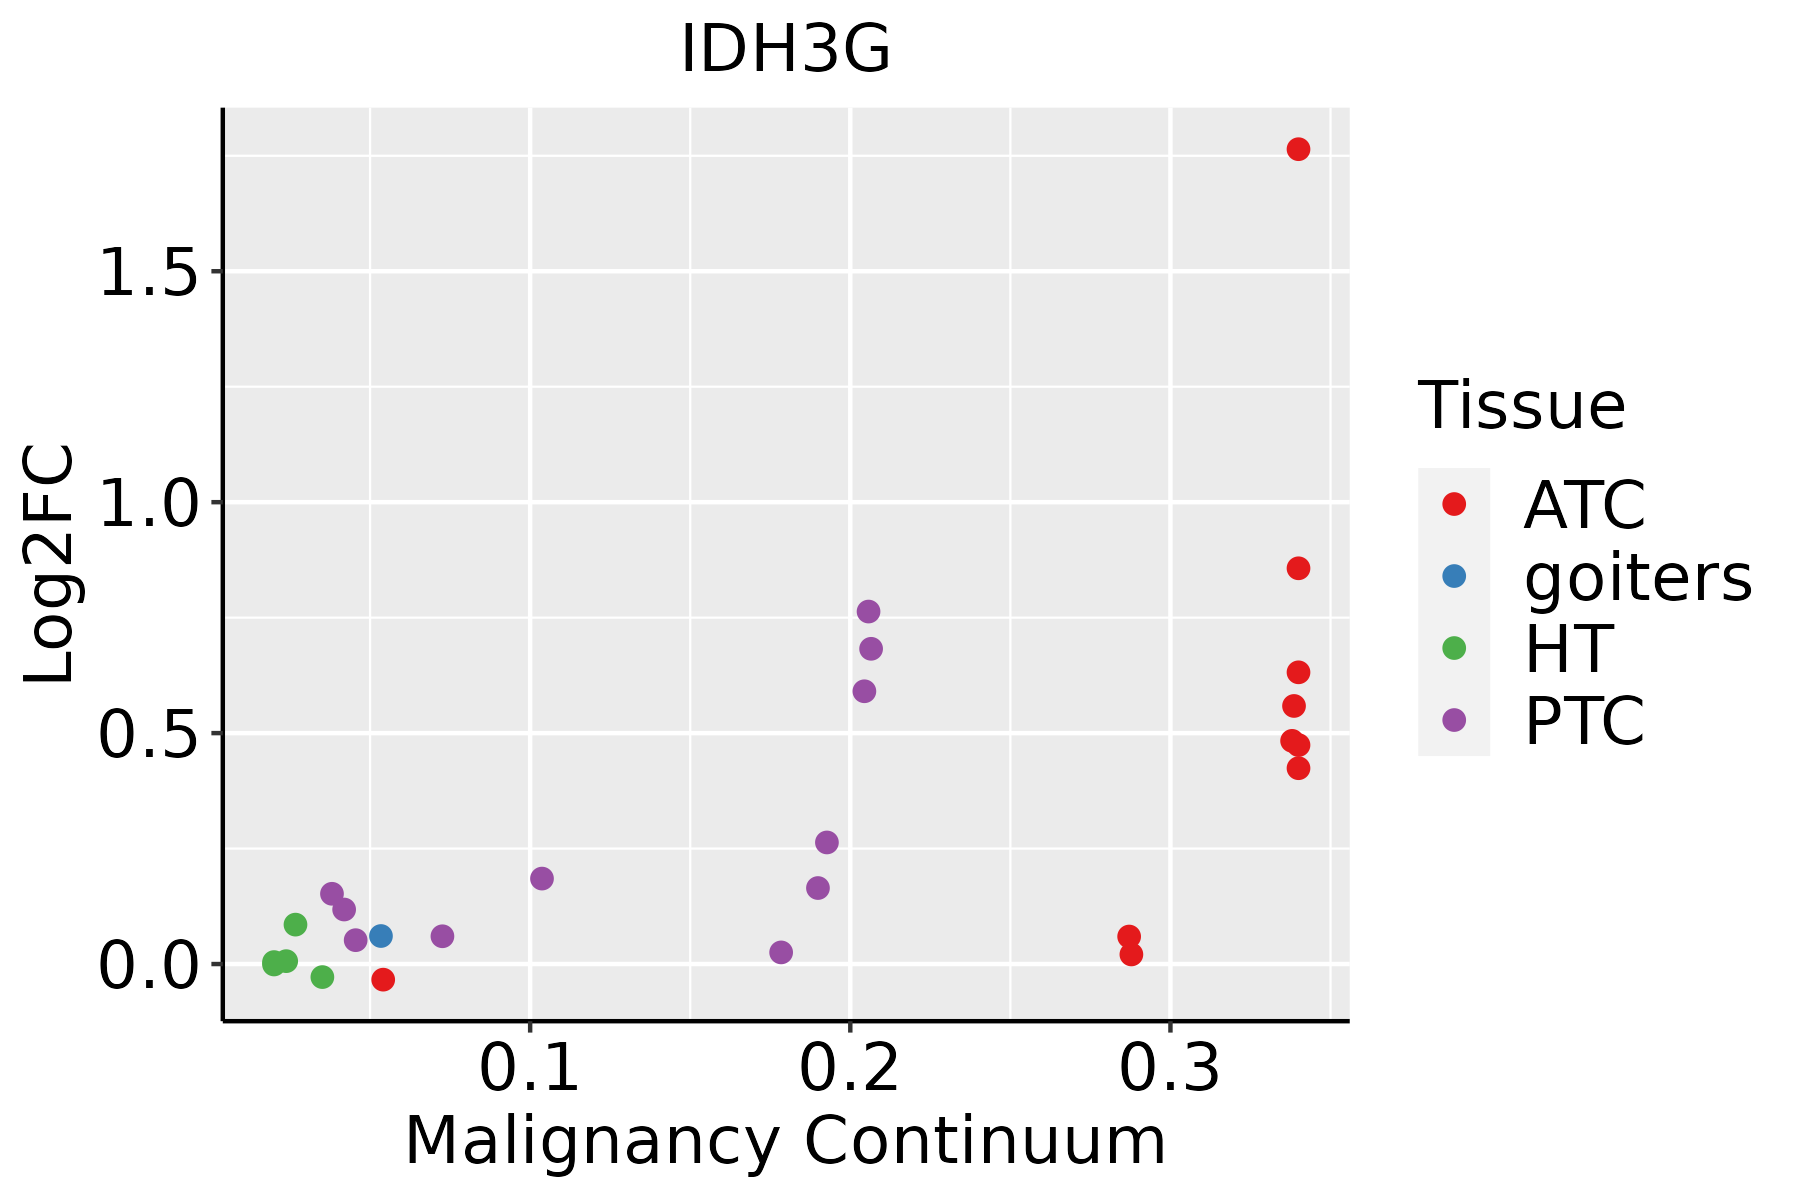 | ATC: Anaplastic thyroid cancer |
| HT: Hashimoto's thyroiditis | ||
| PTC: Papillary thyroid cancer |
| ∗log2FC in expression of this searched gene in stem-like cells from each diseased tissue sample relative to stem-like cells in normal samples in each tissue plotted against the malignancy continuum. Samples are colored based on if they are from different disease stage. |
Top |
Malignant transformation related pathway analysis |
| Find out the enriched GO biological processes and KEGG pathways involved in transition from healthy to precancer to cancer |
| Tissue | Disease Stage | Enriched GO biological Processes |
| Colorectum | AD |  |
| Colorectum | SER |  |
| Colorectum | MSS |  |
| Colorectum | MSI-H |  |
| Colorectum | FAP |  |
| ∗Top 15 enriched GO BP terms are showed in the bar plot of each disease state in each tissue. Each row represents a significant GO biological process which is colored according to the -log10(p.adjust). |
| Page: 1 2 3 4 5 6 7 8 9 |
| GO ID | Tissue | Disease Stage | Description | Gene Ratio | Bg Ratio | pvalue | p.adjust | Count |
| GO:000906020 | Esophagus | HGIN | aerobic respiration | 81/2587 | 189/18723 | 1.07e-22 | 9.26e-20 | 81 |
| GO:000609120 | Esophagus | HGIN | generation of precursor metabolites and energy | 145/2587 | 490/18723 | 3.41e-20 | 2.04e-17 | 145 |
| GO:004533320 | Esophagus | HGIN | cellular respiration | 86/2587 | 230/18723 | 2.41e-19 | 1.20e-16 | 86 |
| GO:001598020 | Esophagus | HGIN | energy derivation by oxidation of organic compounds | 105/2587 | 318/18723 | 1.16e-18 | 4.99e-16 | 105 |
| GO:0006091110 | Esophagus | ESCC | generation of precursor metabolites and energy | 331/8552 | 490/18723 | 3.86e-23 | 8.45e-21 | 331 |
| GO:0045333110 | Esophagus | ESCC | cellular respiration | 173/8552 | 230/18723 | 4.53e-20 | 5.99e-18 | 173 |
| GO:0009060110 | Esophagus | ESCC | aerobic respiration | 145/8552 | 189/18723 | 2.16e-18 | 2.21e-16 | 145 |
| GO:0015980110 | Esophagus | ESCC | energy derivation by oxidation of organic compounds | 220/8552 | 318/18723 | 1.20e-17 | 1.09e-15 | 220 |
| GO:00060997 | Esophagus | ESCC | tricarboxylic acid cycle | 27/8552 | 30/18723 | 4.54e-07 | 6.15e-06 | 27 |
| GO:00060668 | Esophagus | ESCC | alcohol metabolic process | 202/8552 | 353/18723 | 7.32e-06 | 7.26e-05 | 202 |
| GO:19026524 | Esophagus | ESCC | secondary alcohol metabolic process | 87/8552 | 147/18723 | 6.58e-04 | 3.50e-03 | 87 |
| GO:00723503 | Esophagus | ESCC | tricarboxylic acid metabolic process | 12/8552 | 14/18723 | 2.51e-03 | 1.08e-02 | 12 |
| GO:000609112 | Liver | Cirrhotic | generation of precursor metabolites and energy | 238/4634 | 490/18723 | 6.85e-31 | 1.07e-27 | 238 |
| GO:00090607 | Liver | Cirrhotic | aerobic respiration | 109/4634 | 189/18723 | 3.88e-22 | 1.62e-19 | 109 |
| GO:00453337 | Liver | Cirrhotic | cellular respiration | 122/4634 | 230/18723 | 2.15e-20 | 6.43e-18 | 122 |
| GO:001598012 | Liver | Cirrhotic | energy derivation by oxidation of organic compounds | 154/4634 | 318/18723 | 3.11e-20 | 8.87e-18 | 154 |
| GO:19026521 | Liver | Cirrhotic | secondary alcohol metabolic process | 75/4634 | 147/18723 | 5.62e-12 | 3.91e-10 | 75 |
| GO:000606612 | Liver | Cirrhotic | alcohol metabolic process | 141/4634 | 353/18723 | 1.57e-10 | 8.03e-09 | 141 |
| GO:00060995 | Liver | Cirrhotic | tricarboxylic acid cycle | 19/4634 | 30/18723 | 8.57e-06 | 1.27e-04 | 19 |
| GO:0072350 | Liver | Cirrhotic | tricarboxylic acid metabolic process | 8/4634 | 14/18723 | 9.65e-03 | 4.35e-02 | 8 |
| Page: 1 2 3 4 |
| Pathway ID | Tissue | Disease Stage | Description | Gene Ratio | Bg Ratio | pvalue | p.adjust | qvalue | Count |
| hsa0120016 | Esophagus | HGIN | Carbon metabolism | 31/1383 | 115/8465 | 2.51e-03 | 2.10e-02 | 1.67e-02 | 31 |
| hsa012306 | Esophagus | HGIN | Biosynthesis of amino acids | 21/1383 | 75/8465 | 7.38e-03 | 4.63e-02 | 3.68e-02 | 21 |
| hsa0120017 | Esophagus | HGIN | Carbon metabolism | 31/1383 | 115/8465 | 2.51e-03 | 2.10e-02 | 1.67e-02 | 31 |
| hsa0123013 | Esophagus | HGIN | Biosynthesis of amino acids | 21/1383 | 75/8465 | 7.38e-03 | 4.63e-02 | 3.68e-02 | 21 |
| hsa0002014 | Esophagus | ESCC | Citrate cycle (TCA cycle) | 27/4205 | 30/8465 | 3.48e-06 | 1.94e-05 | 9.95e-06 | 27 |
| hsa0120023 | Esophagus | ESCC | Carbon metabolism | 79/4205 | 115/8465 | 2.50e-05 | 1.21e-04 | 6.22e-05 | 79 |
| hsa0123023 | Esophagus | ESCC | Biosynthesis of amino acids | 49/4205 | 75/8465 | 4.35e-03 | 1.12e-02 | 5.74e-03 | 49 |
| hsa0002015 | Esophagus | ESCC | Citrate cycle (TCA cycle) | 27/4205 | 30/8465 | 3.48e-06 | 1.94e-05 | 9.95e-06 | 27 |
| hsa0120033 | Esophagus | ESCC | Carbon metabolism | 79/4205 | 115/8465 | 2.50e-05 | 1.21e-04 | 6.22e-05 | 79 |
| hsa0123033 | Esophagus | ESCC | Biosynthesis of amino acids | 49/4205 | 75/8465 | 4.35e-03 | 1.12e-02 | 5.74e-03 | 49 |
| hsa0120021 | Liver | Cirrhotic | Carbon metabolism | 64/2530 | 115/8465 | 6.37e-09 | 1.18e-07 | 7.26e-08 | 64 |
| hsa0002010 | Liver | Cirrhotic | Citrate cycle (TCA cycle) | 21/2530 | 30/8465 | 6.56e-06 | 6.24e-05 | 3.84e-05 | 21 |
| hsa012304 | Liver | Cirrhotic | Biosynthesis of amino acids | 35/2530 | 75/8465 | 1.54e-03 | 7.83e-03 | 4.83e-03 | 35 |
| hsa0120031 | Liver | Cirrhotic | Carbon metabolism | 64/2530 | 115/8465 | 6.37e-09 | 1.18e-07 | 7.26e-08 | 64 |
| hsa0002011 | Liver | Cirrhotic | Citrate cycle (TCA cycle) | 21/2530 | 30/8465 | 6.56e-06 | 6.24e-05 | 3.84e-05 | 21 |
| hsa0123011 | Liver | Cirrhotic | Biosynthesis of amino acids | 35/2530 | 75/8465 | 1.54e-03 | 7.83e-03 | 4.83e-03 | 35 |
| hsa0120041 | Liver | HCC | Carbon metabolism | 89/4020 | 115/8465 | 3.92e-11 | 6.56e-10 | 3.65e-10 | 89 |
| hsa0002021 | Liver | HCC | Citrate cycle (TCA cycle) | 28/4020 | 30/8465 | 1.08e-07 | 1.44e-06 | 8.02e-07 | 28 |
| hsa0123021 | Liver | HCC | Biosynthesis of amino acids | 53/4020 | 75/8465 | 3.79e-05 | 2.11e-04 | 1.18e-04 | 53 |
| hsa0120051 | Liver | HCC | Carbon metabolism | 89/4020 | 115/8465 | 3.92e-11 | 6.56e-10 | 3.65e-10 | 89 |
| Page: 1 2 |
Top |
Cell-cell communication analysis |
| Identification of potential cell-cell interactions between two cell types and their ligand-receptor pairs for different disease states |
| Ligand | Receptor | LRpair | Pathway | Tissue | Disease Stage |
| Page: 1 |
Top |
Single-cell gene regulatory network inference analysis |
| Find out the significant the regulons (TFs) and the target genes of each regulon across cell types for different disease states |
| TF | Cell Type | Tissue | Disease Stage | Target Gene | RSS | Regulon Activity |
| ∗The dot plots of a searched regulon are shown for all cell subpopulations in each disease state of each tissue based on the regulon specific score inferred using pySCENIC and by calculating the average expression. |
| Page: 1 |
Top |
Somatic mutation of malignant transformation related genes |
| Annotation of somatic variants for genes involved in malignant transformation |
| Hugo Symbol | Variant Class | Variant Classification | dbSNP RS | HGVSc | HGVSp | HGVSp Short | SWISSPROT | BIOTYPE | SIFT | PolyPhen | Tumor Sample Barcode | Tissue | Histology | Sex | Age | Stage | Therapy Types | Drugs | Outcome |
| IDH3G | SNV | Missense_Mutation | novel | c.212N>C | p.Leu71Pro | p.L71P | P51553 | protein_coding | tolerated(0.25) | possibly_damaging(0.773) | TCGA-A2-A0D1-01 | Breast | breast invasive carcinoma | Female | >=65 | I/II | Chemotherapy | taxotere | SD |
| IDH3G | SNV | Missense_Mutation | novel | c.1151N>A | p.Arg384His | p.R384H | P51553 | protein_coding | tolerated(0.07) | benign(0.226) | TCGA-2W-A8YY-01 | Cervix | cervical & endocervical cancer | Female | <65 | I/II | Chemotherapy | cisplatin | CR |
| IDH3G | SNV | Missense_Mutation | c.1064C>T | p.Ser355Phe | p.S355F | P51553 | protein_coding | deleterious(0.01) | possibly_damaging(0.877) | TCGA-EK-A3GK-01 | Cervix | cervical & endocervical cancer | Female | <65 | I/II | Unknown | Unknown | SD | |
| IDH3G | SNV | Missense_Mutation | rs782789248 | c.623N>T | p.Ala208Val | p.A208V | P51553 | protein_coding | deleterious(0) | possibly_damaging(0.783) | TCGA-AA-3877-01 | Colorectum | colon adenocarcinoma | Female | >=65 | I/II | Unknown | Unknown | SD |
| IDH3G | SNV | Missense_Mutation | rs782820935 | c.854N>T | p.Ala285Val | p.A285V | P51553 | protein_coding | deleterious(0.02) | possibly_damaging(0.511) | TCGA-AA-3947-01 | Colorectum | colon adenocarcinoma | Female | <65 | I/II | Unknown | Unknown | SD |
| IDH3G | SNV | Missense_Mutation | rs782528848 | c.406N>T | p.Arg136Cys | p.R136C | P51553 | protein_coding | deleterious(0.01) | probably_damaging(0.996) | TCGA-AA-3984-01 | Colorectum | colon adenocarcinoma | Female | <65 | I/II | Unknown | Unknown | SD |
| IDH3G | SNV | Missense_Mutation | novel | c.334N>A | p.Val112Met | p.V112M | P51553 | protein_coding | deleterious(0) | probably_damaging(0.995) | TCGA-AA-A010-01 | Colorectum | colon adenocarcinoma | Female | <65 | I/II | Chemotherapy | folinic | CR |
| IDH3G | SNV | Missense_Mutation | rs782671638 | c.650N>T | p.Thr217Met | p.T217M | P51553 | protein_coding | deleterious(0.02) | probably_damaging(0.998) | TCGA-AM-5821-01 | Colorectum | colon adenocarcinoma | Female | >=65 | I/II | Unknown | Unknown | SD |
| IDH3G | SNV | Missense_Mutation | novel | c.735G>T | p.Gln245His | p.Q245H | P51553 | protein_coding | tolerated(0.12) | benign(0.003) | TCGA-CA-6717-01 | Colorectum | colon adenocarcinoma | Male | <65 | I/II | Chemotherapy | oxaliplatin | CR |
| IDH3G | SNV | Missense_Mutation | c.499C>T | p.Arg167Trp | p.R167W | P51553 | protein_coding | deleterious(0.01) | probably_damaging(1) | TCGA-F4-6570-01 | Colorectum | colon adenocarcinoma | Female | >=65 | I/II | Unknown | Unknown | SD |
| Page: 1 2 3 4 5 6 |
Top |
Related drugs of malignant transformation related genes |
| Identification of chemicals and drugs interact with genes involved in malignant transfromation |
| (DGIdb 4.0) |
| Entrez ID | Symbol | Category | Interaction Types | Drug Claim Name | Drug Name | PMIDs |
| Page: 1 |

Copyright 2023-Present -The University of Texas Health Science Center at Houston |