
|
|||||
|
 | |
| |
| |
| |
| |
| |
|
Gene: IDH3B |
Gene summary for IDH3B |
| Gene information | Species | Human | Gene symbol | IDH3B | Gene ID | 3420 |
| Gene name | isocitrate dehydrogenase (NAD(+)) 3 non-catalytic subunit beta | |
| Gene Alias | RP46 | |
| Cytomap | 20p13 | |
| Gene Type | protein-coding | GO ID | GO:0006066 | UniProtAcc | A0A087X2E5 |
Top |
Malignant transformation analysis |
| Identification of the aberrant gene expression in precancerous and cancerous lesions by comparing the gene expression of stem-like cells in diseased tissues with normal stem cells |
| Entrez ID | Symbol | Replicates | Species | Organ | Tissue | Adj P-value | Log2FC | Malignancy |
| 3420 | IDH3B | HTA11_2487_2000001011 | Human | Colorectum | SER | 4.32e-09 | 3.77e-01 | -0.1808 |
| 3420 | IDH3B | HTA11_1938_2000001011 | Human | Colorectum | AD | 5.22e-15 | 5.15e-01 | -0.0811 |
| 3420 | IDH3B | HTA11_78_2000001011 | Human | Colorectum | AD | 1.77e-10 | 3.50e-01 | -0.1088 |
| 3420 | IDH3B | HTA11_347_2000001011 | Human | Colorectum | AD | 7.25e-19 | 4.16e-01 | -0.1954 |
| 3420 | IDH3B | HTA11_411_2000001011 | Human | Colorectum | SER | 1.34e-04 | 5.53e-01 | -0.2602 |
| 3420 | IDH3B | HTA11_3361_2000001011 | Human | Colorectum | AD | 1.16e-07 | 3.42e-01 | -0.1207 |
| 3420 | IDH3B | HTA11_83_2000001011 | Human | Colorectum | SER | 6.91e-04 | 2.87e-01 | -0.1526 |
| 3420 | IDH3B | HTA11_696_2000001011 | Human | Colorectum | AD | 8.53e-14 | 4.38e-01 | -0.1464 |
| 3420 | IDH3B | HTA11_1391_2000001011 | Human | Colorectum | AD | 1.08e-18 | 5.45e-01 | -0.059 |
| 3420 | IDH3B | HTA11_7862_2000001011 | Human | Colorectum | AD | 2.97e-08 | 4.50e-01 | -0.0179 |
| 3420 | IDH3B | HTA11_866_3004761011 | Human | Colorectum | AD | 8.81e-16 | 4.25e-01 | 0.096 |
| 3420 | IDH3B | HTA11_8622_2000001021 | Human | Colorectum | SER | 1.94e-10 | 5.78e-01 | 0.0528 |
| 3420 | IDH3B | HTA11_7663_2000001011 | Human | Colorectum | SER | 2.21e-04 | 4.06e-01 | 0.0131 |
| 3420 | IDH3B | HTA11_10623_2000001011 | Human | Colorectum | AD | 2.82e-06 | 4.22e-01 | -0.0177 |
| 3420 | IDH3B | HTA11_6801_2000001011 | Human | Colorectum | SER | 1.81e-07 | 7.33e-01 | 0.0171 |
| 3420 | IDH3B | HTA11_10711_2000001011 | Human | Colorectum | AD | 3.55e-06 | 2.81e-01 | 0.0338 |
| 3420 | IDH3B | HTA11_7696_3000711011 | Human | Colorectum | AD | 6.32e-13 | 4.41e-01 | 0.0674 |
| 3420 | IDH3B | HTA11_7469_2000001011 | Human | Colorectum | AD | 4.23e-03 | 4.83e-01 | -0.0124 |
| 3420 | IDH3B | HTA11_99999970781_79442 | Human | Colorectum | MSS | 8.73e-15 | 4.44e-01 | 0.294 |
| 3420 | IDH3B | HTA11_99999965104_69814 | Human | Colorectum | MSS | 1.78e-18 | 5.50e-01 | 0.281 |
| Page: 1 2 3 4 5 6 7 8 |
| Tissue | Expression Dynamics | Abbreviation |
| Colorectum (GSE201348) |  | FAP: Familial adenomatous polyposis |
| CRC: Colorectal cancer | ||
| Colorectum (HTA11) |  | AD: Adenomas |
| SER: Sessile serrated lesions | ||
| MSI-H: Microsatellite-high colorectal cancer | ||
| MSS: Microsatellite stable colorectal cancer | ||
| Esophagus |  | ESCC: Esophageal squamous cell carcinoma |
| HGIN: High-grade intraepithelial neoplasias | ||
| LGIN: Low-grade intraepithelial neoplasias | ||
| Liver | 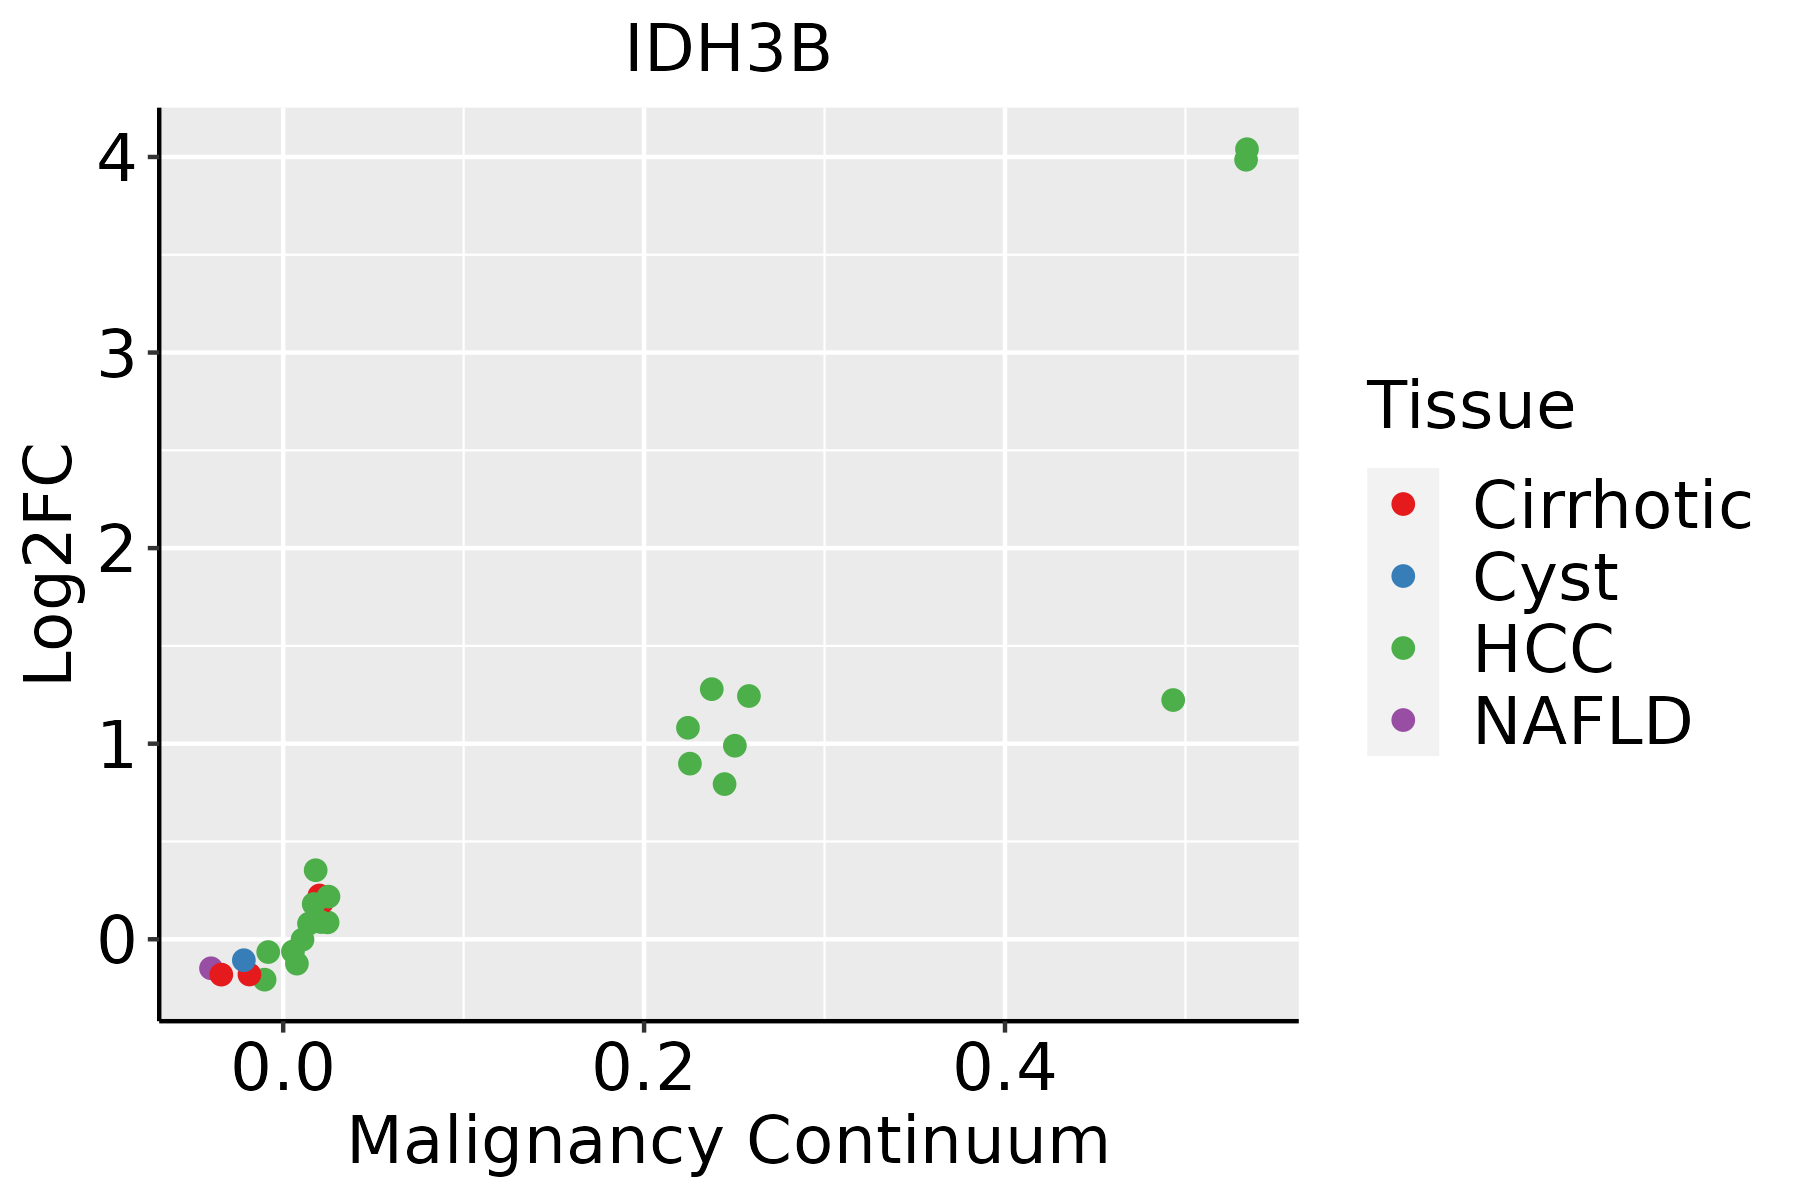 | HCC: Hepatocellular carcinoma |
| NAFLD: Non-alcoholic fatty liver disease | ||
| Oral Cavity |  | EOLP: Erosive Oral lichen planus |
| LP: leukoplakia | ||
| NEOLP: Non-erosive oral lichen planus | ||
| OSCC: Oral squamous cell carcinoma | ||
| Skin | 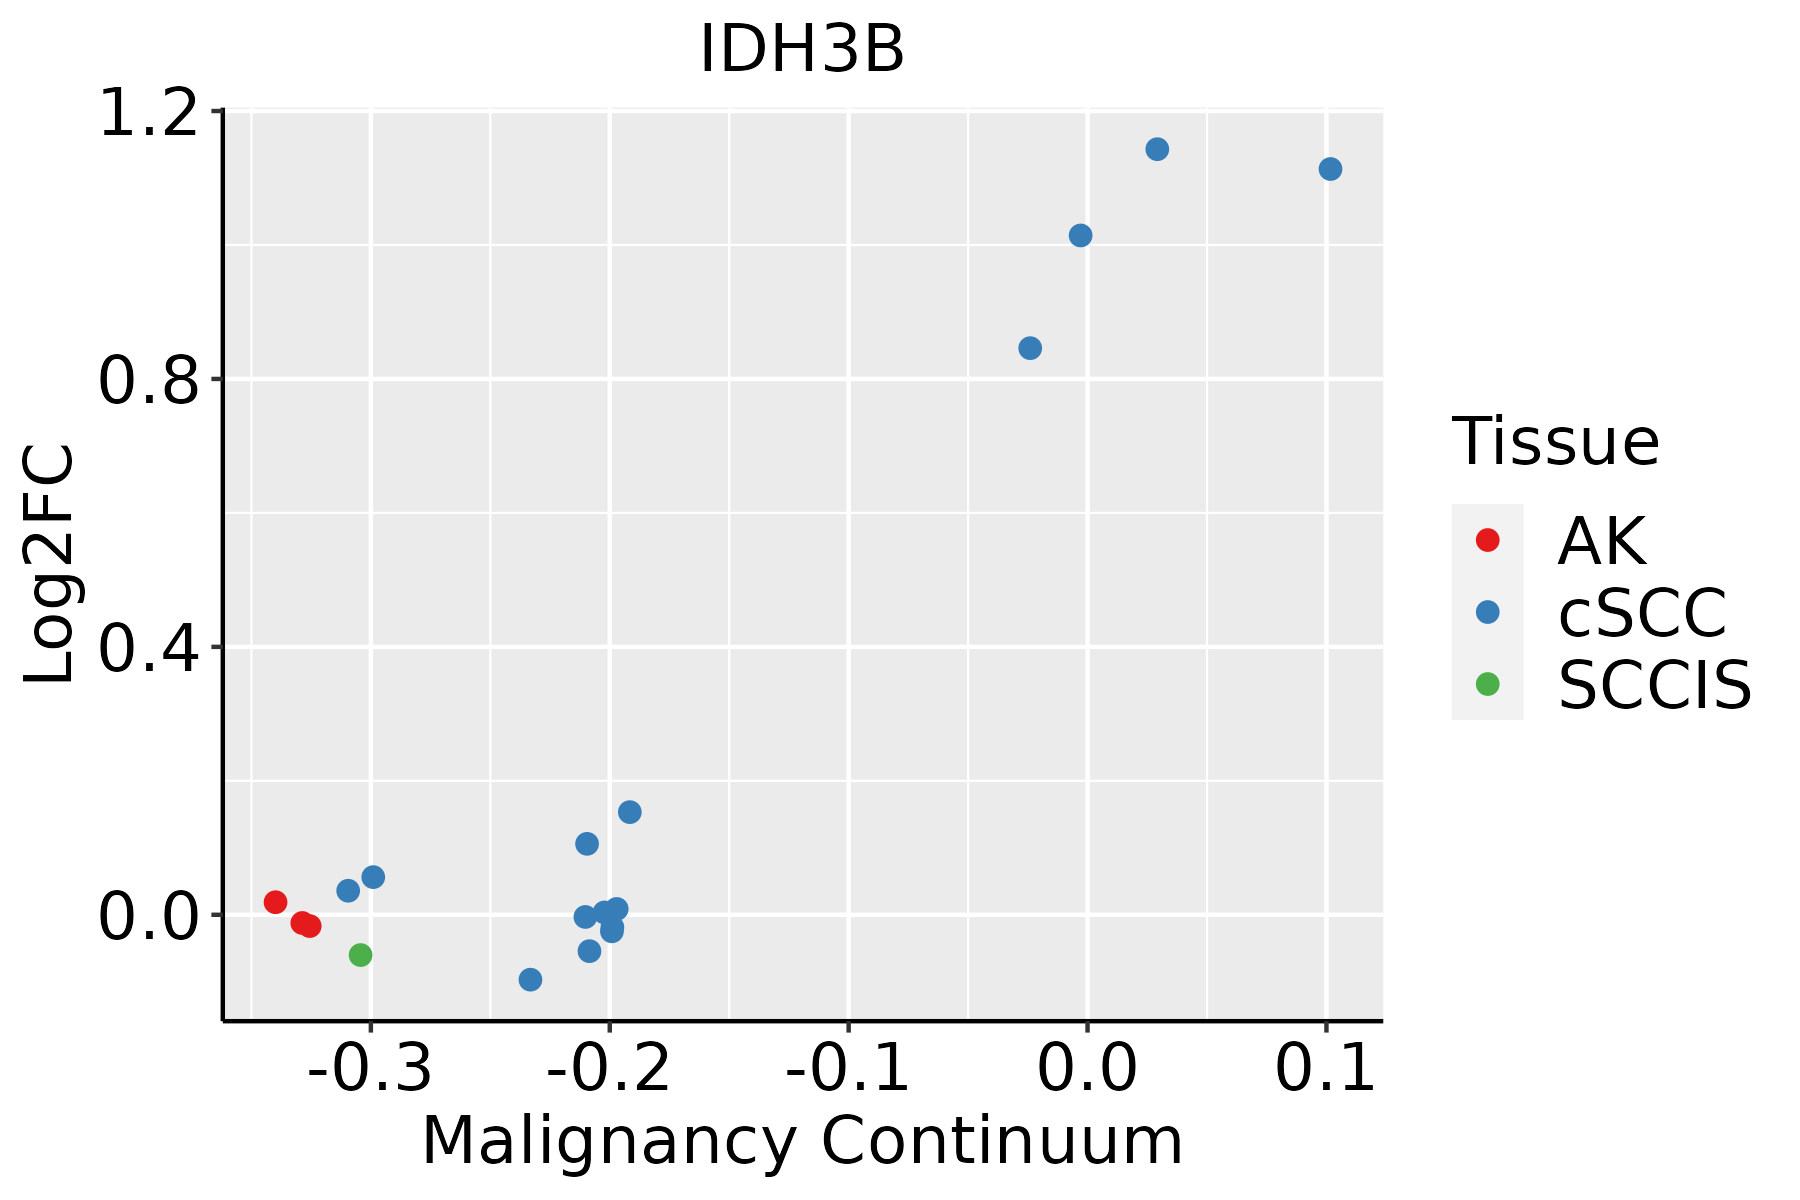 | AK: Actinic keratosis |
| cSCC: Cutaneous squamous cell carcinoma | ||
| SCCIS:squamous cell carcinoma in situ | ||
| Thyroid |  | ATC: Anaplastic thyroid cancer |
| HT: Hashimoto's thyroiditis | ||
| PTC: Papillary thyroid cancer |
| ∗log2FC in expression of this searched gene in stem-like cells from each diseased tissue sample relative to stem-like cells in normal samples in each tissue plotted against the malignancy continuum. Samples are colored based on if they are from different disease stage. |
Top |
Malignant transformation related pathway analysis |
| Find out the enriched GO biological processes and KEGG pathways involved in transition from healthy to precancer to cancer |
| Tissue | Disease Stage | Enriched GO biological Processes |
| Colorectum | AD |  |
| Colorectum | SER |  |
| Colorectum | MSS |  |
| Colorectum | MSI-H |  |
| Colorectum | FAP |  |
| ∗Top 15 enriched GO BP terms are showed in the bar plot of each disease state in each tissue. Each row represents a significant GO biological process which is colored according to the -log10(p.adjust). |
| Page: 1 2 3 4 5 6 7 8 9 |
| GO ID | Tissue | Disease Stage | Description | Gene Ratio | Bg Ratio | pvalue | p.adjust | Count |
| GO:0006091 | Colorectum | AD | generation of precursor metabolites and energy | 209/3918 | 490/18723 | 3.17e-28 | 6.61e-25 | 209 |
| GO:0009060 | Colorectum | AD | aerobic respiration | 108/3918 | 189/18723 | 9.14e-28 | 1.43e-24 | 108 |
| GO:0045333 | Colorectum | AD | cellular respiration | 119/3918 | 230/18723 | 3.21e-25 | 4.02e-22 | 119 |
| GO:0015980 | Colorectum | AD | energy derivation by oxidation of organic compounds | 143/3918 | 318/18723 | 2.78e-22 | 2.49e-19 | 143 |
| GO:0022900 | Colorectum | AD | electron transport chain | 89/3918 | 175/18723 | 1.42e-18 | 8.91e-16 | 89 |
| GO:0006099 | Colorectum | AD | tricarboxylic acid cycle | 19/3918 | 30/18723 | 5.82e-07 | 2.09e-05 | 19 |
| GO:0006066 | Colorectum | AD | alcohol metabolic process | 106/3918 | 353/18723 | 3.02e-05 | 5.57e-04 | 106 |
| GO:0006734 | Colorectum | AD | NADH metabolic process | 16/3918 | 29/18723 | 5.32e-05 | 9.01e-04 | 16 |
| GO:0043648 | Colorectum | AD | dicarboxylic acid metabolic process | 34/3918 | 96/18723 | 7.22e-04 | 7.28e-03 | 34 |
| GO:00090601 | Colorectum | SER | aerobic respiration | 96/2897 | 189/18723 | 5.53e-30 | 1.70e-26 | 96 |
| GO:00453331 | Colorectum | SER | cellular respiration | 103/2897 | 230/18723 | 2.35e-26 | 3.61e-23 | 103 |
| GO:00060911 | Colorectum | SER | generation of precursor metabolites and energy | 168/2897 | 490/18723 | 1.39e-25 | 1.70e-22 | 168 |
| GO:00159801 | Colorectum | SER | energy derivation by oxidation of organic compounds | 119/2897 | 318/18723 | 5.28e-22 | 4.62e-19 | 119 |
| GO:00229001 | Colorectum | SER | electron transport chain | 77/2897 | 175/18723 | 1.77e-19 | 1.36e-16 | 77 |
| GO:00060991 | Colorectum | SER | tricarboxylic acid cycle | 15/2897 | 30/18723 | 1.02e-05 | 3.34e-04 | 15 |
| GO:00060661 | Colorectum | SER | alcohol metabolic process | 79/2897 | 353/18723 | 3.50e-04 | 5.50e-03 | 79 |
| GO:00067341 | Colorectum | SER | NADH metabolic process | 12/2897 | 29/18723 | 7.22e-04 | 9.44e-03 | 12 |
| GO:00090602 | Colorectum | MSS | aerobic respiration | 98/3467 | 189/18723 | 3.35e-25 | 1.05e-21 | 98 |
| GO:00060912 | Colorectum | MSS | generation of precursor metabolites and energy | 186/3467 | 490/18723 | 1.14e-24 | 2.15e-21 | 186 |
| GO:00453332 | Colorectum | MSS | cellular respiration | 107/3467 | 230/18723 | 1.64e-22 | 2.05e-19 | 107 |
| Page: 1 2 3 4 5 |
| Pathway ID | Tissue | Disease Stage | Description | Gene Ratio | Bg Ratio | pvalue | p.adjust | qvalue | Count |
| hsa01200 | Colorectum | AD | Carbon metabolism | 55/2092 | 115/8465 | 5.53e-08 | 8.42e-07 | 5.37e-07 | 55 |
| hsa00020 | Colorectum | AD | Citrate cycle (TCA cycle) | 20/2092 | 30/8465 | 1.43e-06 | 1.77e-05 | 1.13e-05 | 20 |
| hsa01230 | Colorectum | AD | Biosynthesis of amino acids | 28/2092 | 75/8465 | 9.99e-03 | 3.89e-02 | 2.48e-02 | 28 |
| hsa012001 | Colorectum | AD | Carbon metabolism | 55/2092 | 115/8465 | 5.53e-08 | 8.42e-07 | 5.37e-07 | 55 |
| hsa000201 | Colorectum | AD | Citrate cycle (TCA cycle) | 20/2092 | 30/8465 | 1.43e-06 | 1.77e-05 | 1.13e-05 | 20 |
| hsa012301 | Colorectum | AD | Biosynthesis of amino acids | 28/2092 | 75/8465 | 9.99e-03 | 3.89e-02 | 2.48e-02 | 28 |
| hsa000202 | Colorectum | SER | Citrate cycle (TCA cycle) | 16/1580 | 30/8465 | 2.06e-05 | 2.74e-04 | 1.99e-04 | 16 |
| hsa012002 | Colorectum | SER | Carbon metabolism | 40/1580 | 115/8465 | 2.77e-05 | 3.41e-04 | 2.47e-04 | 40 |
| hsa012302 | Colorectum | SER | Biosynthesis of amino acids | 23/1580 | 75/8465 | 8.11e-03 | 4.14e-02 | 3.01e-02 | 23 |
| hsa000203 | Colorectum | SER | Citrate cycle (TCA cycle) | 16/1580 | 30/8465 | 2.06e-05 | 2.74e-04 | 1.99e-04 | 16 |
| hsa012003 | Colorectum | SER | Carbon metabolism | 40/1580 | 115/8465 | 2.77e-05 | 3.41e-04 | 2.47e-04 | 40 |
| hsa012303 | Colorectum | SER | Biosynthesis of amino acids | 23/1580 | 75/8465 | 8.11e-03 | 4.14e-02 | 3.01e-02 | 23 |
| hsa012004 | Colorectum | MSS | Carbon metabolism | 43/1875 | 115/8465 | 1.37e-04 | 1.17e-03 | 7.19e-04 | 43 |
| hsa000204 | Colorectum | MSS | Citrate cycle (TCA cycle) | 16/1875 | 30/8465 | 1.84e-04 | 1.47e-03 | 9.00e-04 | 16 |
| hsa012005 | Colorectum | MSS | Carbon metabolism | 43/1875 | 115/8465 | 1.37e-04 | 1.17e-03 | 7.19e-04 | 43 |
| hsa000205 | Colorectum | MSS | Citrate cycle (TCA cycle) | 16/1875 | 30/8465 | 1.84e-04 | 1.47e-03 | 9.00e-04 | 16 |
| hsa0002014 | Esophagus | ESCC | Citrate cycle (TCA cycle) | 27/4205 | 30/8465 | 3.48e-06 | 1.94e-05 | 9.95e-06 | 27 |
| hsa0120023 | Esophagus | ESCC | Carbon metabolism | 79/4205 | 115/8465 | 2.50e-05 | 1.21e-04 | 6.22e-05 | 79 |
| hsa0123023 | Esophagus | ESCC | Biosynthesis of amino acids | 49/4205 | 75/8465 | 4.35e-03 | 1.12e-02 | 5.74e-03 | 49 |
| hsa0002015 | Esophagus | ESCC | Citrate cycle (TCA cycle) | 27/4205 | 30/8465 | 3.48e-06 | 1.94e-05 | 9.95e-06 | 27 |
| Page: 1 2 3 |
Top |
Cell-cell communication analysis |
| Identification of potential cell-cell interactions between two cell types and their ligand-receptor pairs for different disease states |
| Ligand | Receptor | LRpair | Pathway | Tissue | Disease Stage |
| Page: 1 |
Top |
Single-cell gene regulatory network inference analysis |
| Find out the significant the regulons (TFs) and the target genes of each regulon across cell types for different disease states |
| TF | Cell Type | Tissue | Disease Stage | Target Gene | RSS | Regulon Activity |
| ∗The dot plots of a searched regulon are shown for all cell subpopulations in each disease state of each tissue based on the regulon specific score inferred using pySCENIC and by calculating the average expression. |
| Page: 1 |
Top |
Somatic mutation of malignant transformation related genes |
| Annotation of somatic variants for genes involved in malignant transformation |
| Hugo Symbol | Variant Class | Variant Classification | dbSNP RS | HGVSc | HGVSp | HGVSp Short | SWISSPROT | BIOTYPE | SIFT | PolyPhen | Tumor Sample Barcode | Tissue | Histology | Sex | Age | Stage | Therapy Types | Drugs | Outcome |
| IDH3B | SNV | Missense_Mutation | novel | c.46T>A | p.Ser16Thr | p.S16T | protein_coding | tolerated(0.51) | benign(0.012) | TCGA-A8-A08P-01 | Breast | breast invasive carcinoma | Female | >=65 | III/IV | Chemotherapy | 5-fluorouracil | CR | |
| IDH3B | SNV | Missense_Mutation | c.175N>T | p.Val59Leu | p.V59L | protein_coding | deleterious(0) | possibly_damaging(0.902) | TCGA-C8-A1HJ-01 | Breast | breast invasive carcinoma | Female | <65 | I/II | Unknown | Unknown | SD | ||
| IDH3B | SNV | Missense_Mutation | novel | c.947G>A | p.Gly316Asp | p.G316D | protein_coding | deleterious(0.03) | probably_damaging(0.969) | TCGA-D8-A1J8-01 | Breast | breast invasive carcinoma | Female | >=65 | I/II | Hormone Therapy | nolvadex | SD | |
| IDH3B | SNV | Missense_Mutation | c.1003C>G | p.His335Asp | p.H335D | protein_coding | deleterious(0) | benign(0.444) | TCGA-E2-A1IN-01 | Breast | breast invasive carcinoma | Female | <65 | I/II | Hormone Therapy | arimidex | SD | ||
| IDH3B | SNV | Missense_Mutation | rs760302966 | c.107N>T | p.Ser36Leu | p.S36L | protein_coding | tolerated(0.63) | benign(0.001) | TCGA-EK-A2PM-01 | Cervix | cervical & endocervical cancer | Female | >=65 | I/II | Unknown | Unknown | SD | |
| IDH3B | SNV | Missense_Mutation | rs374080382 | c.1154C>T | p.Ser385Leu | p.S385L | protein_coding | deleterious_low_confidence(0.03) | benign(0.003) | TCGA-AA-A00N-01 | Colorectum | colon adenocarcinoma | Male | >=65 | I/II | Unknown | Unknown | PD | |
| IDH3B | SNV | Missense_Mutation | rs764236244 | c.380N>T | p.Ser127Phe | p.S127F | protein_coding | deleterious(0) | probably_damaging(0.919) | TCGA-AD-6895-01 | Colorectum | colon adenocarcinoma | Male | >=65 | III/IV | Unknown | Unknown | SD | |
| IDH3B | SNV | Missense_Mutation | novel | c.181N>T | p.Pro61Ser | p.P61S | protein_coding | deleterious(0.03) | possibly_damaging(0.652) | TCGA-A5-A0G2-01 | Endometrium | uterine corpus endometrioid carcinoma | Female | <65 | III/IV | Unknown | Unknown | SD | |
| IDH3B | SNV | Missense_Mutation | c.950N>A | p.Arg317Lys | p.R317K | protein_coding | tolerated(1) | benign(0.065) | TCGA-AX-A064-01 | Endometrium | uterine corpus endometrioid carcinoma | Female | >=65 | I/II | Unknown | Unknown | SD | ||
| IDH3B | SNV | Missense_Mutation | rs770148916 | c.196N>A | p.Ala66Thr | p.A66T | protein_coding | tolerated(0.15) | benign(0.202) | TCGA-AX-A2HD-01 | Endometrium | uterine corpus endometrioid carcinoma | Female | >=65 | III/IV | Unknown | Unknown | SD |
| Page: 1 2 3 |
Top |
Related drugs of malignant transformation related genes |
| Identification of chemicals and drugs interact with genes involved in malignant transfromation |
| (DGIdb 4.0) |
| Entrez ID | Symbol | Category | Interaction Types | Drug Claim Name | Drug Name | PMIDs |
| Page: 1 |

Copyright 2023-Present -The University of Texas Health Science Center at Houston |