| Tissue | Expression Dynamics | Abbreviation |
| Esophagus | 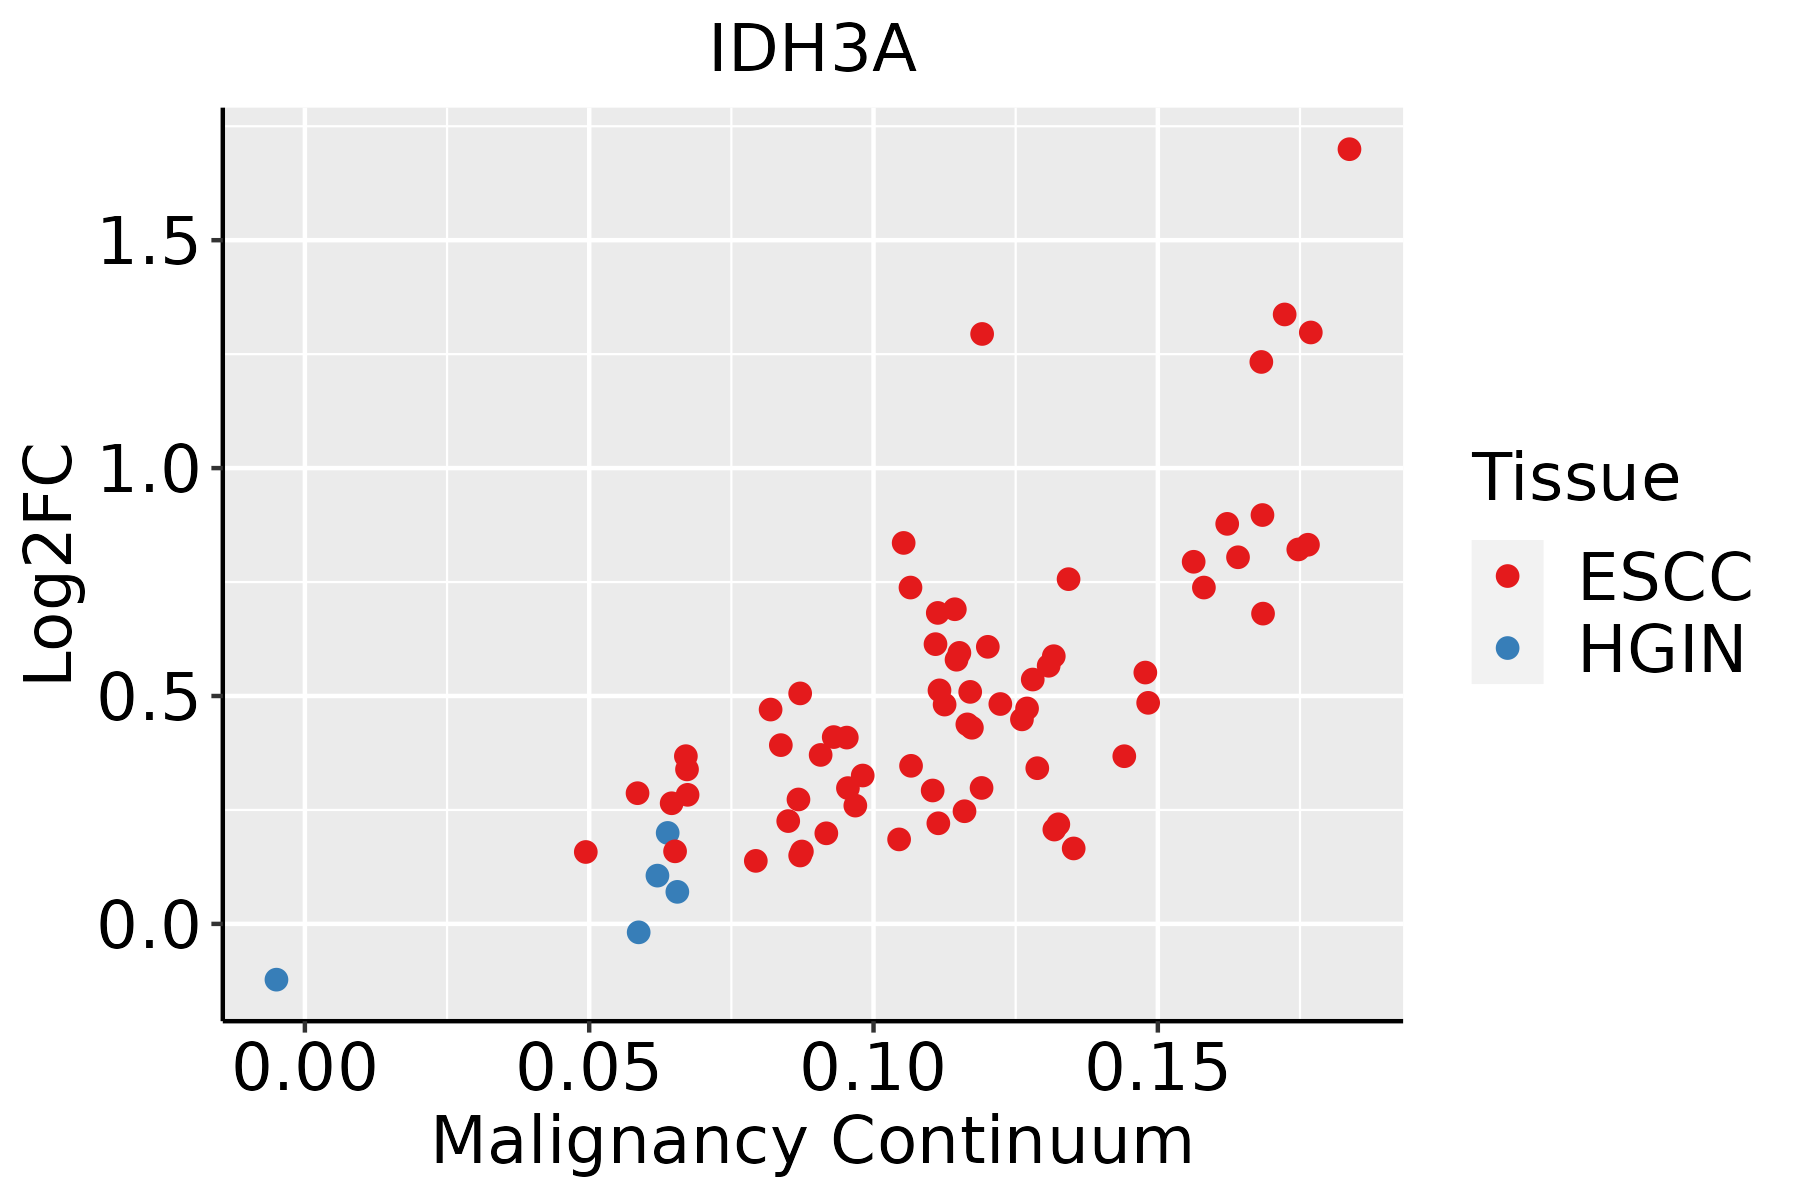 | ESCC: Esophageal squamous cell carcinoma |
| HGIN: High-grade intraepithelial neoplasias |
| LGIN: Low-grade intraepithelial neoplasias |
| Liver |  | HCC: Hepatocellular carcinoma |
| NAFLD: Non-alcoholic fatty liver disease |
| Oral Cavity | 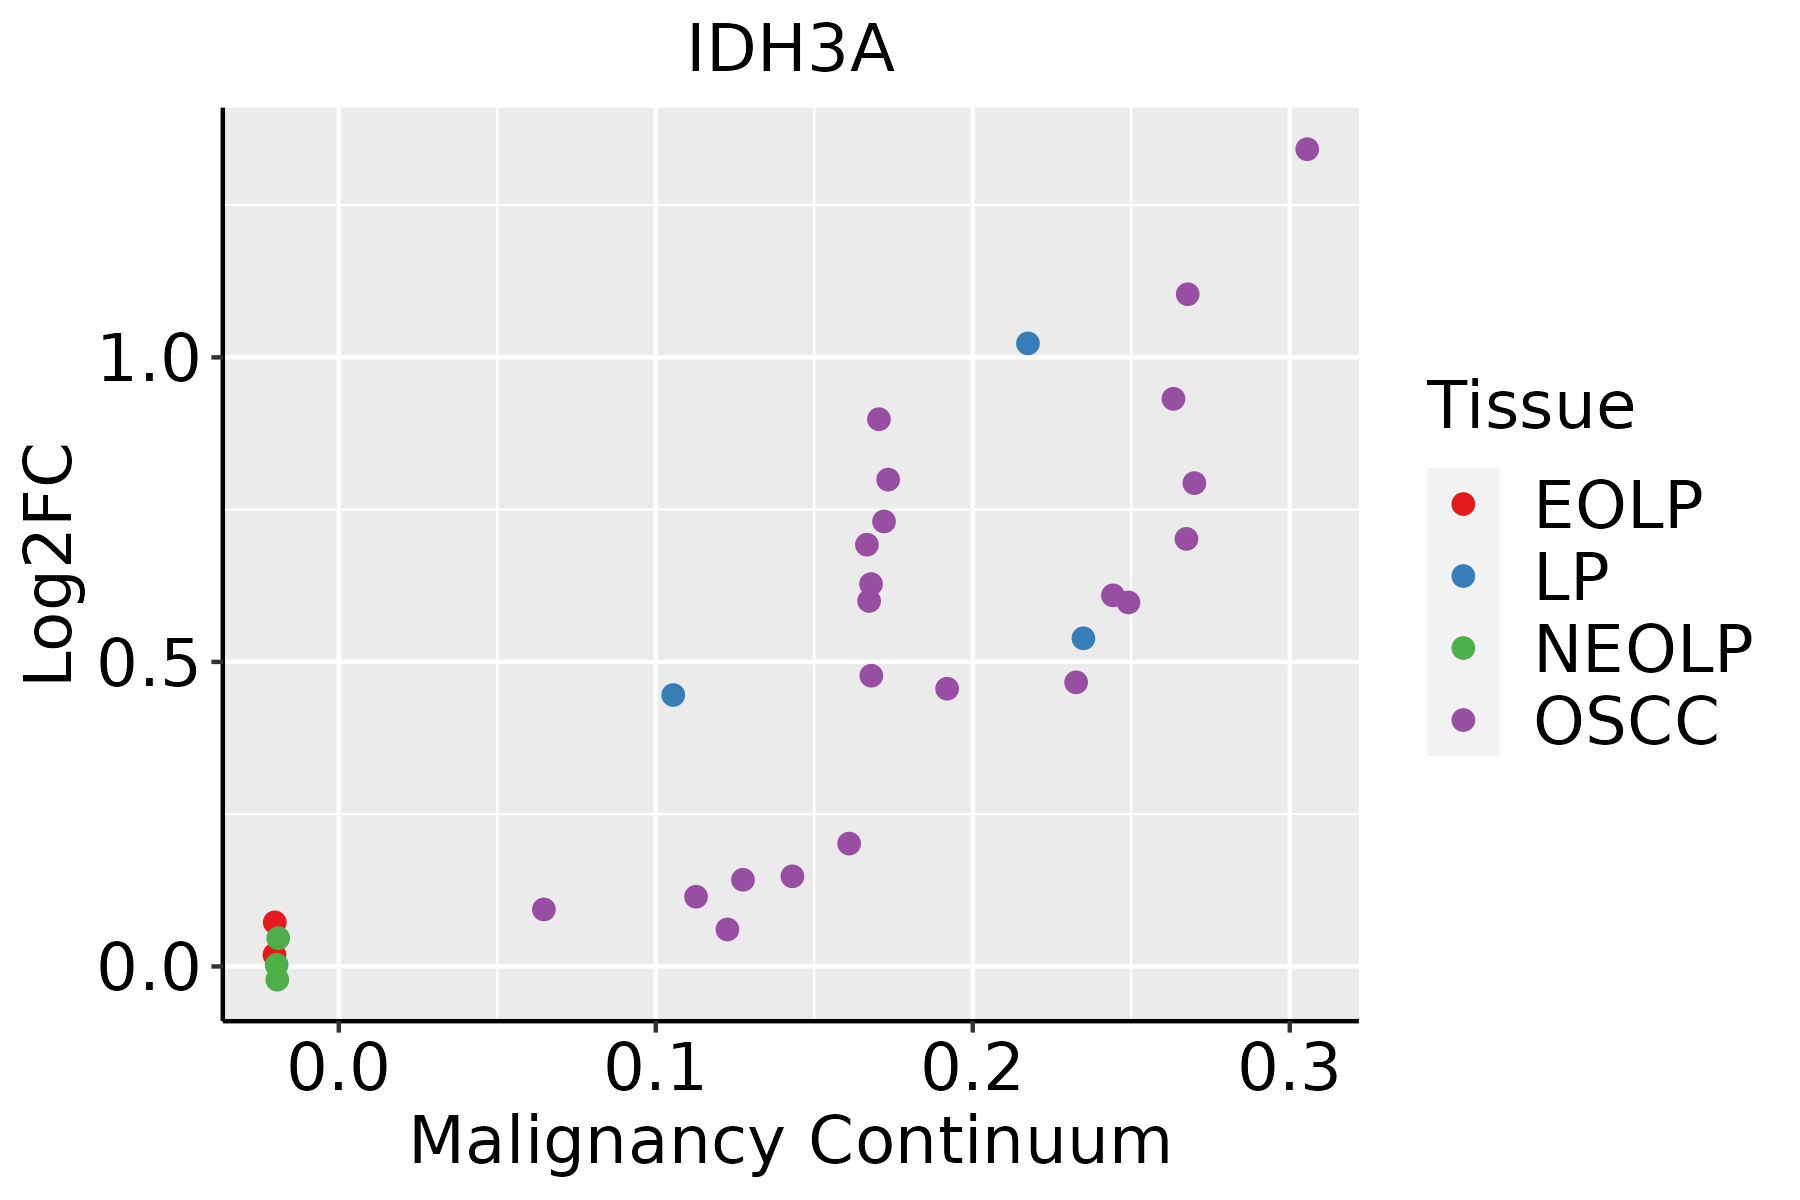 | EOLP: Erosive Oral lichen planus |
| LP: leukoplakia |
| NEOLP: Non-erosive oral lichen planus |
| OSCC: Oral squamous cell carcinoma |
| Skin | 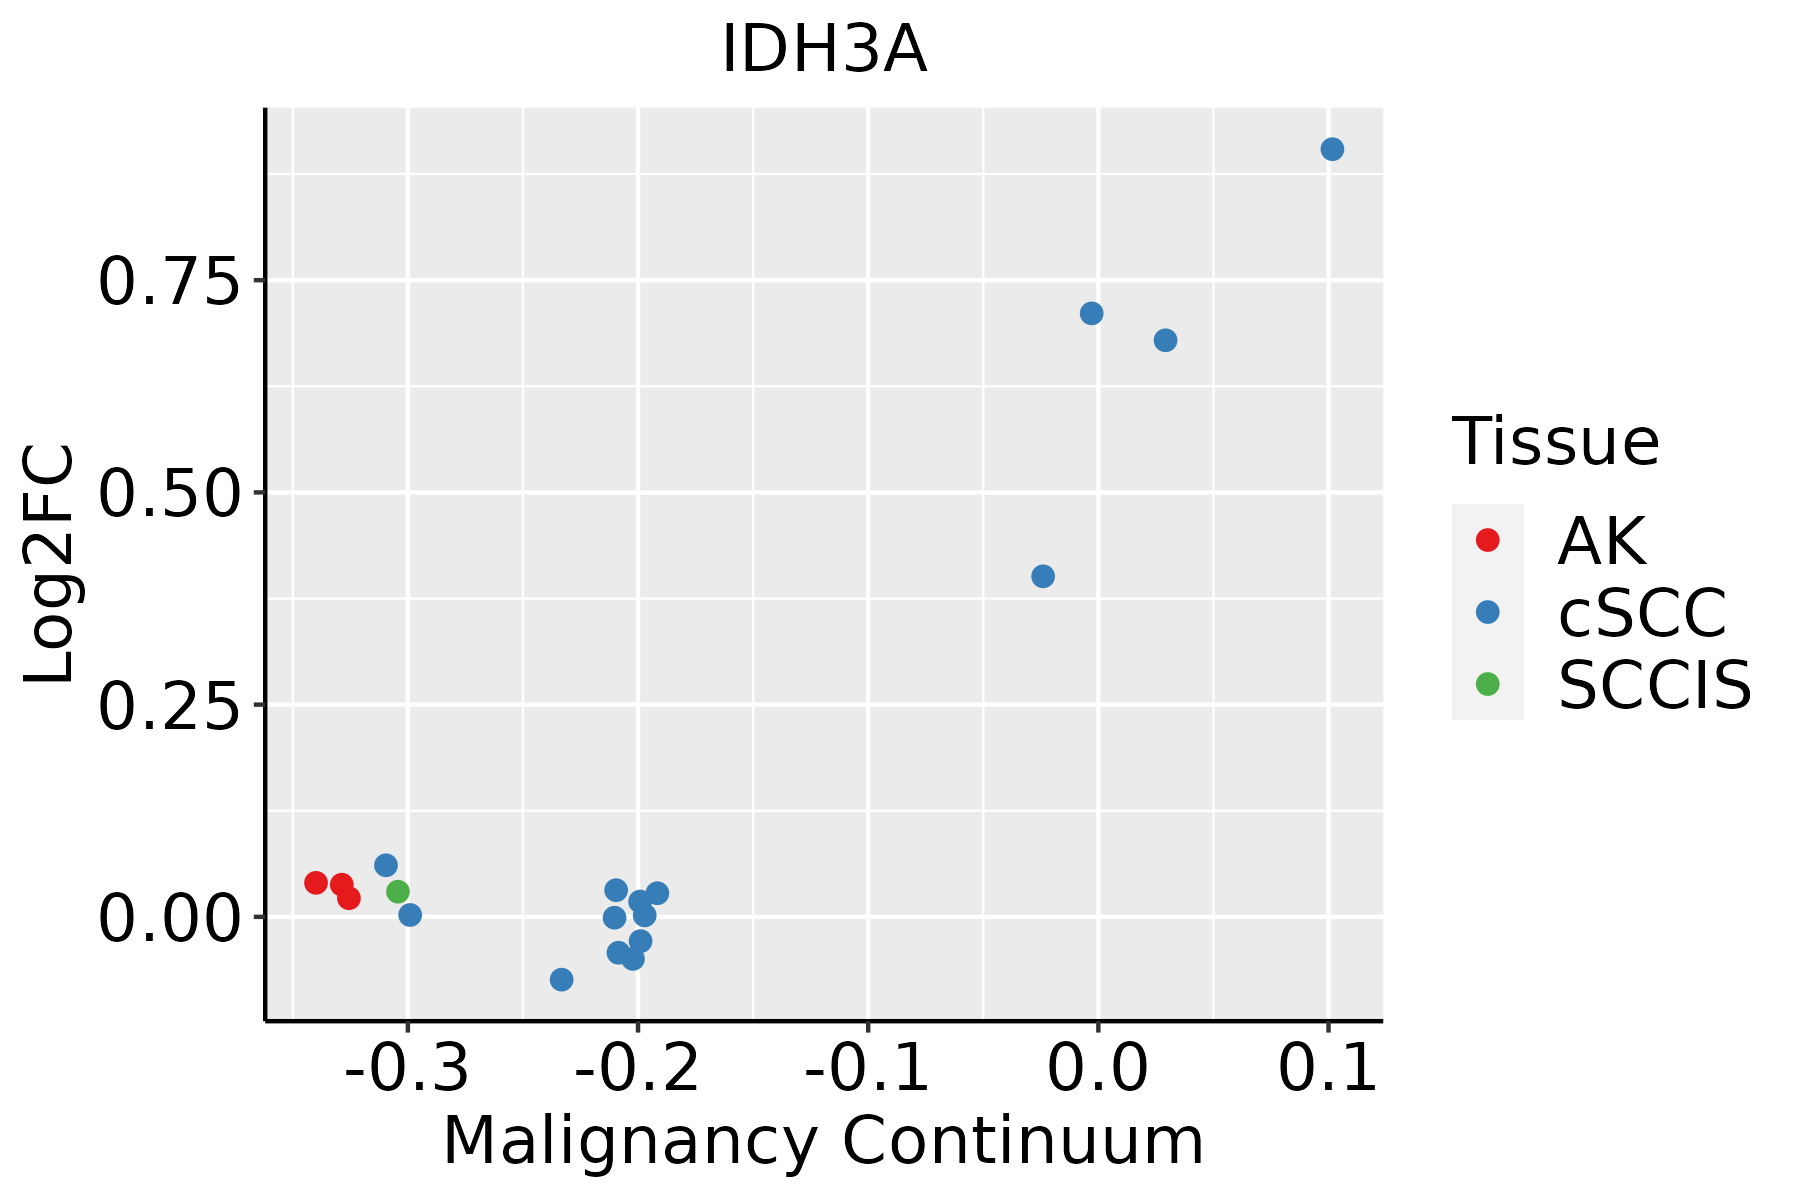 | AK: Actinic keratosis |
| cSCC: Cutaneous squamous cell carcinoma |
| SCCIS:squamous cell carcinoma in situ |
| GO ID | Tissue | Disease Stage | Description | Gene Ratio | Bg Ratio | pvalue | p.adjust | Count |
| GO:0006091110 | Esophagus | ESCC | generation of precursor metabolites and energy | 331/8552 | 490/18723 | 3.86e-23 | 8.45e-21 | 331 |
| GO:0045333110 | Esophagus | ESCC | cellular respiration | 173/8552 | 230/18723 | 4.53e-20 | 5.99e-18 | 173 |
| GO:0009060110 | Esophagus | ESCC | aerobic respiration | 145/8552 | 189/18723 | 2.16e-18 | 2.21e-16 | 145 |
| GO:0015980110 | Esophagus | ESCC | energy derivation by oxidation of organic compounds | 220/8552 | 318/18723 | 1.20e-17 | 1.09e-15 | 220 |
| GO:00060997 | Esophagus | ESCC | tricarboxylic acid cycle | 27/8552 | 30/18723 | 4.54e-07 | 6.15e-06 | 27 |
| GO:00060668 | Esophagus | ESCC | alcohol metabolic process | 202/8552 | 353/18723 | 7.32e-06 | 7.26e-05 | 202 |
| GO:19026524 | Esophagus | ESCC | secondary alcohol metabolic process | 87/8552 | 147/18723 | 6.58e-04 | 3.50e-03 | 87 |
| GO:00723503 | Esophagus | ESCC | tricarboxylic acid metabolic process | 12/8552 | 14/18723 | 2.51e-03 | 1.08e-02 | 12 |
| GO:000609122 | Liver | HCC | generation of precursor metabolites and energy | 340/7958 | 490/18723 | 4.04e-34 | 2.85e-31 | 340 |
| GO:000906012 | Liver | HCC | aerobic respiration | 147/7958 | 189/18723 | 3.13e-23 | 6.61e-21 | 147 |
| GO:004533312 | Liver | HCC | cellular respiration | 171/7958 | 230/18723 | 6.35e-23 | 1.26e-20 | 171 |
| GO:001598022 | Liver | HCC | energy derivation by oxidation of organic compounds | 221/7958 | 318/18723 | 1.02e-22 | 1.86e-20 | 221 |
| GO:000606621 | Liver | HCC | alcohol metabolic process | 208/7958 | 353/18723 | 2.80e-10 | 9.50e-09 | 208 |
| GO:19026522 | Liver | HCC | secondary alcohol metabolic process | 100/7958 | 147/18723 | 3.26e-10 | 1.09e-08 | 100 |
| GO:000609911 | Liver | HCC | tricarboxylic acid cycle | 27/7958 | 30/18723 | 7.59e-08 | 1.52e-06 | 27 |
| GO:00723501 | Liver | HCC | tricarboxylic acid metabolic process | 11/7958 | 14/18723 | 6.81e-03 | 2.73e-02 | 11 |
| GO:000609118 | Oral cavity | OSCC | generation of precursor metabolites and energy | 286/7305 | 490/18723 | 1.45e-18 | 1.71e-16 | 286 |
| GO:000906018 | Oral cavity | OSCC | aerobic respiration | 133/7305 | 189/18723 | 1.79e-18 | 2.02e-16 | 133 |
| GO:004533318 | Oral cavity | OSCC | cellular respiration | 153/7305 | 230/18723 | 2.07e-17 | 1.87e-15 | 153 |
| GO:001598018 | Oral cavity | OSCC | energy derivation by oxidation of organic compounds | 190/7305 | 318/18723 | 4.10e-14 | 2.26e-12 | 190 |
| Pathway ID | Tissue | Disease Stage | Description | Gene Ratio | Bg Ratio | pvalue | p.adjust | qvalue | Count |
| hsa0002014 | Esophagus | ESCC | Citrate cycle (TCA cycle) | 27/4205 | 30/8465 | 3.48e-06 | 1.94e-05 | 9.95e-06 | 27 |
| hsa0120023 | Esophagus | ESCC | Carbon metabolism | 79/4205 | 115/8465 | 2.50e-05 | 1.21e-04 | 6.22e-05 | 79 |
| hsa0123023 | Esophagus | ESCC | Biosynthesis of amino acids | 49/4205 | 75/8465 | 4.35e-03 | 1.12e-02 | 5.74e-03 | 49 |
| hsa0002015 | Esophagus | ESCC | Citrate cycle (TCA cycle) | 27/4205 | 30/8465 | 3.48e-06 | 1.94e-05 | 9.95e-06 | 27 |
| hsa0120033 | Esophagus | ESCC | Carbon metabolism | 79/4205 | 115/8465 | 2.50e-05 | 1.21e-04 | 6.22e-05 | 79 |
| hsa0123033 | Esophagus | ESCC | Biosynthesis of amino acids | 49/4205 | 75/8465 | 4.35e-03 | 1.12e-02 | 5.74e-03 | 49 |
| hsa0120041 | Liver | HCC | Carbon metabolism | 89/4020 | 115/8465 | 3.92e-11 | 6.56e-10 | 3.65e-10 | 89 |
| hsa0002021 | Liver | HCC | Citrate cycle (TCA cycle) | 28/4020 | 30/8465 | 1.08e-07 | 1.44e-06 | 8.02e-07 | 28 |
| hsa0123021 | Liver | HCC | Biosynthesis of amino acids | 53/4020 | 75/8465 | 3.79e-05 | 2.11e-04 | 1.18e-04 | 53 |
| hsa0120051 | Liver | HCC | Carbon metabolism | 89/4020 | 115/8465 | 3.92e-11 | 6.56e-10 | 3.65e-10 | 89 |
| hsa0002031 | Liver | HCC | Citrate cycle (TCA cycle) | 28/4020 | 30/8465 | 1.08e-07 | 1.44e-06 | 8.02e-07 | 28 |
| hsa0123031 | Liver | HCC | Biosynthesis of amino acids | 53/4020 | 75/8465 | 3.79e-05 | 2.11e-04 | 1.18e-04 | 53 |
| hsa0002012 | Oral cavity | OSCC | Citrate cycle (TCA cycle) | 26/3704 | 30/8465 | 1.38e-06 | 7.46e-06 | 3.80e-06 | 26 |
| hsa0120014 | Oral cavity | OSCC | Carbon metabolism | 74/3704 | 115/8465 | 6.10e-06 | 3.05e-05 | 1.55e-05 | 74 |
| hsa012305 | Oral cavity | OSCC | Biosynthesis of amino acids | 45/3704 | 75/8465 | 3.27e-03 | 8.23e-03 | 4.19e-03 | 45 |
| hsa0002013 | Oral cavity | OSCC | Citrate cycle (TCA cycle) | 26/3704 | 30/8465 | 1.38e-06 | 7.46e-06 | 3.80e-06 | 26 |
| hsa0120015 | Oral cavity | OSCC | Carbon metabolism | 74/3704 | 115/8465 | 6.10e-06 | 3.05e-05 | 1.55e-05 | 74 |
| hsa0123012 | Oral cavity | OSCC | Biosynthesis of amino acids | 45/3704 | 75/8465 | 3.27e-03 | 8.23e-03 | 4.19e-03 | 45 |
| hsa0120022 | Oral cavity | LP | Carbon metabolism | 62/2418 | 115/8465 | 8.38e-09 | 1.39e-07 | 8.99e-08 | 62 |
| hsa0002022 | Oral cavity | LP | Citrate cycle (TCA cycle) | 22/2418 | 30/8465 | 4.66e-07 | 5.97e-06 | 3.85e-06 | 22 |
| Hugo Symbol | Variant Class | Variant Classification | dbSNP RS | HGVSc | HGVSp | HGVSp Short | SWISSPROT | BIOTYPE | SIFT | PolyPhen | Tumor Sample Barcode | Tissue | Histology | Sex | Age | Stage | Therapy Types | Drugs | Outcome |
| IDH3A | SNV | Missense_Mutation | novel | c.1019N>T | p.Ser340Ile | p.S340I | P50213 | protein_coding | tolerated(0.39) | benign(0.003) | TCGA-AC-A3W5-01 | Breast | breast invasive carcinoma | Female | >=65 | I/II | Chemotherapy | docetaxel | CR |
| IDH3A | SNV | Missense_Mutation | | c.263N>C | p.Met88Thr | p.M88T | P50213 | protein_coding | deleterious(0) | benign(0.281) | TCGA-D8-A1XK-01 | Breast | breast invasive carcinoma | Female | <65 | I/II | Chemotherapy | doxorubicine+cyclophosphamide | SD |
| IDH3A | SNV | Missense_Mutation | | c.316N>A | p.Gly106Ser | p.G106S | P50213 | protein_coding | deleterious(0) | probably_damaging(1) | TCGA-E2-A1B0-01 | Breast | breast invasive carcinoma | Female | <65 | III/IV | Chemotherapy | cytoxan | SD |
| IDH3A | insertion | Nonsense_Mutation | novel | c.1095_1096insTAAGAGTTAATGATTTAGGCAGGTGTGGTGGTGCATGCCT | p.Asp366Ter | p.D366* | P50213 | protein_coding | | | TCGA-A8-A07J-01 | Breast | breast invasive carcinoma | Female | <65 | I/II | Chemotherapy | 5-fluorouracil | CR |
| IDH3A | insertion | Nonsense_Mutation | novel | c.338_339insCCCGTGAGGAAGTGTTCCTCCTTCATTTGAATCTCAGGTAGA | p.Leu113_Leu114insProTerGlySerValProProSerPheGluSerGlnValGlu | p.L113_L114insP*GSVPPSFESQVE | P50213 | protein_coding | | | TCGA-AN-A0AK-01 | Breast | breast invasive carcinoma | Female | >=65 | I/II | Unknown | Unknown | SD |
| IDH3A | insertion | Frame_Shift_Ins | novel | c.247_248insCCAAAGTTGAAAAAGGGCTGGGCCCGGTAGCTCACGTCTGTAATCCC | p.Glu83AlafsTer29 | p.E83Afs*29 | P50213 | protein_coding | | | TCGA-AO-A0J5-01 | Breast | breast invasive carcinoma | Female | <65 | III/IV | Other, specify in notesBisphosphonate | zoledronic | PD |
| IDH3A | insertion | Frame_Shift_Ins | novel | c.423_424insGG | p.Ile142GlyfsTer3 | p.I142Gfs*3 | P50213 | protein_coding | | | TCGA-BH-A0AY-01 | Breast | breast invasive carcinoma | Female | <65 | I/II | Chemotherapy | | SD |
| IDH3A | insertion | Frame_Shift_Ins | novel | c.424_425insCTACAGGTGTGCCACCATGCCCAACTAATTTTTTAAAAAGTTTT | p.Ile142ThrfsTer17 | p.I142Tfs*17 | P50213 | protein_coding | | | TCGA-BH-A0AY-01 | Breast | breast invasive carcinoma | Female | <65 | I/II | Chemotherapy | | SD |
| IDH3A | SNV | Missense_Mutation | | c.553N>C | p.Glu185Gln | p.E185Q | P50213 | protein_coding | tolerated(0.32) | benign(0.079) | TCGA-DG-A2KL-01 | Cervix | cervical & endocervical cancer | Female | <65 | I/II | Chemotherapy | cisplatin | SD |
| IDH3A | SNV | Missense_Mutation | rs747375549 | c.415G>A | p.Asp139Asn | p.D139N | P50213 | protein_coding | tolerated(1) | benign(0.014) | TCGA-HM-A4S6-01 | Cervix | cervical & endocervical cancer | Female | <65 | III/IV | Chemotherapy | cisplatin | CR |


