
|
|||||
|
 | |
| |
| |
| |
| |
| |
|
Gene: IDH2 |
Gene summary for IDH2 |
| Gene information | Species | Human | Gene symbol | IDH2 | Gene ID | 3418 |
| Gene name | isocitrate dehydrogenase (NADP(+)) 2 | |
| Gene Alias | D2HGA2 | |
| Cytomap | 15q26.1 | |
| Gene Type | protein-coding | GO ID | GO:0005975 | UniProtAcc | P48735 |
Top |
Malignant transformation analysis |
| Identification of the aberrant gene expression in precancerous and cancerous lesions by comparing the gene expression of stem-like cells in diseased tissues with normal stem cells |
| Entrez ID | Symbol | Replicates | Species | Organ | Tissue | Adj P-value | Log2FC | Malignancy |
| 3418 | IDH2 | GSM4909280 | Human | Breast | Precancer | 8.45e-03 | -4.14e-01 | 0.0305 |
| 3418 | IDH2 | GSM4909281 | Human | Breast | IDC | 1.27e-02 | 3.48e-01 | 0.21 |
| 3418 | IDH2 | GSM4909282 | Human | Breast | IDC | 9.92e-69 | 1.09e+00 | -0.0288 |
| 3418 | IDH2 | GSM4909285 | Human | Breast | IDC | 1.32e-25 | 6.04e-01 | 0.21 |
| 3418 | IDH2 | GSM4909288 | Human | Breast | IDC | 3.36e-05 | 3.30e-01 | 0.0988 |
| 3418 | IDH2 | GSM4909290 | Human | Breast | IDC | 1.10e-09 | 5.12e-01 | 0.2096 |
| 3418 | IDH2 | GSM4909291 | Human | Breast | IDC | 6.02e-21 | 6.91e-01 | 0.1753 |
| 3418 | IDH2 | GSM4909294 | Human | Breast | IDC | 4.07e-06 | 3.91e-01 | 0.2022 |
| 3418 | IDH2 | GSM4909296 | Human | Breast | IDC | 1.42e-09 | 3.36e-01 | 0.1524 |
| 3418 | IDH2 | GSM4909297 | Human | Breast | IDC | 4.03e-10 | -2.20e-01 | 0.1517 |
| 3418 | IDH2 | GSM4909301 | Human | Breast | IDC | 1.58e-06 | -3.06e-01 | 0.1577 |
| 3418 | IDH2 | GSM4909304 | Human | Breast | IDC | 1.59e-25 | 6.99e-01 | 0.1636 |
| 3418 | IDH2 | GSM4909306 | Human | Breast | IDC | 1.57e-12 | 4.61e-01 | 0.1564 |
| 3418 | IDH2 | GSM4909308 | Human | Breast | IDC | 2.26e-04 | 3.49e-01 | 0.158 |
| 3418 | IDH2 | GSM4909311 | Human | Breast | IDC | 2.64e-20 | -2.21e-01 | 0.1534 |
| 3418 | IDH2 | GSM4909312 | Human | Breast | IDC | 1.45e-06 | 5.06e-02 | 0.1552 |
| 3418 | IDH2 | GSM4909315 | Human | Breast | IDC | 6.13e-04 | 3.07e-01 | 0.21 |
| 3418 | IDH2 | GSM4909316 | Human | Breast | IDC | 8.78e-05 | 3.66e-01 | 0.21 |
| 3418 | IDH2 | GSM4909319 | Human | Breast | IDC | 1.64e-32 | -3.56e-02 | 0.1563 |
| 3418 | IDH2 | GSM4909320 | Human | Breast | IDC | 4.37e-03 | -2.30e-01 | 0.1575 |
| Page: 1 2 3 4 5 6 7 8 9 10 11 |
| Tissue | Expression Dynamics | Abbreviation |
| Breast |  | IDC: Invasive ductal carcinoma |
| DCIS: Ductal carcinoma in situ | ||
| Precancer(BRCA1-mut): Precancerous lesion from BRCA1 mutation carriers | ||
| Colorectum (GSE201348) | 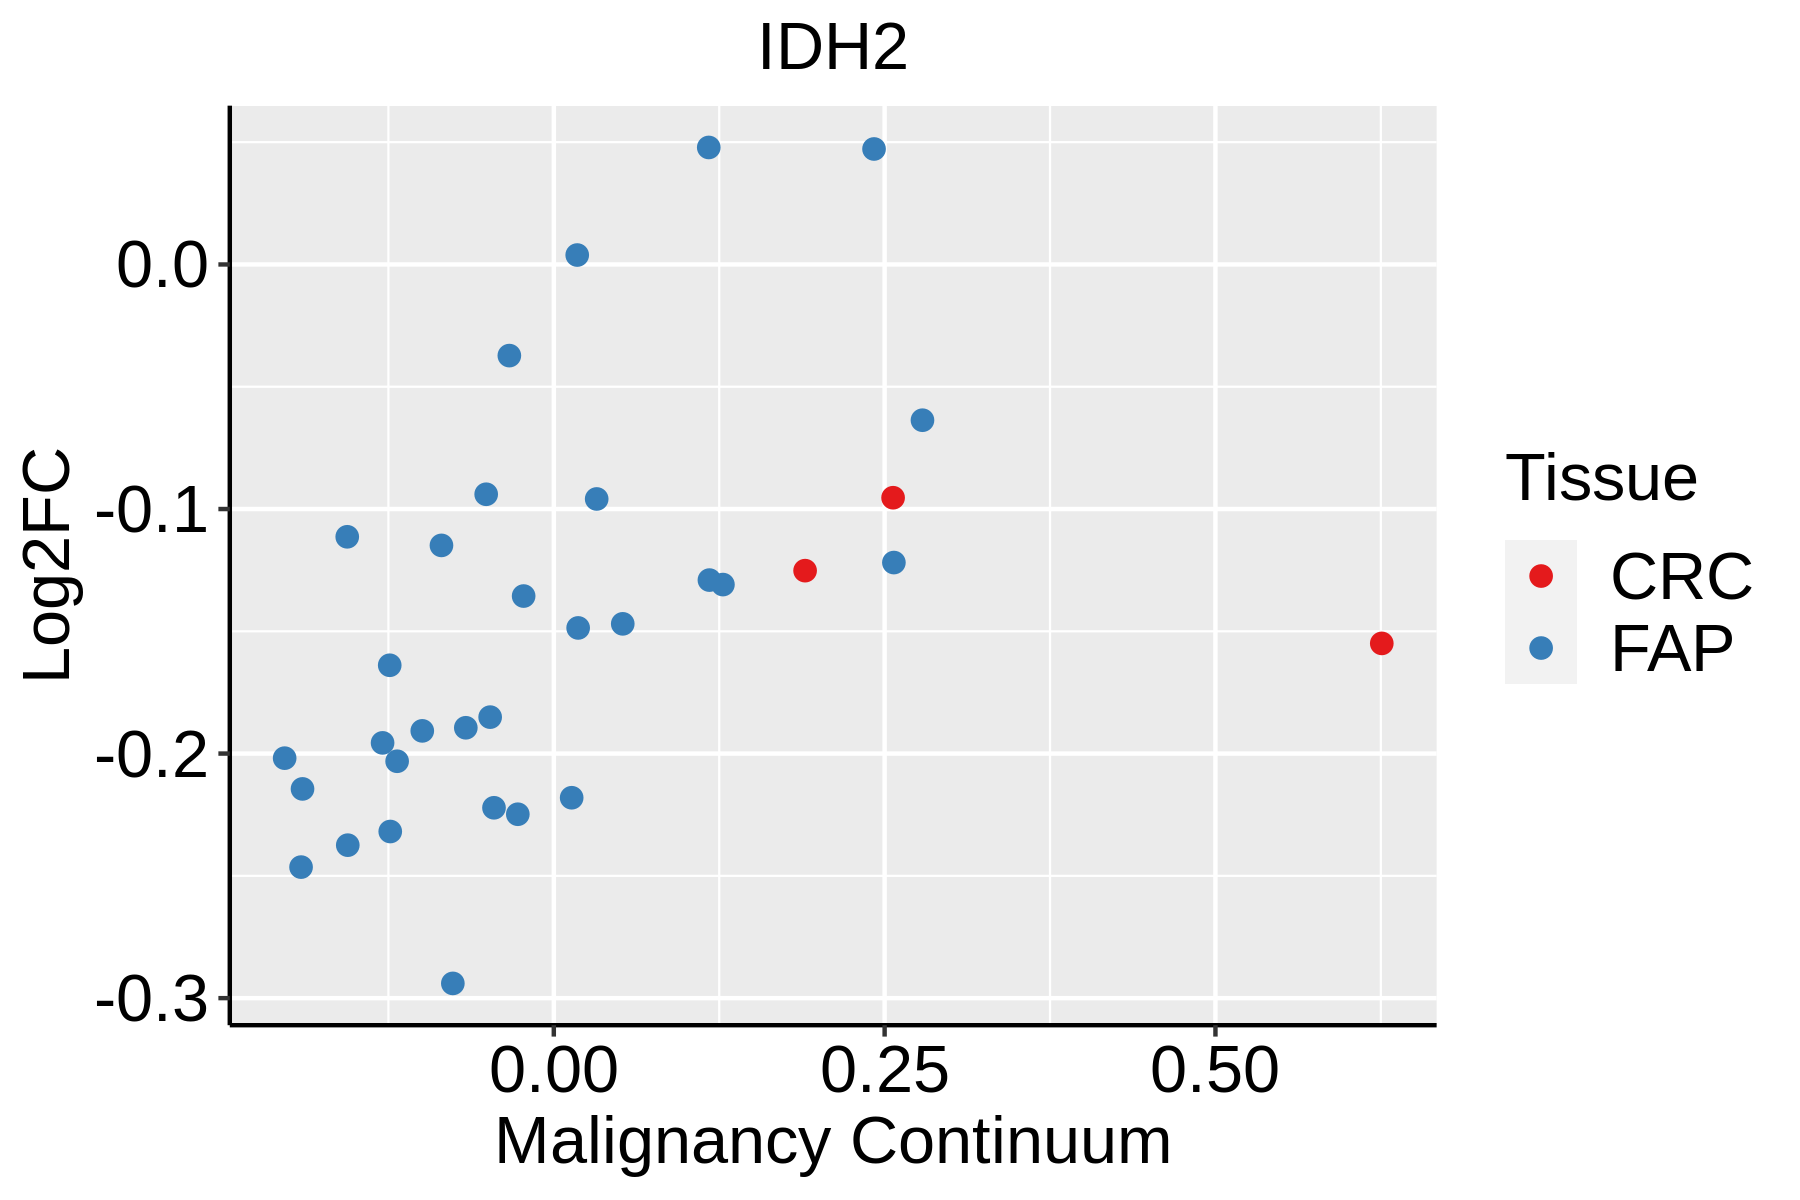 | FAP: Familial adenomatous polyposis |
| CRC: Colorectal cancer | ||
| Colorectum (HTA11) |  | AD: Adenomas |
| SER: Sessile serrated lesions | ||
| MSI-H: Microsatellite-high colorectal cancer | ||
| MSS: Microsatellite stable colorectal cancer | ||
| Esophagus | 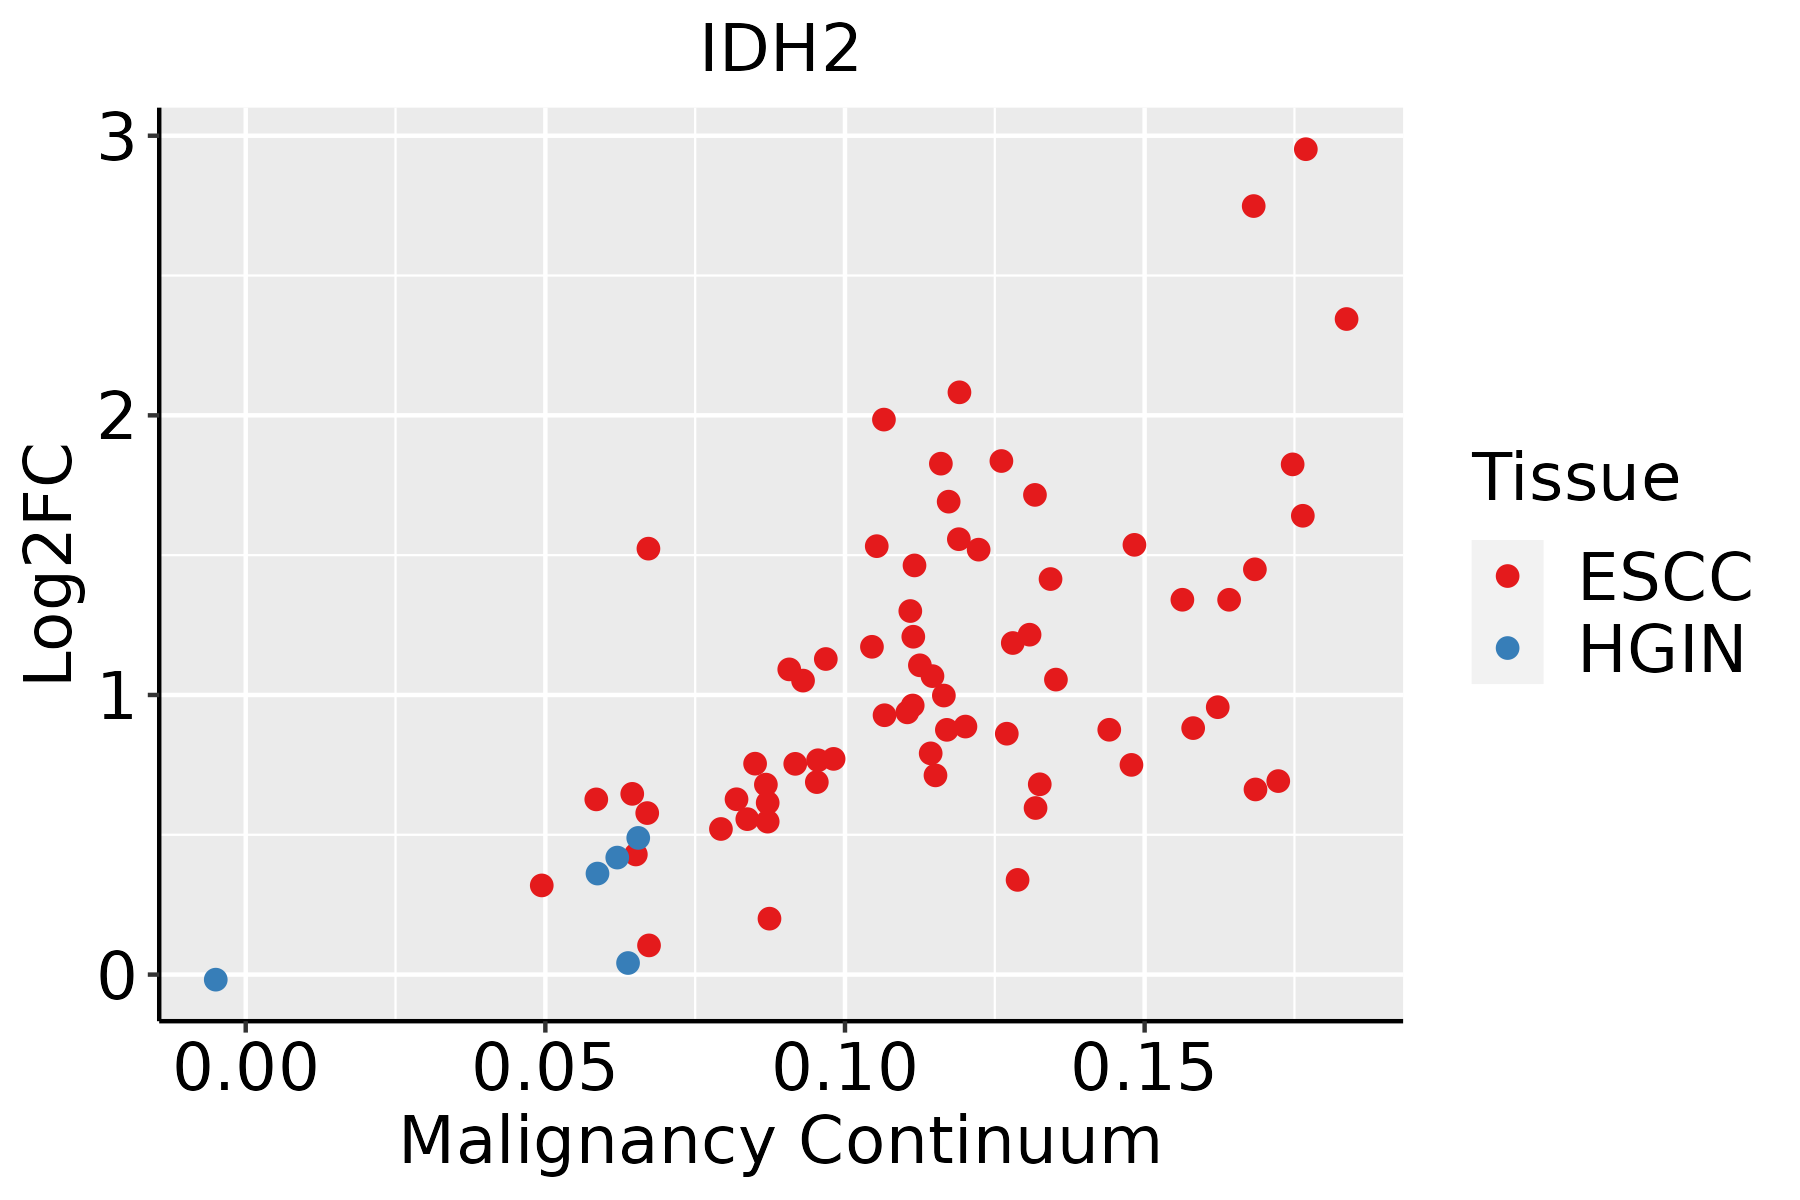 | ESCC: Esophageal squamous cell carcinoma |
| HGIN: High-grade intraepithelial neoplasias | ||
| LGIN: Low-grade intraepithelial neoplasias | ||
| Liver | 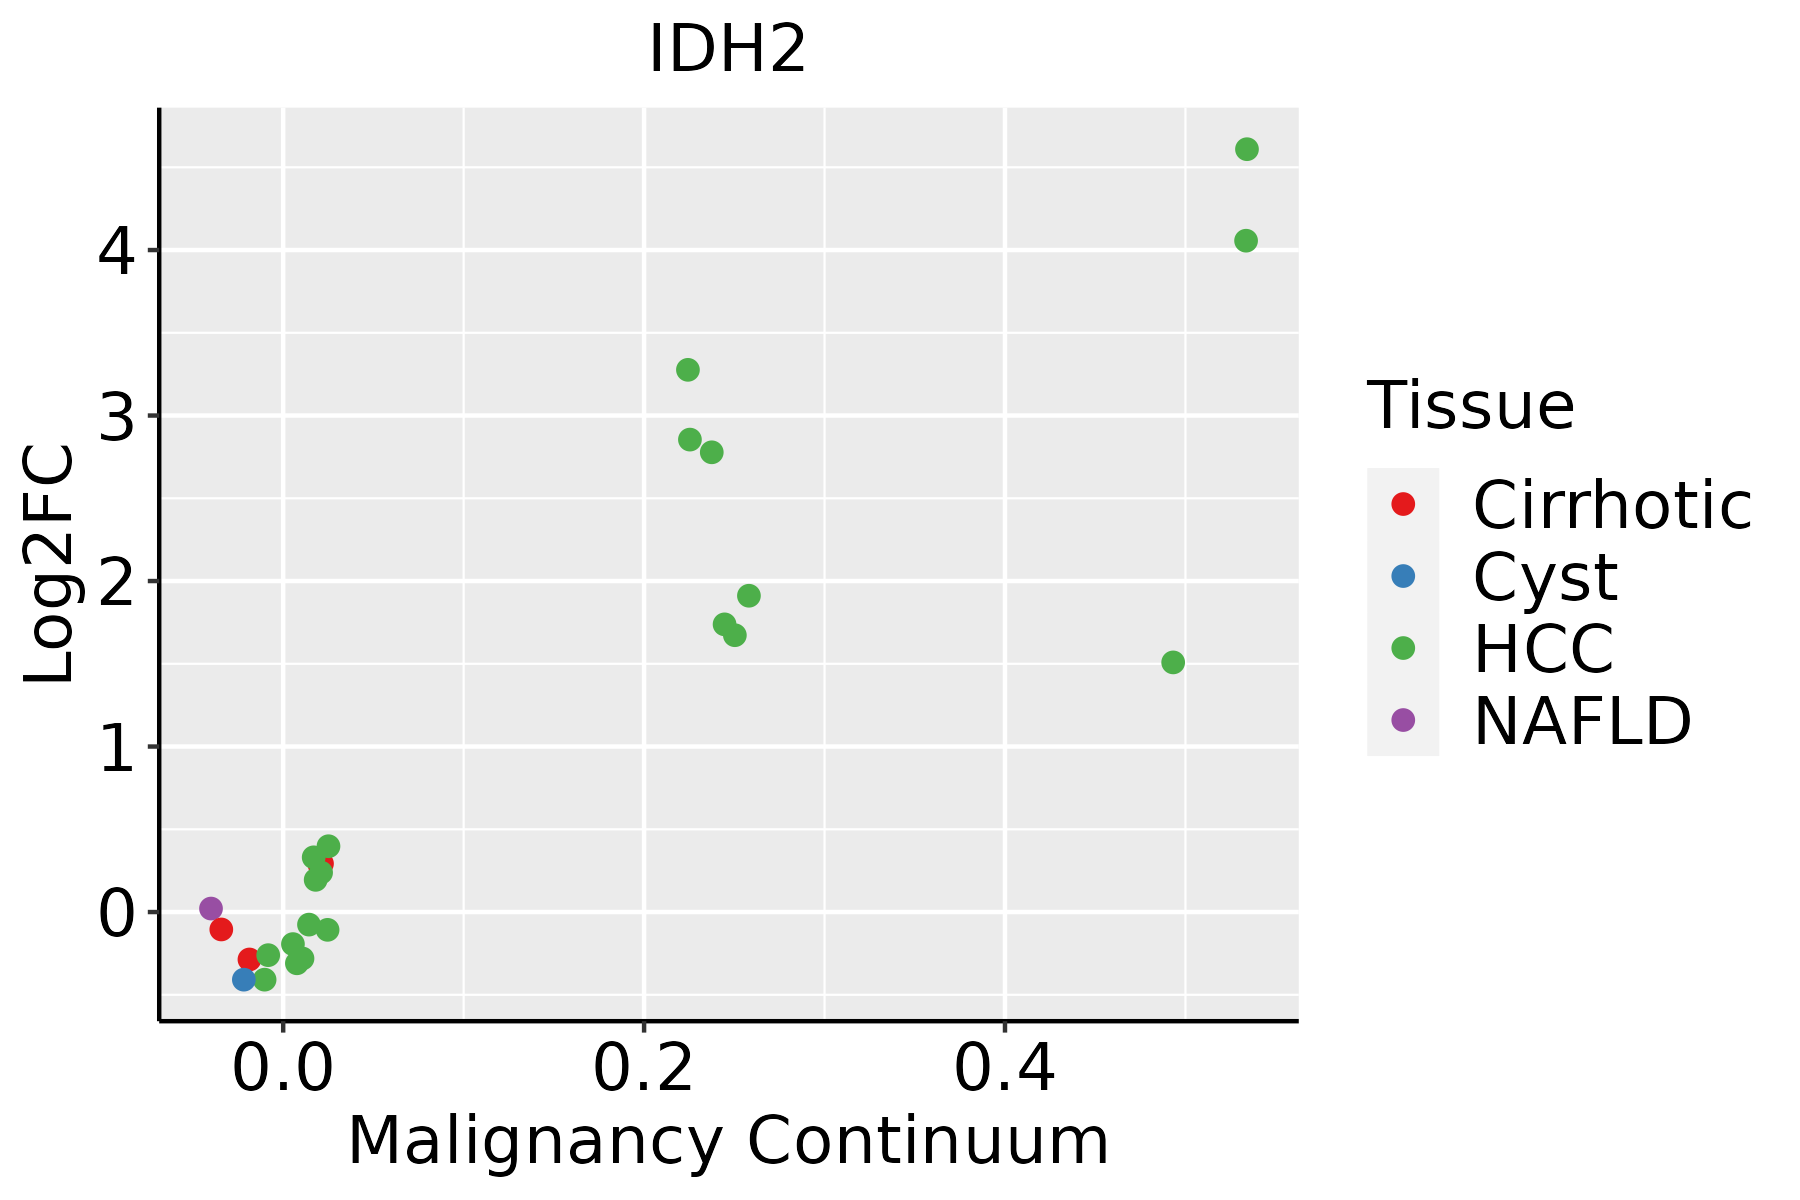 | HCC: Hepatocellular carcinoma |
| NAFLD: Non-alcoholic fatty liver disease | ||
| Oral Cavity | 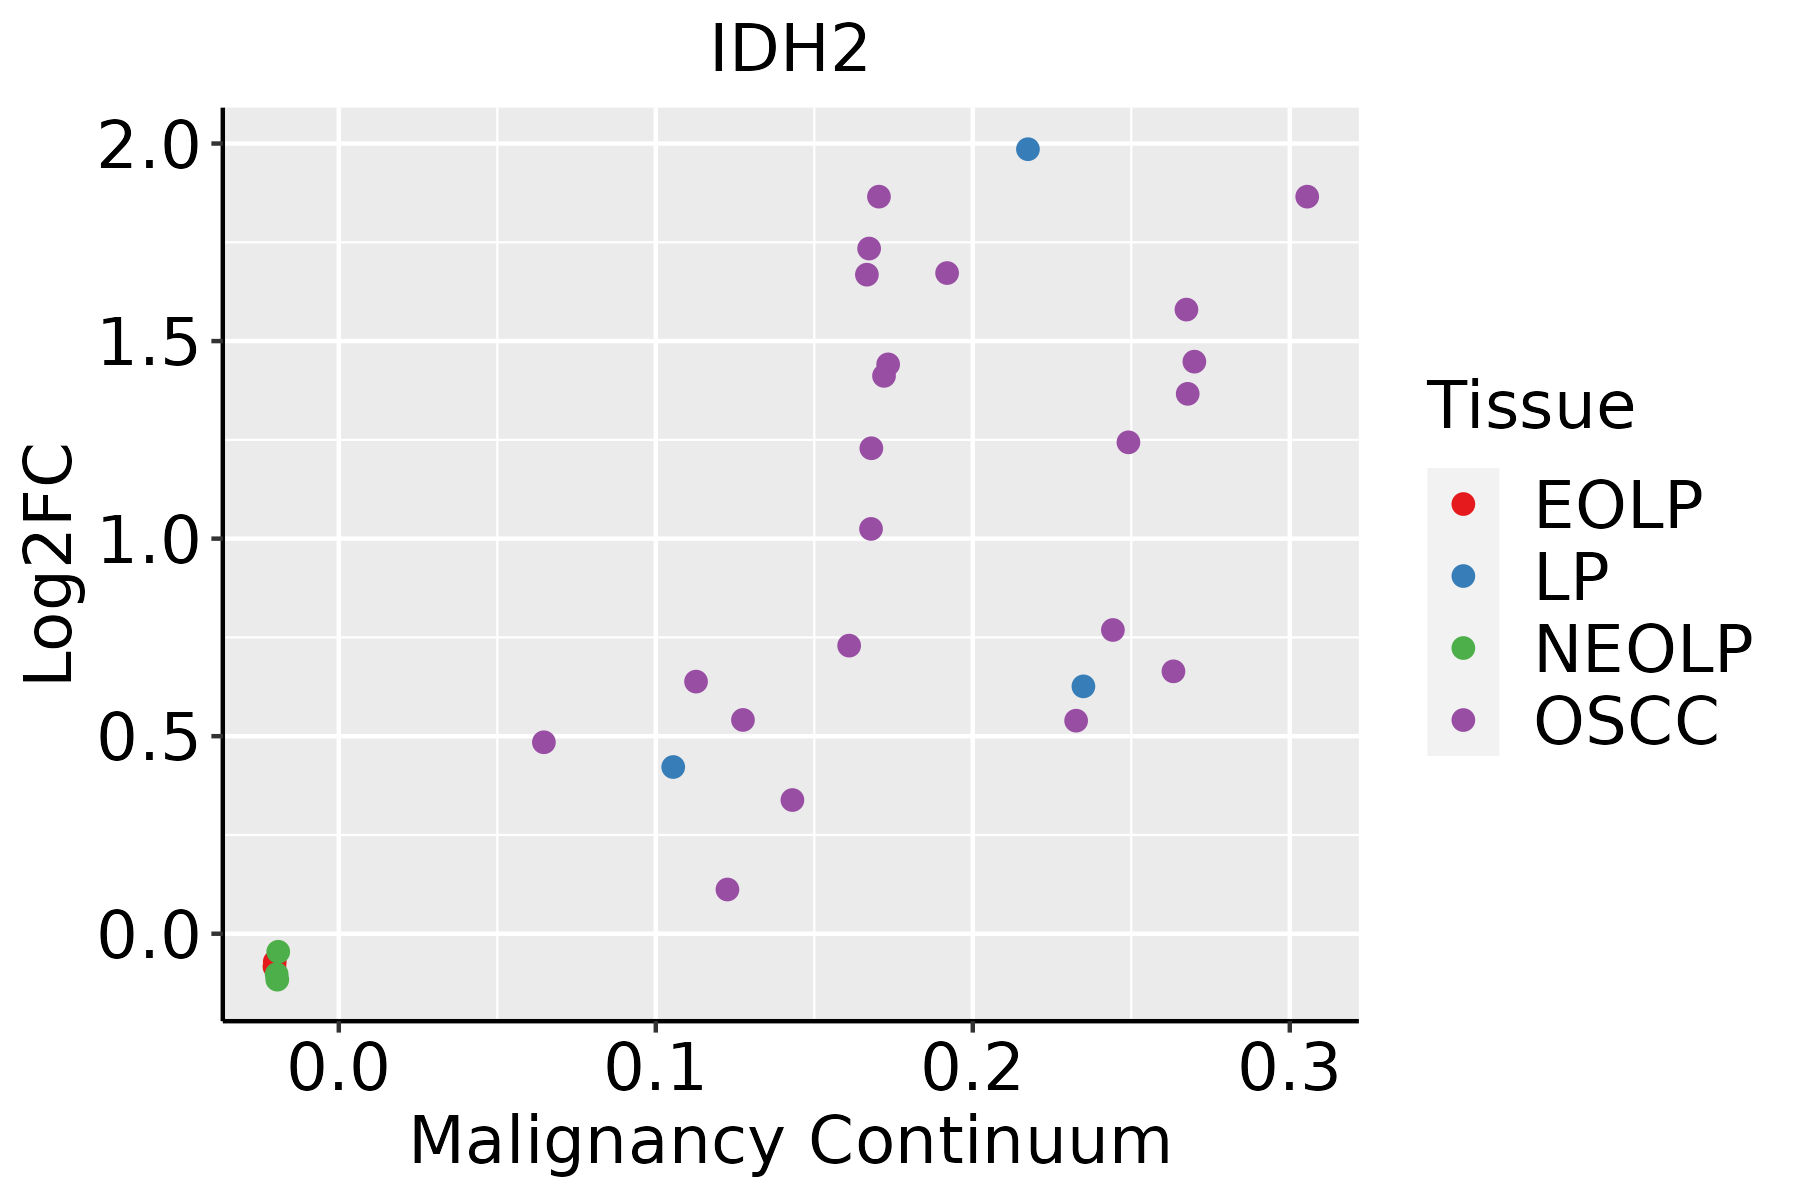 | EOLP: Erosive Oral lichen planus |
| LP: leukoplakia | ||
| NEOLP: Non-erosive oral lichen planus | ||
| OSCC: Oral squamous cell carcinoma | ||
| Prostate | 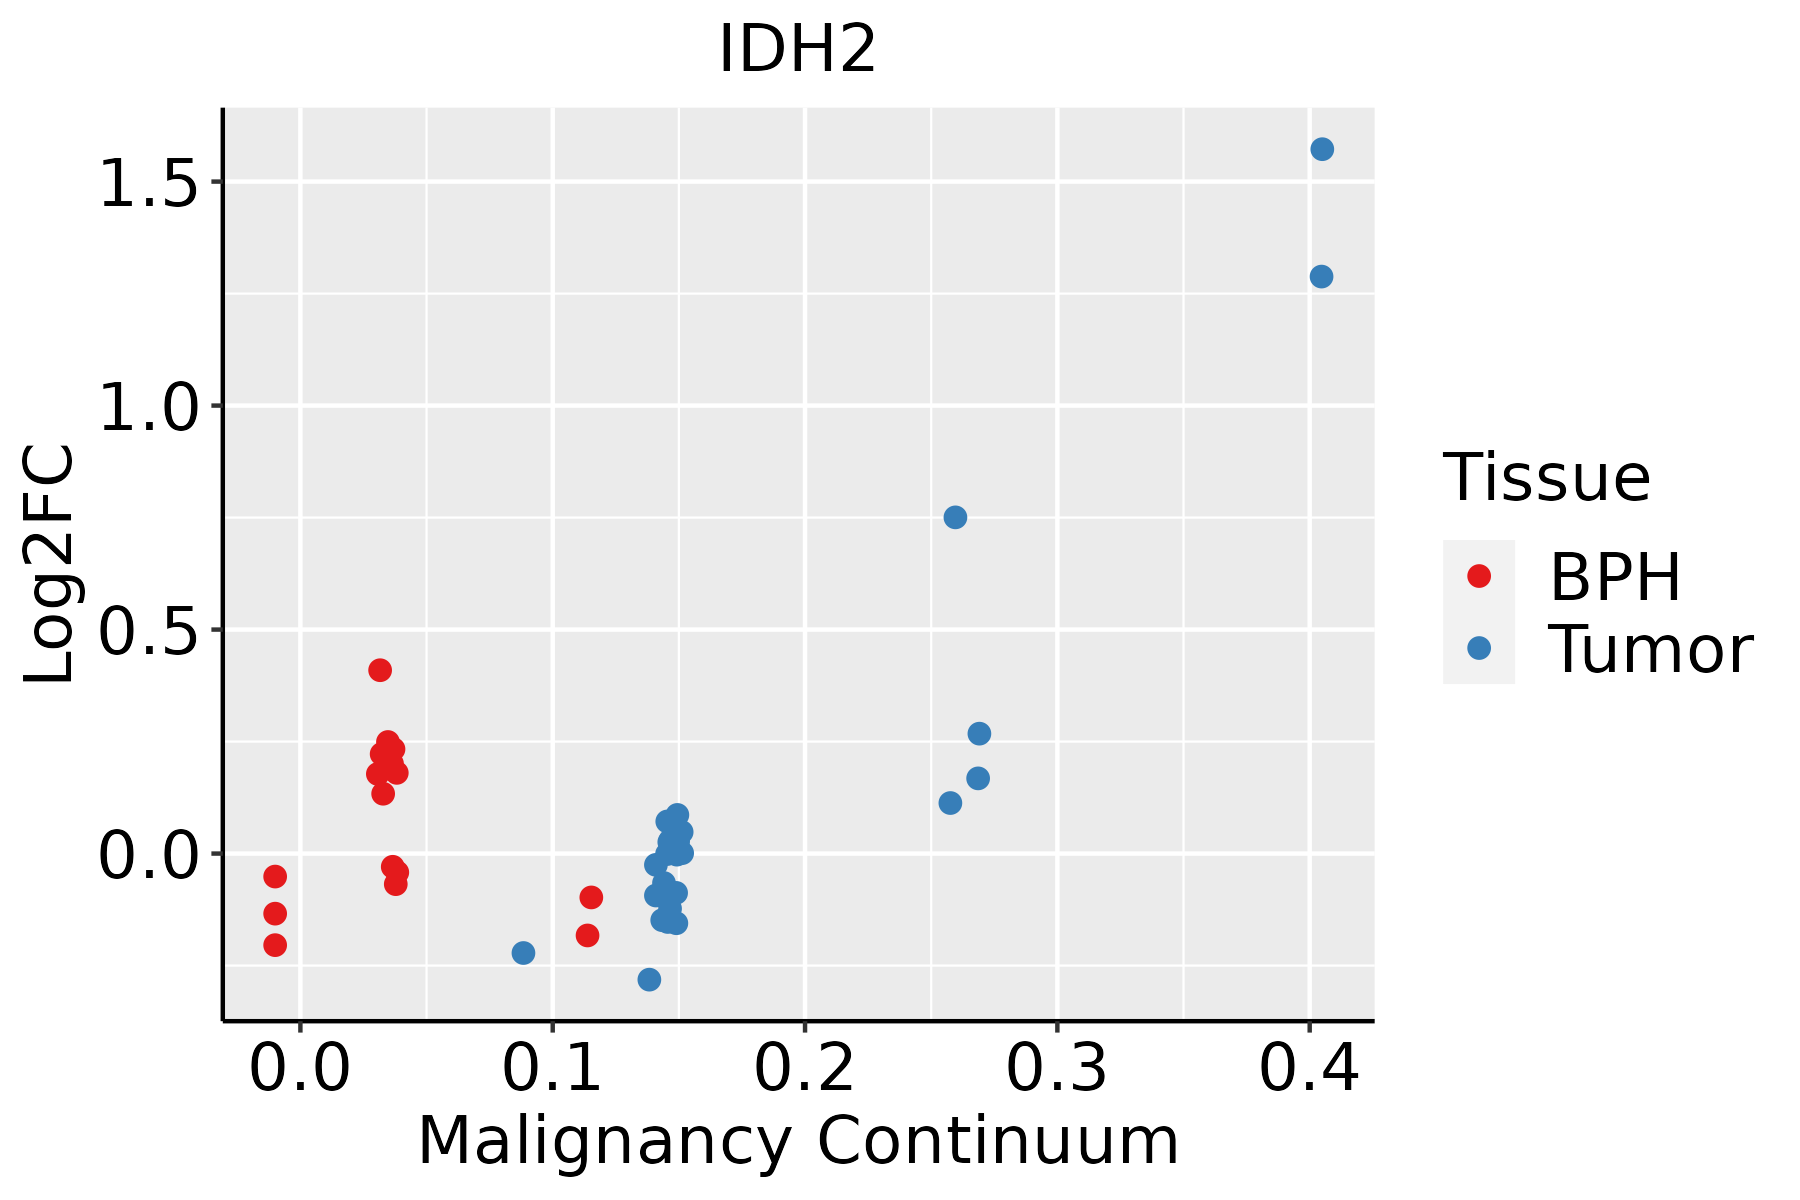 | BPH: Benign Prostatic Hyperplasia |
| Skin | 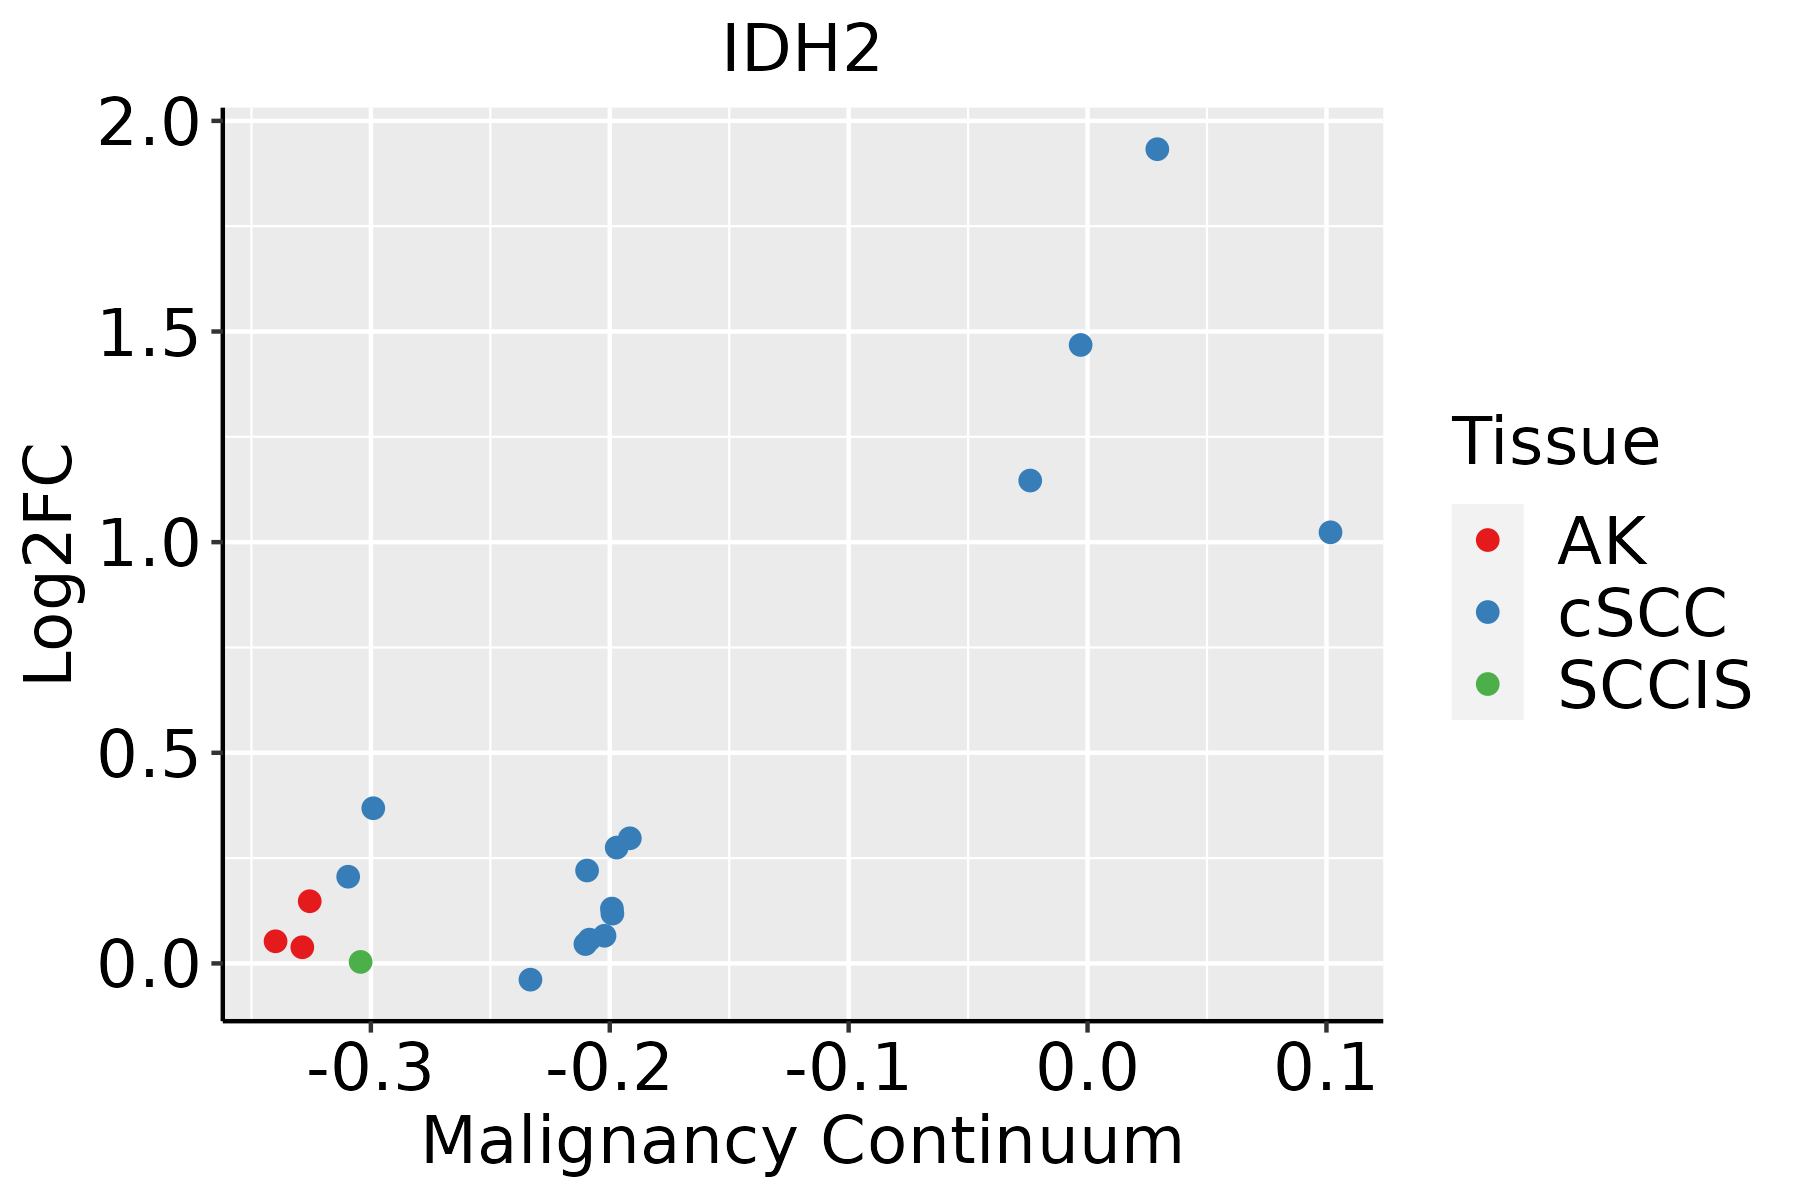 | AK: Actinic keratosis |
| cSCC: Cutaneous squamous cell carcinoma | ||
| SCCIS:squamous cell carcinoma in situ | ||
| Thyroid | 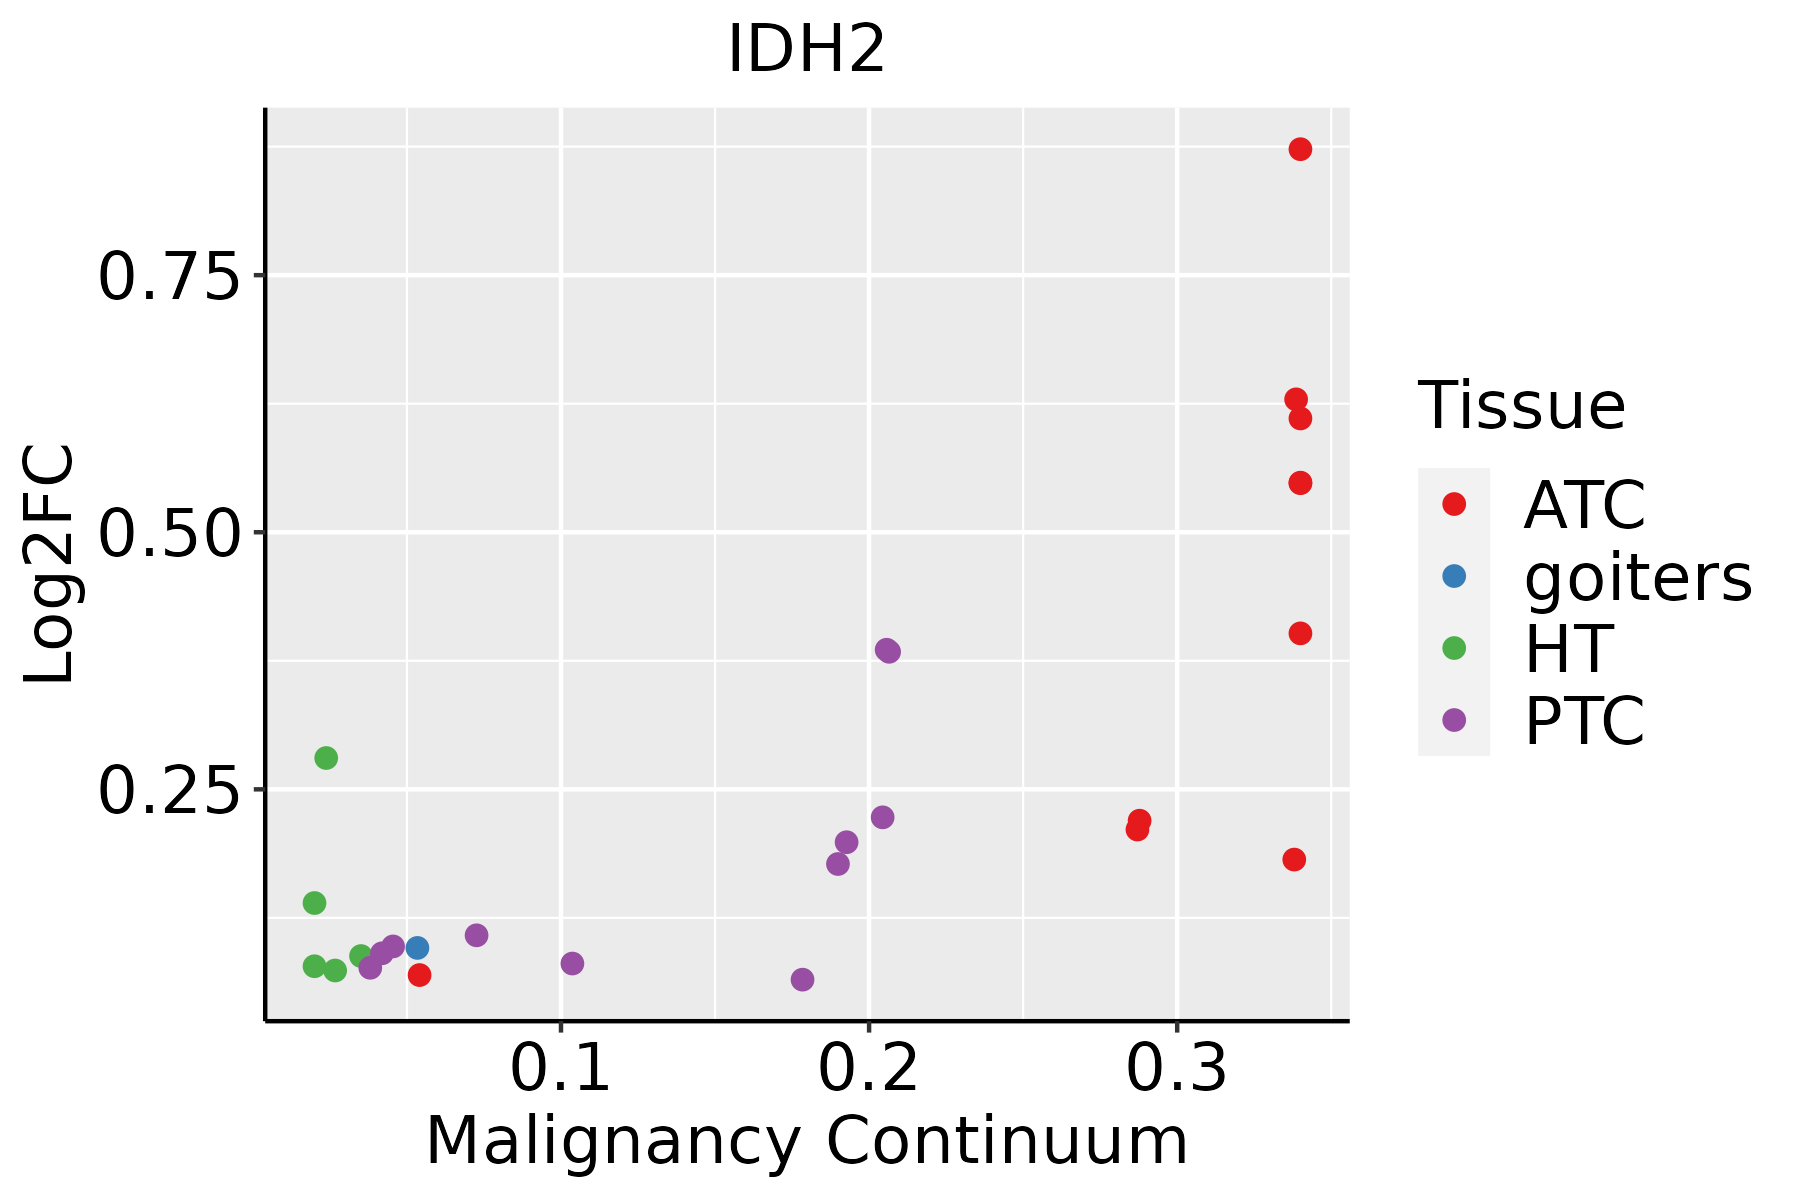 | ATC: Anaplastic thyroid cancer |
| HT: Hashimoto's thyroiditis | ||
| PTC: Papillary thyroid cancer |
| ∗log2FC in expression of this searched gene in stem-like cells from each diseased tissue sample relative to stem-like cells in normal samples in each tissue plotted against the malignancy continuum. Samples are colored based on if they are from different disease stage. |
Top |
Malignant transformation related pathway analysis |
| Find out the enriched GO biological processes and KEGG pathways involved in transition from healthy to precancer to cancer |
| Tissue | Disease Stage | Enriched GO biological Processes |
| Colorectum | AD |  |
| Colorectum | SER |  |
| Colorectum | MSS |  |
| Colorectum | MSI-H |  |
| Colorectum | FAP |  |
| ∗Top 15 enriched GO BP terms are showed in the bar plot of each disease state in each tissue. Each row represents a significant GO biological process which is colored according to the -log10(p.adjust). |
| Page: 1 2 3 4 5 6 7 8 9 |
| GO ID | Tissue | Disease Stage | Description | Gene Ratio | Bg Ratio | pvalue | p.adjust | Count |
| GO:00090608 | Breast | Precancer | aerobic respiration | 58/1080 | 189/18723 | 5.69e-27 | 7.62e-24 | 58 |
| GO:00060918 | Breast | Precancer | generation of precursor metabolites and energy | 94/1080 | 490/18723 | 1.54e-25 | 1.64e-22 | 94 |
| GO:00453338 | Breast | Precancer | cellular respiration | 59/1080 | 230/18723 | 5.97e-23 | 5.32e-20 | 59 |
| GO:00159808 | Breast | Precancer | energy derivation by oxidation of organic compounds | 70/1080 | 318/18723 | 8.33e-23 | 6.37e-20 | 70 |
| GO:00091179 | Breast | Precancer | nucleotide metabolic process | 56/1080 | 489/18723 | 7.40e-07 | 3.00e-05 | 56 |
| GO:00067539 | Breast | Precancer | nucleoside phosphate metabolic process | 56/1080 | 497/18723 | 1.24e-06 | 4.70e-05 | 56 |
| GO:00091655 | Breast | Precancer | nucleotide biosynthetic process | 32/1080 | 254/18723 | 2.72e-05 | 6.21e-04 | 32 |
| GO:19012935 | Breast | Precancer | nucleoside phosphate biosynthetic process | 32/1080 | 256/18723 | 3.18e-05 | 6.97e-04 | 32 |
| GO:00420633 | Breast | Precancer | gliogenesis | 33/1080 | 301/18723 | 3.06e-04 | 4.40e-03 | 33 |
| GO:00507086 | Breast | Precancer | regulation of protein secretion | 28/1080 | 268/18723 | 1.76e-03 | 1.74e-02 | 28 |
| GO:00716926 | Breast | Precancer | protein localization to extracellular region | 34/1080 | 368/18723 | 4.65e-03 | 3.58e-02 | 34 |
| GO:00093067 | Breast | Precancer | protein secretion | 33/1080 | 359/18723 | 5.65e-03 | 4.08e-02 | 33 |
| GO:00355927 | Breast | Precancer | establishment of protein localization to extracellular region | 33/1080 | 360/18723 | 5.89e-03 | 4.21e-02 | 33 |
| GO:000906013 | Breast | IDC | aerobic respiration | 61/1434 | 189/18723 | 4.42e-23 | 6.27e-20 | 61 |
| GO:000609113 | Breast | IDC | generation of precursor metabolites and energy | 103/1434 | 490/18723 | 1.53e-21 | 1.74e-18 | 103 |
| GO:004533313 | Breast | IDC | cellular respiration | 62/1434 | 230/18723 | 5.98e-19 | 4.25e-16 | 62 |
| GO:001598013 | Breast | IDC | energy derivation by oxidation of organic compounds | 73/1434 | 318/18723 | 8.70e-18 | 3.80e-15 | 73 |
| GO:000675313 | Breast | IDC | nucleoside phosphate metabolic process | 68/1434 | 497/18723 | 2.01e-06 | 8.23e-05 | 68 |
| GO:000911713 | Breast | IDC | nucleotide metabolic process | 67/1434 | 489/18723 | 2.28e-06 | 9.05e-05 | 67 |
| GO:190129313 | Breast | IDC | nucleoside phosphate biosynthetic process | 41/1434 | 256/18723 | 5.15e-06 | 1.73e-04 | 41 |
| Page: 1 2 3 4 5 6 7 8 9 10 11 12 13 14 15 16 17 18 19 |
| Pathway ID | Tissue | Disease Stage | Description | Gene Ratio | Bg Ratio | pvalue | p.adjust | qvalue | Count |
| hsa0048010 | Breast | Precancer | Glutathione metabolism | 12/684 | 57/8465 | 1.68e-03 | 1.08e-02 | 8.30e-03 | 12 |
| hsa052309 | Breast | Precancer | Central carbon metabolism in cancer | 13/684 | 70/8465 | 3.57e-03 | 2.17e-02 | 1.66e-02 | 13 |
| hsa0120012 | Breast | Precancer | Carbon metabolism | 18/684 | 115/8465 | 4.79e-03 | 2.75e-02 | 2.11e-02 | 18 |
| hsa0048013 | Breast | Precancer | Glutathione metabolism | 12/684 | 57/8465 | 1.68e-03 | 1.08e-02 | 8.30e-03 | 12 |
| hsa0523012 | Breast | Precancer | Central carbon metabolism in cancer | 13/684 | 70/8465 | 3.57e-03 | 2.17e-02 | 1.66e-02 | 13 |
| hsa0120013 | Breast | Precancer | Carbon metabolism | 18/684 | 115/8465 | 4.79e-03 | 2.75e-02 | 2.11e-02 | 18 |
| hsa0048023 | Breast | IDC | Glutathione metabolism | 13/867 | 57/8465 | 4.25e-03 | 2.56e-02 | 1.91e-02 | 13 |
| hsa0048033 | Breast | IDC | Glutathione metabolism | 13/867 | 57/8465 | 4.25e-03 | 2.56e-02 | 1.91e-02 | 13 |
| hsa0048041 | Breast | DCIS | Glutathione metabolism | 13/846 | 57/8465 | 3.44e-03 | 1.98e-02 | 1.46e-02 | 13 |
| hsa0048051 | Breast | DCIS | Glutathione metabolism | 13/846 | 57/8465 | 3.44e-03 | 1.98e-02 | 1.46e-02 | 13 |
| hsa01200 | Colorectum | AD | Carbon metabolism | 55/2092 | 115/8465 | 5.53e-08 | 8.42e-07 | 5.37e-07 | 55 |
| hsa05230 | Colorectum | AD | Central carbon metabolism in cancer | 33/2092 | 70/8465 | 3.61e-05 | 3.19e-04 | 2.03e-04 | 33 |
| hsa00480 | Colorectum | AD | Glutathione metabolism | 23/2092 | 57/8465 | 6.52e-03 | 2.76e-02 | 1.76e-02 | 23 |
| hsa01230 | Colorectum | AD | Biosynthesis of amino acids | 28/2092 | 75/8465 | 9.99e-03 | 3.89e-02 | 2.48e-02 | 28 |
| hsa012001 | Colorectum | AD | Carbon metabolism | 55/2092 | 115/8465 | 5.53e-08 | 8.42e-07 | 5.37e-07 | 55 |
| hsa052301 | Colorectum | AD | Central carbon metabolism in cancer | 33/2092 | 70/8465 | 3.61e-05 | 3.19e-04 | 2.03e-04 | 33 |
| hsa004801 | Colorectum | AD | Glutathione metabolism | 23/2092 | 57/8465 | 6.52e-03 | 2.76e-02 | 1.76e-02 | 23 |
| hsa012301 | Colorectum | AD | Biosynthesis of amino acids | 28/2092 | 75/8465 | 9.99e-03 | 3.89e-02 | 2.48e-02 | 28 |
| hsa000202 | Colorectum | SER | Citrate cycle (TCA cycle) | 16/1580 | 30/8465 | 2.06e-05 | 2.74e-04 | 1.99e-04 | 16 |
| hsa012002 | Colorectum | SER | Carbon metabolism | 40/1580 | 115/8465 | 2.77e-05 | 3.41e-04 | 2.47e-04 | 40 |
| Page: 1 2 3 4 5 6 |
Top |
Cell-cell communication analysis |
| Identification of potential cell-cell interactions between two cell types and their ligand-receptor pairs for different disease states |
| Ligand | Receptor | LRpair | Pathway | Tissue | Disease Stage |
| Page: 1 |
Top |
Single-cell gene regulatory network inference analysis |
| Find out the significant the regulons (TFs) and the target genes of each regulon across cell types for different disease states |
| TF | Cell Type | Tissue | Disease Stage | Target Gene | RSS | Regulon Activity |
| ∗The dot plots of a searched regulon are shown for all cell subpopulations in each disease state of each tissue based on the regulon specific score inferred using pySCENIC and by calculating the average expression. |
| Page: 1 |
Top |
Somatic mutation of malignant transformation related genes |
| Annotation of somatic variants for genes involved in malignant transformation |
| Hugo Symbol | Variant Class | Variant Classification | dbSNP RS | HGVSc | HGVSp | HGVSp Short | SWISSPROT | BIOTYPE | SIFT | PolyPhen | Tumor Sample Barcode | Tissue | Histology | Sex | Age | Stage | Therapy Types | Drugs | Outcome |
| IDH2 | SNV | Missense_Mutation | rs770548230 | c.1054N>C | p.Thr352Pro | p.T352P | P48735 | protein_coding | deleterious_low_confidence(0) | probably_damaging(0.985) | TCGA-B6-A40B-01 | Breast | breast invasive carcinoma | Female | >=65 | I/II | Unknown | Unknown | SD |
| IDH2 | SNV | Missense_Mutation | rs770548230 | c.1054N>C | p.Thr352Pro | p.T352P | P48735 | protein_coding | deleterious_low_confidence(0) | probably_damaging(0.985) | TCGA-EW-A423-01 | Breast | breast invasive carcinoma | Female | >=65 | I/II | Hormone Therapy | anastrozole | SD |
| IDH2 | deletion | Frame_Shift_Del | novel | c.1182delN | p.Phe394LeufsTer18 | p.F394Lfs*18 | P48735 | protein_coding | TCGA-D8-A27V-01 | Breast | breast invasive carcinoma | Female | <65 | I/II | Hormone Therapy | tamoxiphen | SD | ||
| IDH2 | SNV | Missense_Mutation | rs781481805 | c.1247N>T | p.Ala416Val | p.A416V | P48735 | protein_coding | deleterious_low_confidence(0.01) | benign(0.43) | TCGA-2W-A8YY-01 | Cervix | cervical & endocervical cancer | Female | <65 | I/II | Chemotherapy | cisplatin | CR |
| IDH2 | SNV | Missense_Mutation | rs267606870 | c.418C>T | p.Arg140Trp | p.R140W | P48735 | protein_coding | deleterious_low_confidence(0) | probably_damaging(1) | TCGA-AA-3672-01 | Colorectum | colon adenocarcinoma | Female | >=65 | III/IV | Unknown | Unknown | SD |
| IDH2 | SNV | Missense_Mutation | c.1322N>C | p.Ile441Thr | p.I441T | P48735 | protein_coding | deleterious_low_confidence(0) | probably_damaging(0.948) | TCGA-AA-3715-01 | Colorectum | colon adenocarcinoma | Male | >=65 | I/II | Unknown | Unknown | PD | |
| IDH2 | SNV | Missense_Mutation | rs201173543 | c.140N>T | p.Ala47Val | p.A47V | P48735 | protein_coding | tolerated_low_confidence(0.13) | benign(0.012) | TCGA-AA-3833-01 | Colorectum | colon adenocarcinoma | Female | <65 | I/II | Unknown | Unknown | SD |
| IDH2 | SNV | Missense_Mutation | rs781481805 | c.1247N>T | p.Ala416Val | p.A416V | P48735 | protein_coding | deleterious_low_confidence(0.01) | benign(0.43) | TCGA-AA-A01Z-01 | Colorectum | colon adenocarcinoma | Male | >=65 | I/II | Unknown | Unknown | PD |
| IDH2 | SNV | Missense_Mutation | c.992N>T | p.Thr331Met | p.T331M | P48735 | protein_coding | deleterious_low_confidence(0) | probably_damaging(0.998) | TCGA-AA-A022-01 | Colorectum | colon adenocarcinoma | Female | >=65 | I/II | Unknown | Unknown | SD | |
| IDH2 | SNV | Missense_Mutation | c.560N>T | p.Asp187Val | p.D187V | P48735 | protein_coding | deleterious_low_confidence(0.01) | benign(0.117) | TCGA-AD-6889-01 | Colorectum | colon adenocarcinoma | Male | >=65 | I/II | Chemotherapy | xeloda | PD |
| Page: 1 2 3 4 5 |
Top |
Related drugs of malignant transformation related genes |
| Identification of chemicals and drugs interact with genes involved in malignant transfromation |
| (DGIdb 4.0) |
| Entrez ID | Symbol | Category | Interaction Types | Drug Claim Name | Drug Name | PMIDs |
| 3418 | IDH2 | CLINICALLY ACTIONABLE, ENZYME | AG-881 | |||
| 3418 | IDH2 | CLINICALLY ACTIONABLE, ENZYME | AGI-6780 | 23558173 | ||
| 3418 | IDH2 | CLINICALLY ACTIONABLE, ENZYME | enasidenib | ENASIDENIB | ||
| 3418 | IDH2 | CLINICALLY ACTIONABLE, ENZYME | Enasidenib | ENASIDENIB | ||
| 3418 | IDH2 | CLINICALLY ACTIONABLE, ENZYME | VENETOCLAX | VENETOCLAX | 30725494 | |
| 3418 | IDH2 | CLINICALLY ACTIONABLE, ENZYME | Enasidenib | ENASIDENIB | 28588020,28193778 | |
| 3418 | IDH2 | CLINICALLY ACTIONABLE, ENZYME | ENASIDENIB | ENASIDENIB | 28588020,28193778 | |
| 3418 | IDH2 | CLINICALLY ACTIONABLE, ENZYME | inhibitor | 404859110 | ||
| 3418 | IDH2 | CLINICALLY ACTIONABLE, ENZYME | Venetoclax | VENETOCLAX | 27520294 | |
| 3418 | IDH2 | CLINICALLY ACTIONABLE, ENZYME | Venetoclax | VENETOCLAX |
| Page: 1 2 |

Copyright 2023-Present -The University of Texas Health Science Center at Houston |