| Tissue | Expression Dynamics | Abbreviation |
| Colorectum (GSE201348) |  | FAP: Familial adenomatous polyposis |
| CRC: Colorectal cancer |
| Colorectum (HTA11) |  | AD: Adenomas |
| SER: Sessile serrated lesions |
| MSI-H: Microsatellite-high colorectal cancer |
| MSS: Microsatellite stable colorectal cancer |
| Esophagus | 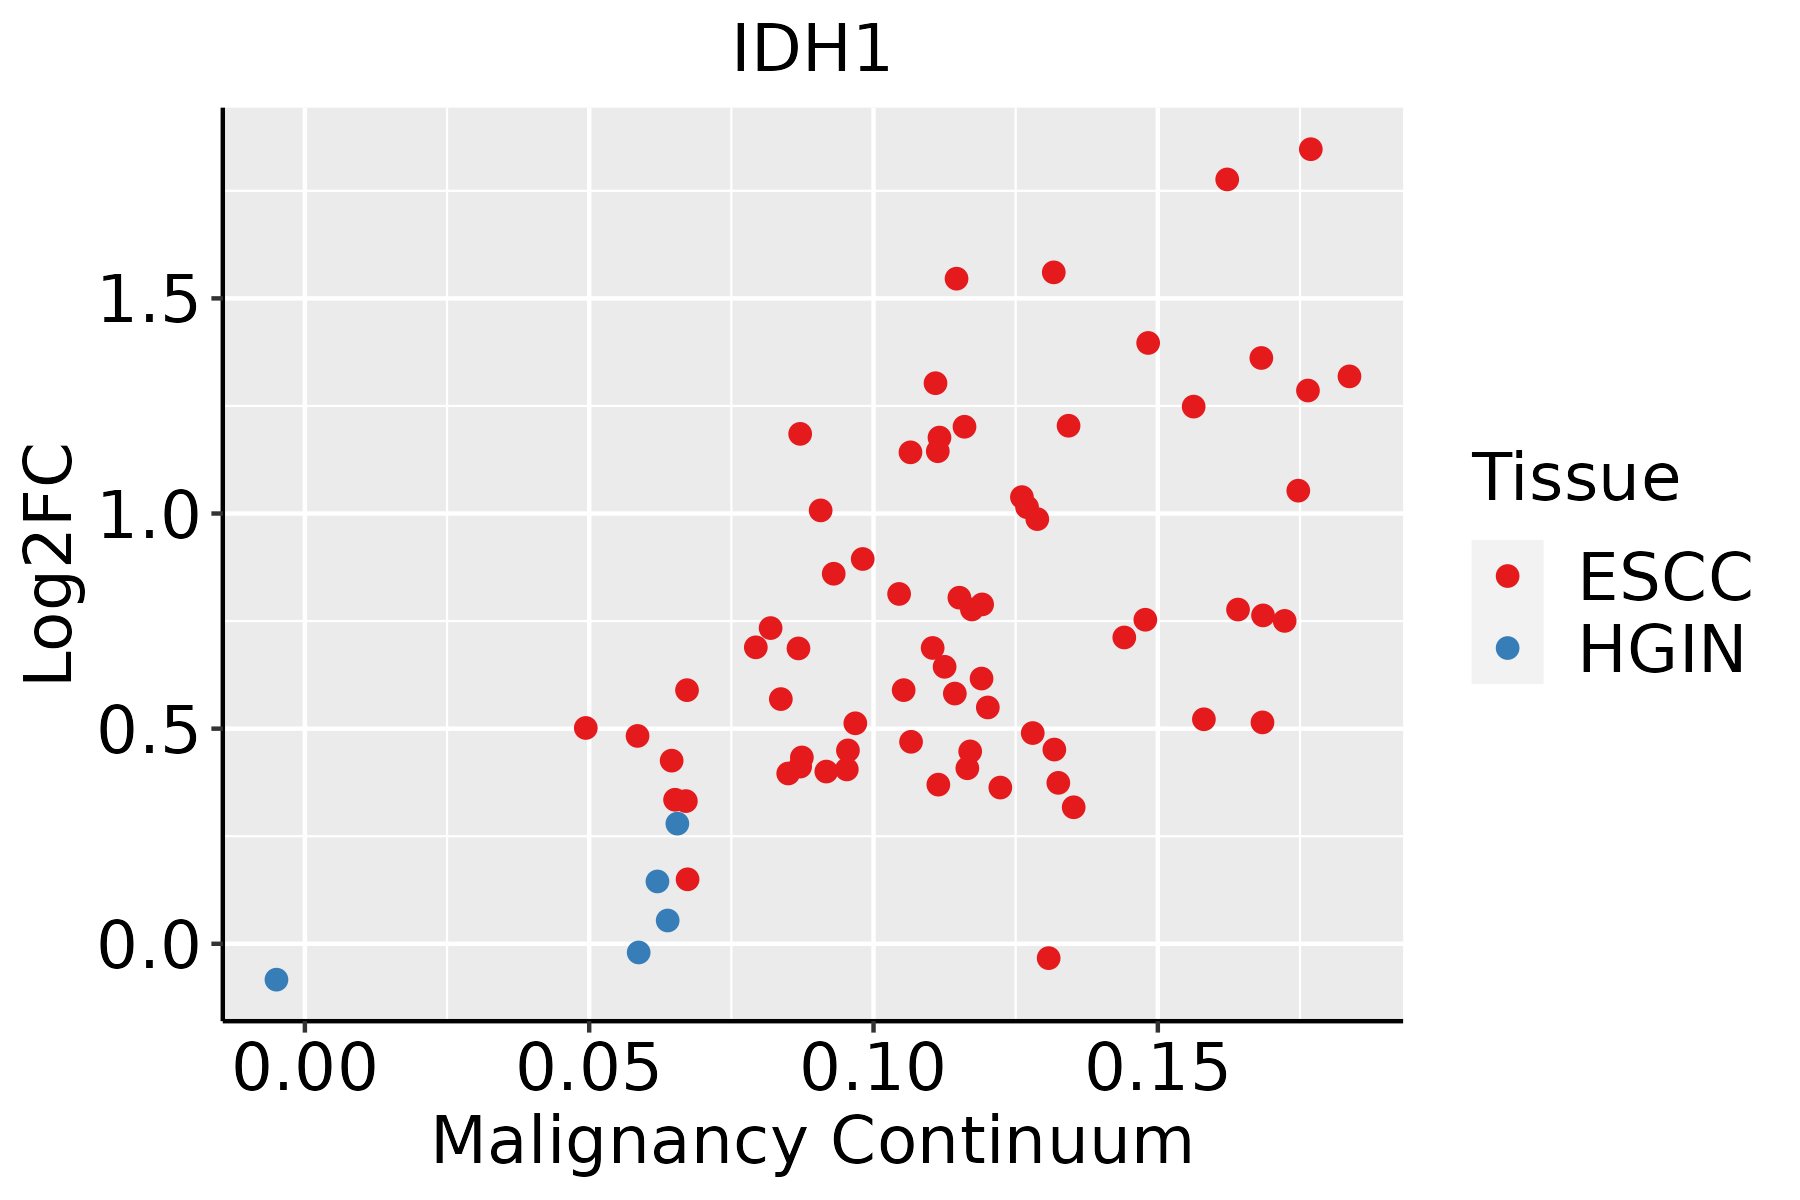 | ESCC: Esophageal squamous cell carcinoma |
| HGIN: High-grade intraepithelial neoplasias |
| LGIN: Low-grade intraepithelial neoplasias |
| Liver | 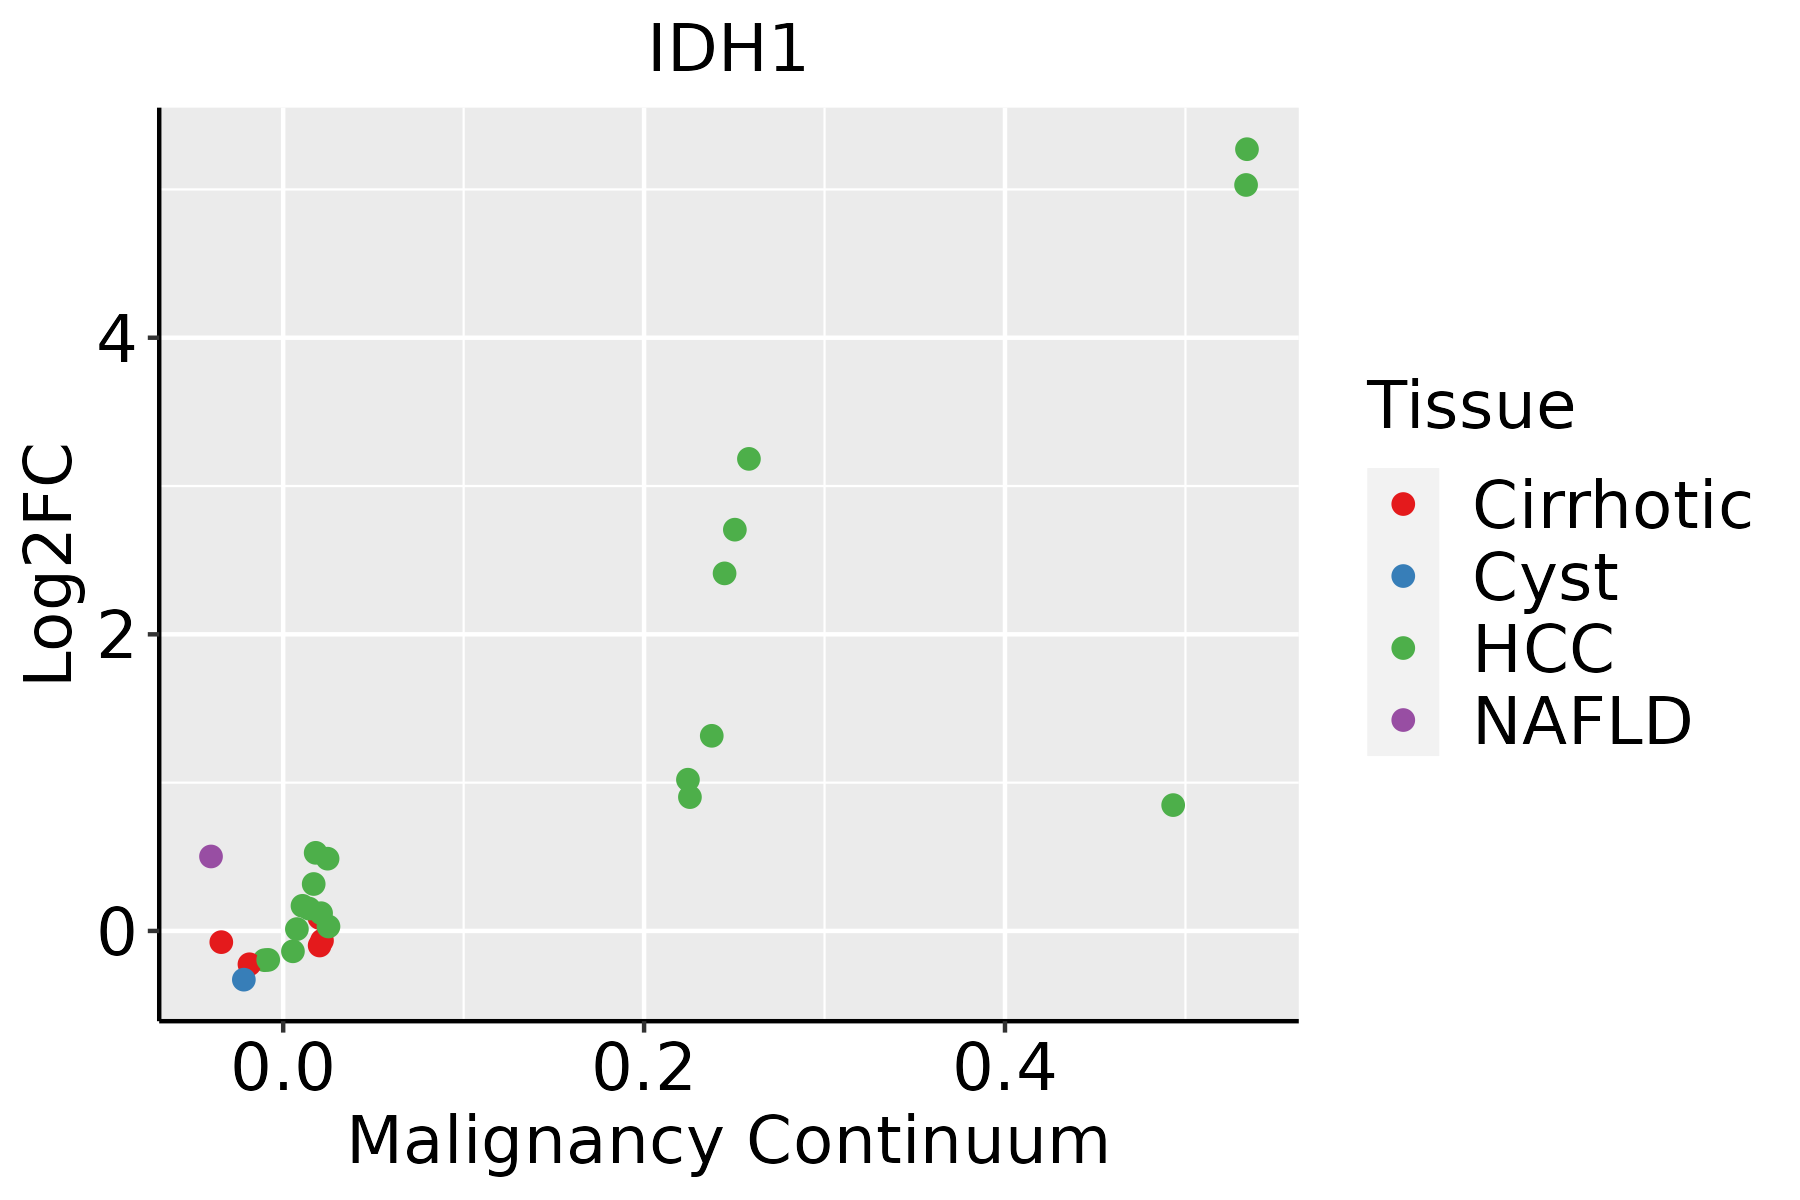 | HCC: Hepatocellular carcinoma |
| NAFLD: Non-alcoholic fatty liver disease |
| Oral Cavity | 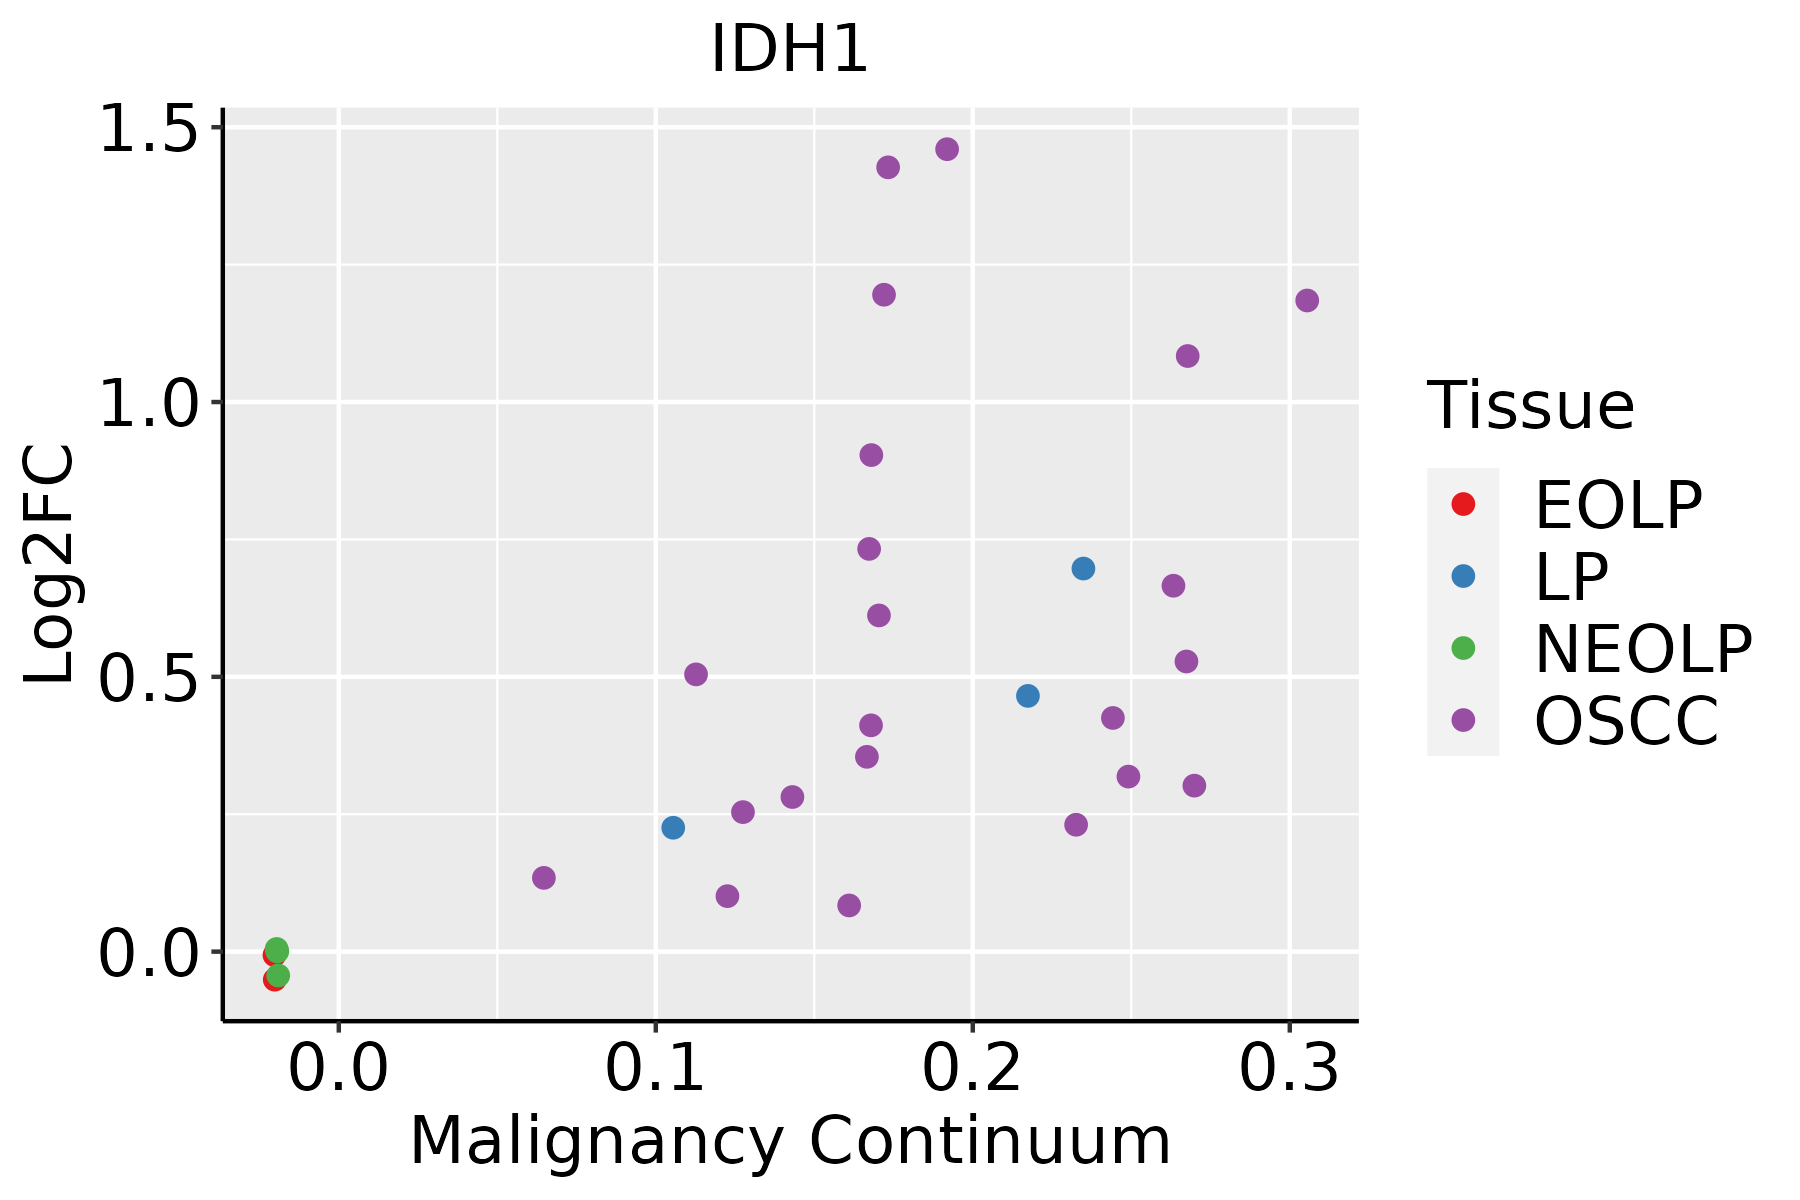 | EOLP: Erosive Oral lichen planus |
| LP: leukoplakia |
| NEOLP: Non-erosive oral lichen planus |
| OSCC: Oral squamous cell carcinoma |
| Prostate | 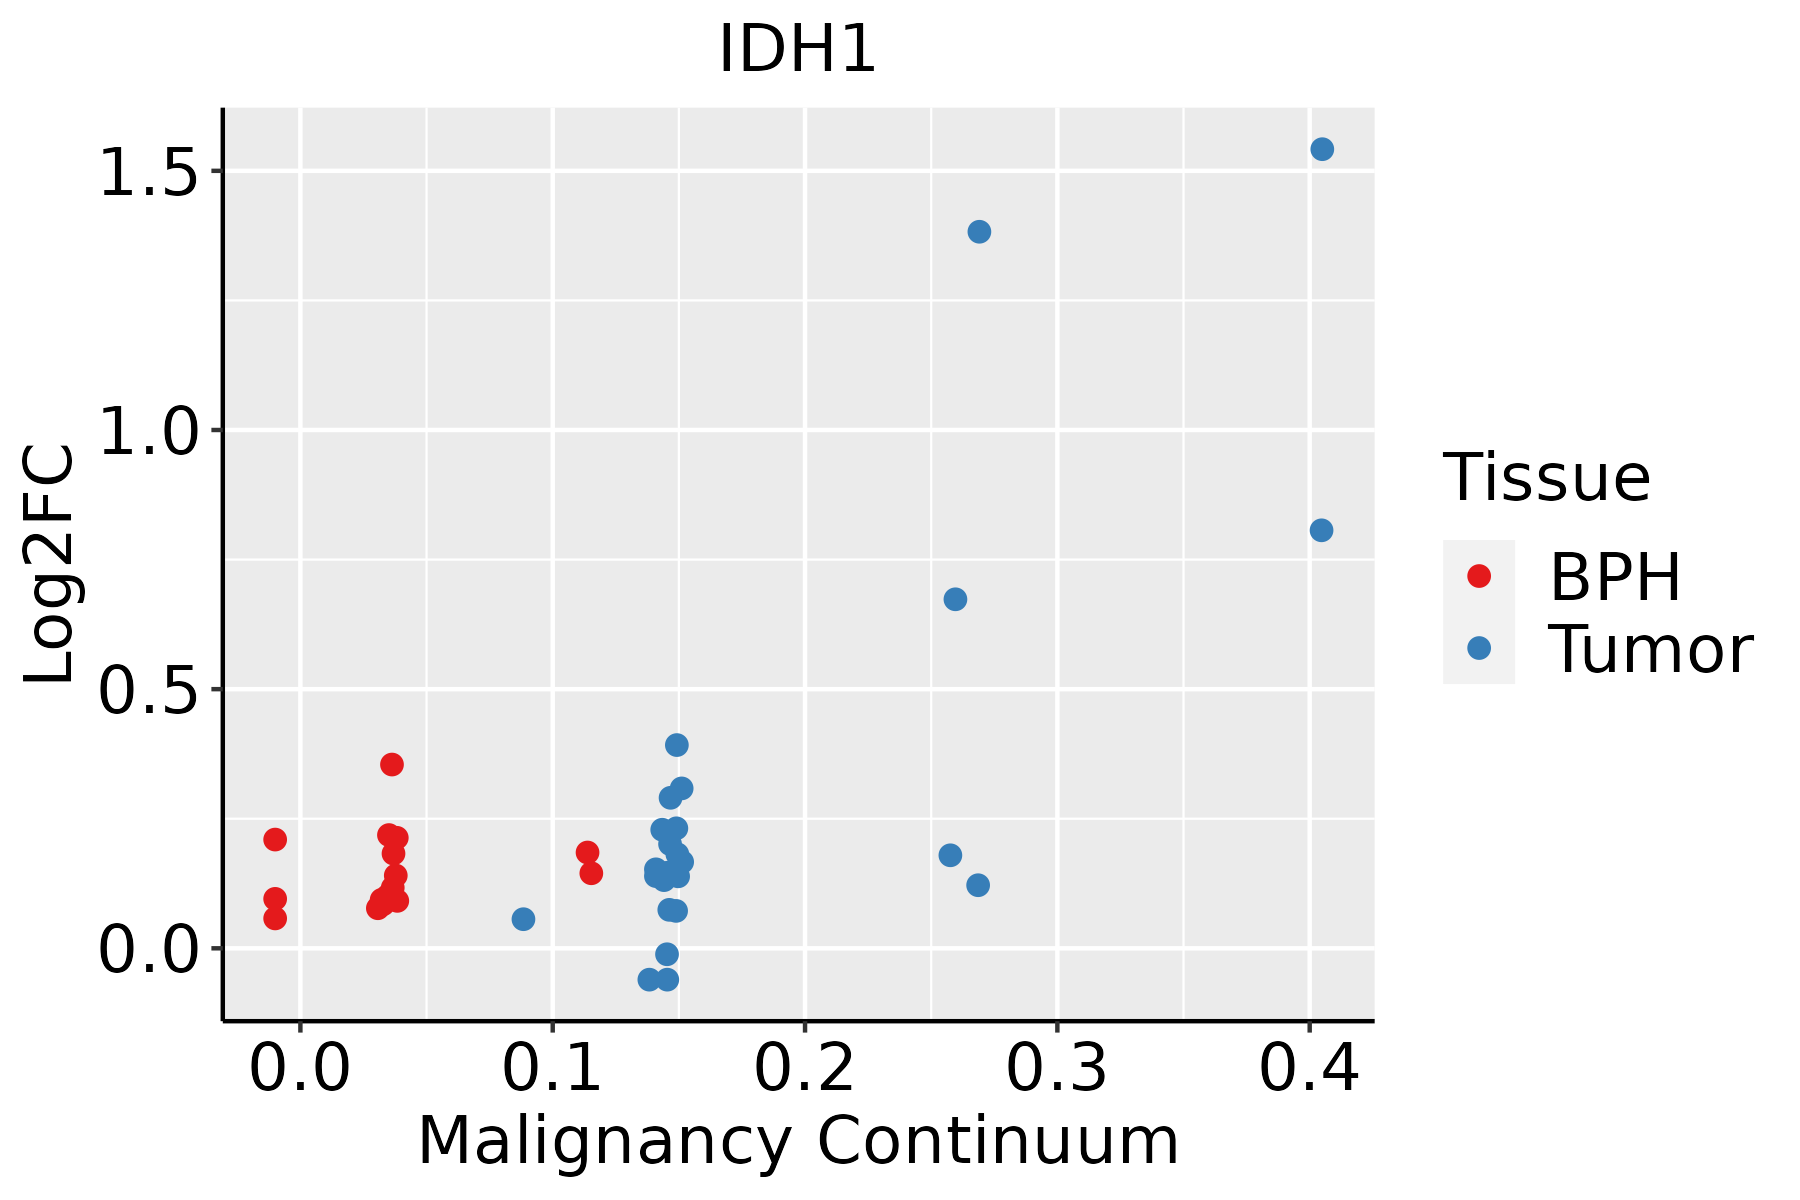 | BPH: Benign Prostatic Hyperplasia |
| Skin |  | AK: Actinic keratosis |
| cSCC: Cutaneous squamous cell carcinoma |
| SCCIS:squamous cell carcinoma in situ |
| Thyroid |  | ATC: Anaplastic thyroid cancer |
| HT: Hashimoto's thyroiditis |
| PTC: Papillary thyroid cancer |
| GO ID | Tissue | Disease Stage | Description | Gene Ratio | Bg Ratio | pvalue | p.adjust | Count |
| GO:0006091 | Colorectum | AD | generation of precursor metabolites and energy | 209/3918 | 490/18723 | 3.17e-28 | 6.61e-25 | 209 |
| GO:0009060 | Colorectum | AD | aerobic respiration | 108/3918 | 189/18723 | 9.14e-28 | 1.43e-24 | 108 |
| GO:0045333 | Colorectum | AD | cellular respiration | 119/3918 | 230/18723 | 3.21e-25 | 4.02e-22 | 119 |
| GO:0015980 | Colorectum | AD | energy derivation by oxidation of organic compounds | 143/3918 | 318/18723 | 2.78e-22 | 2.49e-19 | 143 |
| GO:0006979 | Colorectum | AD | response to oxidative stress | 145/3918 | 446/18723 | 5.16e-09 | 3.23e-07 | 145 |
| GO:0006099 | Colorectum | AD | tricarboxylic acid cycle | 19/3918 | 30/18723 | 5.82e-07 | 2.09e-05 | 19 |
| GO:0048545 | Colorectum | AD | response to steroid hormone | 104/3918 | 339/18723 | 1.33e-05 | 2.90e-04 | 104 |
| GO:0006066 | Colorectum | AD | alcohol metabolic process | 106/3918 | 353/18723 | 3.02e-05 | 5.57e-04 | 106 |
| GO:0016042 | Colorectum | AD | lipid catabolic process | 97/3918 | 320/18723 | 4.31e-05 | 7.56e-04 | 97 |
| GO:0044262 | Colorectum | AD | cellular carbohydrate metabolic process | 87/3918 | 283/18723 | 6.00e-05 | 1.01e-03 | 87 |
| GO:0006790 | Colorectum | AD | sulfur compound metabolic process | 101/3918 | 339/18723 | 6.46e-05 | 1.07e-03 | 101 |
| GO:0044242 | Colorectum | AD | cellular lipid catabolic process | 66/3918 | 214/18723 | 3.96e-04 | 4.50e-03 | 66 |
| GO:0006575 | Colorectum | AD | cellular modified amino acid metabolic process | 59/3918 | 188/18723 | 4.80e-04 | 5.27e-03 | 59 |
| GO:0043648 | Colorectum | AD | dicarboxylic acid metabolic process | 34/3918 | 96/18723 | 7.22e-04 | 7.28e-03 | 34 |
| GO:0061458 | Colorectum | AD | reproductive system development | 116/3918 | 427/18723 | 1.11e-03 | 1.01e-02 | 116 |
| GO:0048608 | Colorectum | AD | reproductive structure development | 114/3918 | 424/18723 | 1.78e-03 | 1.47e-02 | 114 |
| GO:0006081 | Colorectum | AD | cellular aldehyde metabolic process | 22/3918 | 60/18723 | 3.64e-03 | 2.60e-02 | 22 |
| GO:0006644 | Colorectum | AD | phospholipid metabolic process | 101/3918 | 383/18723 | 5.80e-03 | 3.67e-02 | 101 |
| GO:00090602 | Colorectum | MSS | aerobic respiration | 98/3467 | 189/18723 | 3.35e-25 | 1.05e-21 | 98 |
| GO:00060912 | Colorectum | MSS | generation of precursor metabolites and energy | 186/3467 | 490/18723 | 1.14e-24 | 2.15e-21 | 186 |
| Pathway ID | Tissue | Disease Stage | Description | Gene Ratio | Bg Ratio | pvalue | p.adjust | qvalue | Count |
| hsa01200 | Colorectum | AD | Carbon metabolism | 55/2092 | 115/8465 | 5.53e-08 | 8.42e-07 | 5.37e-07 | 55 |
| hsa00020 | Colorectum | AD | Citrate cycle (TCA cycle) | 20/2092 | 30/8465 | 1.43e-06 | 1.77e-05 | 1.13e-05 | 20 |
| hsa05230 | Colorectum | AD | Central carbon metabolism in cancer | 33/2092 | 70/8465 | 3.61e-05 | 3.19e-04 | 2.03e-04 | 33 |
| hsa00480 | Colorectum | AD | Glutathione metabolism | 23/2092 | 57/8465 | 6.52e-03 | 2.76e-02 | 1.76e-02 | 23 |
| hsa01230 | Colorectum | AD | Biosynthesis of amino acids | 28/2092 | 75/8465 | 9.99e-03 | 3.89e-02 | 2.48e-02 | 28 |
| hsa012001 | Colorectum | AD | Carbon metabolism | 55/2092 | 115/8465 | 5.53e-08 | 8.42e-07 | 5.37e-07 | 55 |
| hsa000201 | Colorectum | AD | Citrate cycle (TCA cycle) | 20/2092 | 30/8465 | 1.43e-06 | 1.77e-05 | 1.13e-05 | 20 |
| hsa052301 | Colorectum | AD | Central carbon metabolism in cancer | 33/2092 | 70/8465 | 3.61e-05 | 3.19e-04 | 2.03e-04 | 33 |
| hsa004801 | Colorectum | AD | Glutathione metabolism | 23/2092 | 57/8465 | 6.52e-03 | 2.76e-02 | 1.76e-02 | 23 |
| hsa012301 | Colorectum | AD | Biosynthesis of amino acids | 28/2092 | 75/8465 | 9.99e-03 | 3.89e-02 | 2.48e-02 | 28 |
| hsa012004 | Colorectum | MSS | Carbon metabolism | 43/1875 | 115/8465 | 1.37e-04 | 1.17e-03 | 7.19e-04 | 43 |
| hsa000204 | Colorectum | MSS | Citrate cycle (TCA cycle) | 16/1875 | 30/8465 | 1.84e-04 | 1.47e-03 | 9.00e-04 | 16 |
| hsa004802 | Colorectum | MSS | Glutathione metabolism | 22/1875 | 57/8465 | 3.58e-03 | 1.64e-02 | 1.01e-02 | 22 |
| hsa052304 | Colorectum | MSS | Central carbon metabolism in cancer | 25/1875 | 70/8465 | 6.50e-03 | 2.64e-02 | 1.62e-02 | 25 |
| hsa012005 | Colorectum | MSS | Carbon metabolism | 43/1875 | 115/8465 | 1.37e-04 | 1.17e-03 | 7.19e-04 | 43 |
| hsa000205 | Colorectum | MSS | Citrate cycle (TCA cycle) | 16/1875 | 30/8465 | 1.84e-04 | 1.47e-03 | 9.00e-04 | 16 |
| hsa004803 | Colorectum | MSS | Glutathione metabolism | 22/1875 | 57/8465 | 3.58e-03 | 1.64e-02 | 1.01e-02 | 22 |
| hsa052305 | Colorectum | MSS | Central carbon metabolism in cancer | 25/1875 | 70/8465 | 6.50e-03 | 2.64e-02 | 1.62e-02 | 25 |
| hsa012006 | Colorectum | FAP | Carbon metabolism | 38/1404 | 115/8465 | 1.04e-05 | 1.44e-04 | 8.76e-05 | 38 |
| hsa052306 | Colorectum | FAP | Central carbon metabolism in cancer | 23/1404 | 70/8465 | 6.12e-04 | 4.26e-03 | 2.59e-03 | 23 |
| Hugo Symbol | Variant Class | Variant Classification | dbSNP RS | HGVSc | HGVSp | HGVSp Short | SWISSPROT | BIOTYPE | SIFT | PolyPhen | Tumor Sample Barcode | Tissue | Histology | Sex | Age | Stage | Therapy Types | Drugs | Outcome |
| IDH1 | SNV | Missense_Mutation | novel | c.453N>T | p.Lys151Asn | p.K151N | O75874 | protein_coding | deleterious_low_confidence(0) | possibly_damaging(0.48) | TCGA-A2-A0T0-01 | Breast | breast invasive carcinoma | Female | <65 | I/II | Chemotherapy | taxotere | SD |
| IDH1 | SNV | Missense_Mutation | | c.1013N>C | p.Arg338Thr | p.R338T | O75874 | protein_coding | deleterious_low_confidence(0.01) | possibly_damaging(0.74) | TCGA-AC-A23H-01 | Breast | breast invasive carcinoma | Female | >=65 | I/II | Unknown | Unknown | PD |
| IDH1 | SNV | Missense_Mutation | | c.243N>C | p.Lys81Asn | p.K81N | O75874 | protein_coding | tolerated_low_confidence(0.13) | benign(0.014) | TCGA-AC-A23H-01 | Breast | breast invasive carcinoma | Female | >=65 | I/II | Unknown | Unknown | PD |
| IDH1 | SNV | Missense_Mutation | | c.704N>G | p.Tyr235Cys | p.Y235C | O75874 | protein_coding | deleterious_low_confidence(0) | probably_damaging(1) | TCGA-BH-A0DD-01 | Breast | breast invasive carcinoma | Male | <65 | I/II | Chemotherapy | docetaxel | CR |
| IDH1 | SNV | Missense_Mutation | rs121913499 | c.394N>T | p.Arg132Cys | p.R132C | O75874 | protein_coding | deleterious_low_confidence(0.03) | benign(0.1) | TCGA-BH-A1FR-01 | Breast | breast invasive carcinoma | Female | >=65 | III/IV | Unknown | Unknown | PD |
| IDH1 | SNV | Missense_Mutation | rs121913500 | c.395N>A | p.Arg132His | p.R132H | O75874 | protein_coding | deleterious_low_confidence(0.01) | benign(0.047) | TCGA-S3-AA11-01 | Breast | breast invasive carcinoma | Female | >=65 | I/II | Hormone Therapy | letrozole | CR |
| IDH1 | SNV | Missense_Mutation | novel | c.544A>T | p.Met182Leu | p.M182L | O75874 | protein_coding | deleterious_low_confidence(0) | benign(0.228) | TCGA-AA-3947-01 | Colorectum | colon adenocarcinoma | Female | <65 | I/II | Unknown | Unknown | SD |
| IDH1 | SNV | Missense_Mutation | rs555882127 | c.97C>T | p.Pro33Ser | p.P33S | O75874 | protein_coding | deleterious_low_confidence(0.01) | probably_damaging(0.998) | TCGA-AA-3949-01 | Colorectum | colon adenocarcinoma | Female | >=65 | III/IV | Unknown | Unknown | SD |
| IDH1 | SNV | Missense_Mutation | rs781398075 | c.103G>A | p.Val35Met | p.V35M | O75874 | protein_coding | deleterious_low_confidence(0.01) | benign(0.129) | TCGA-AD-5900-01 | Colorectum | colon adenocarcinoma | Male | >=65 | I/II | Unknown | Unknown | SD |
| IDH1 | SNV | Missense_Mutation | | c.377N>G | p.Lys126Arg | p.K126R | O75874 | protein_coding | deleterious_low_confidence(0.03) | possibly_damaging(0.683) | TCGA-AZ-6598-01 | Colorectum | colon adenocarcinoma | Female | >=65 | I/II | Unknown | Unknown | SD |
| Entrez ID | Symbol | Category | Interaction Types | Drug Claim Name | Drug Name | PMIDs |
| 3417 | IDH1 | ENZYME, CLINICALLY ACTIONABLE | | BPTES | | 21045145 |
| 3417 | IDH1 | ENZYME, CLINICALLY ACTIONABLE | | GNF-PF-67 | CHEMBL578512 | |
| 3417 | IDH1 | ENZYME, CLINICALLY ACTIONABLE | | BAY1436032 | | 28232670 |
| 3417 | IDH1 | ENZYME, CLINICALLY ACTIONABLE | | CP-55940 | CP-55940 | |
| 3417 | IDH1 | ENZYME, CLINICALLY ACTIONABLE | | BI-87E7 | CHEMBL523200 | |
| 3417 | IDH1 | ENZYME, CLINICALLY ACTIONABLE | | 1-BENZYLMALEIMIDE | CHEMBL388979 | |
| 3417 | IDH1 | ENZYME, CLINICALLY ACTIONABLE | | VENETOCLAX | VENETOCLAX | 30725494 |
| 3417 | IDH1 | ENZYME, CLINICALLY ACTIONABLE | | CANDIDIN | CANDIDIN | |
| 3417 | IDH1 | ENZYME, CLINICALLY ACTIONABLE | | SANGUINARIUM CHLORIDE | SANGUINARIUM CHLORIDE | |
| 3417 | IDH1 | ENZYME, CLINICALLY ACTIONABLE | | DNDI1318477 | CHEMBL428064 | |


