| Tissue | Expression Dynamics | Abbreviation |
| Endometrium | 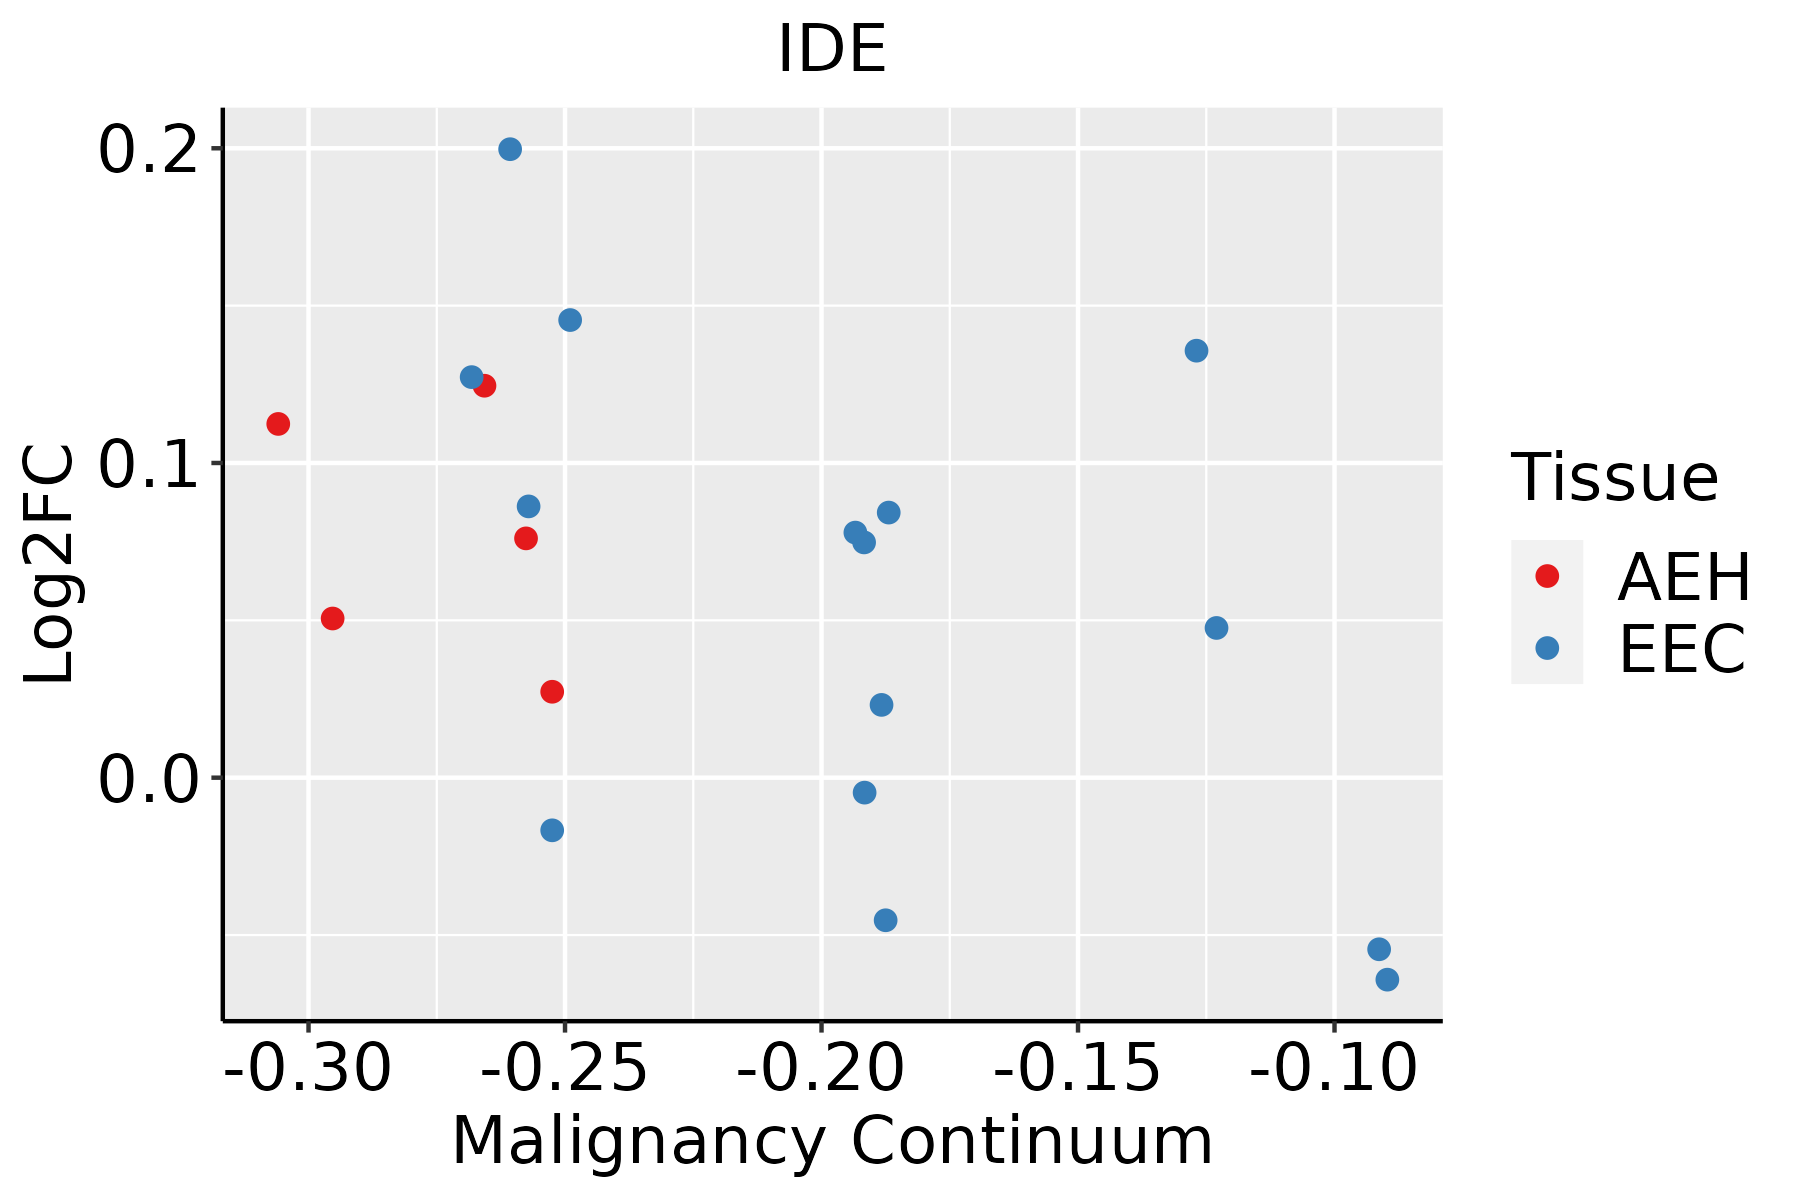 | AEH: Atypical endometrial hyperplasia |
| EEC: Endometrioid Cancer |
| Liver | 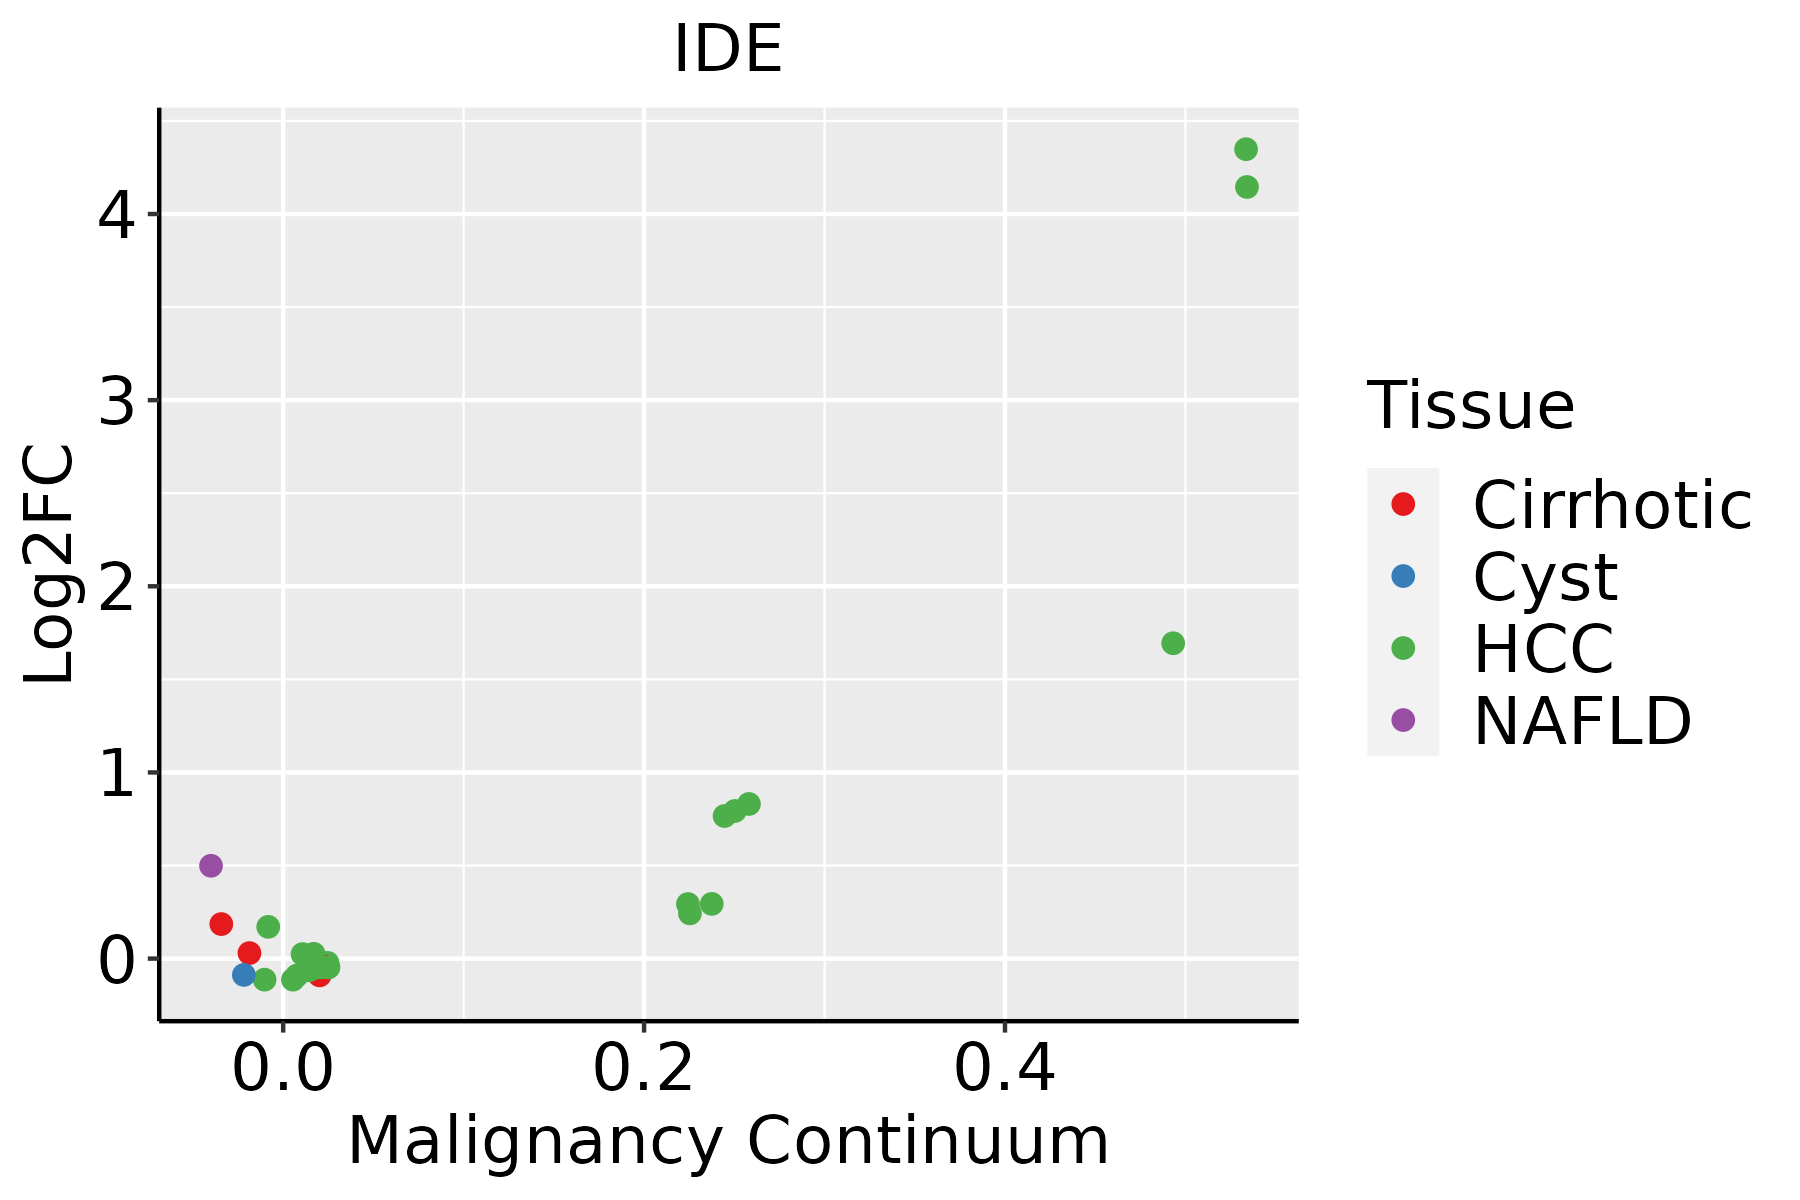 | HCC: Hepatocellular carcinoma |
| NAFLD: Non-alcoholic fatty liver disease |
| Oral Cavity | 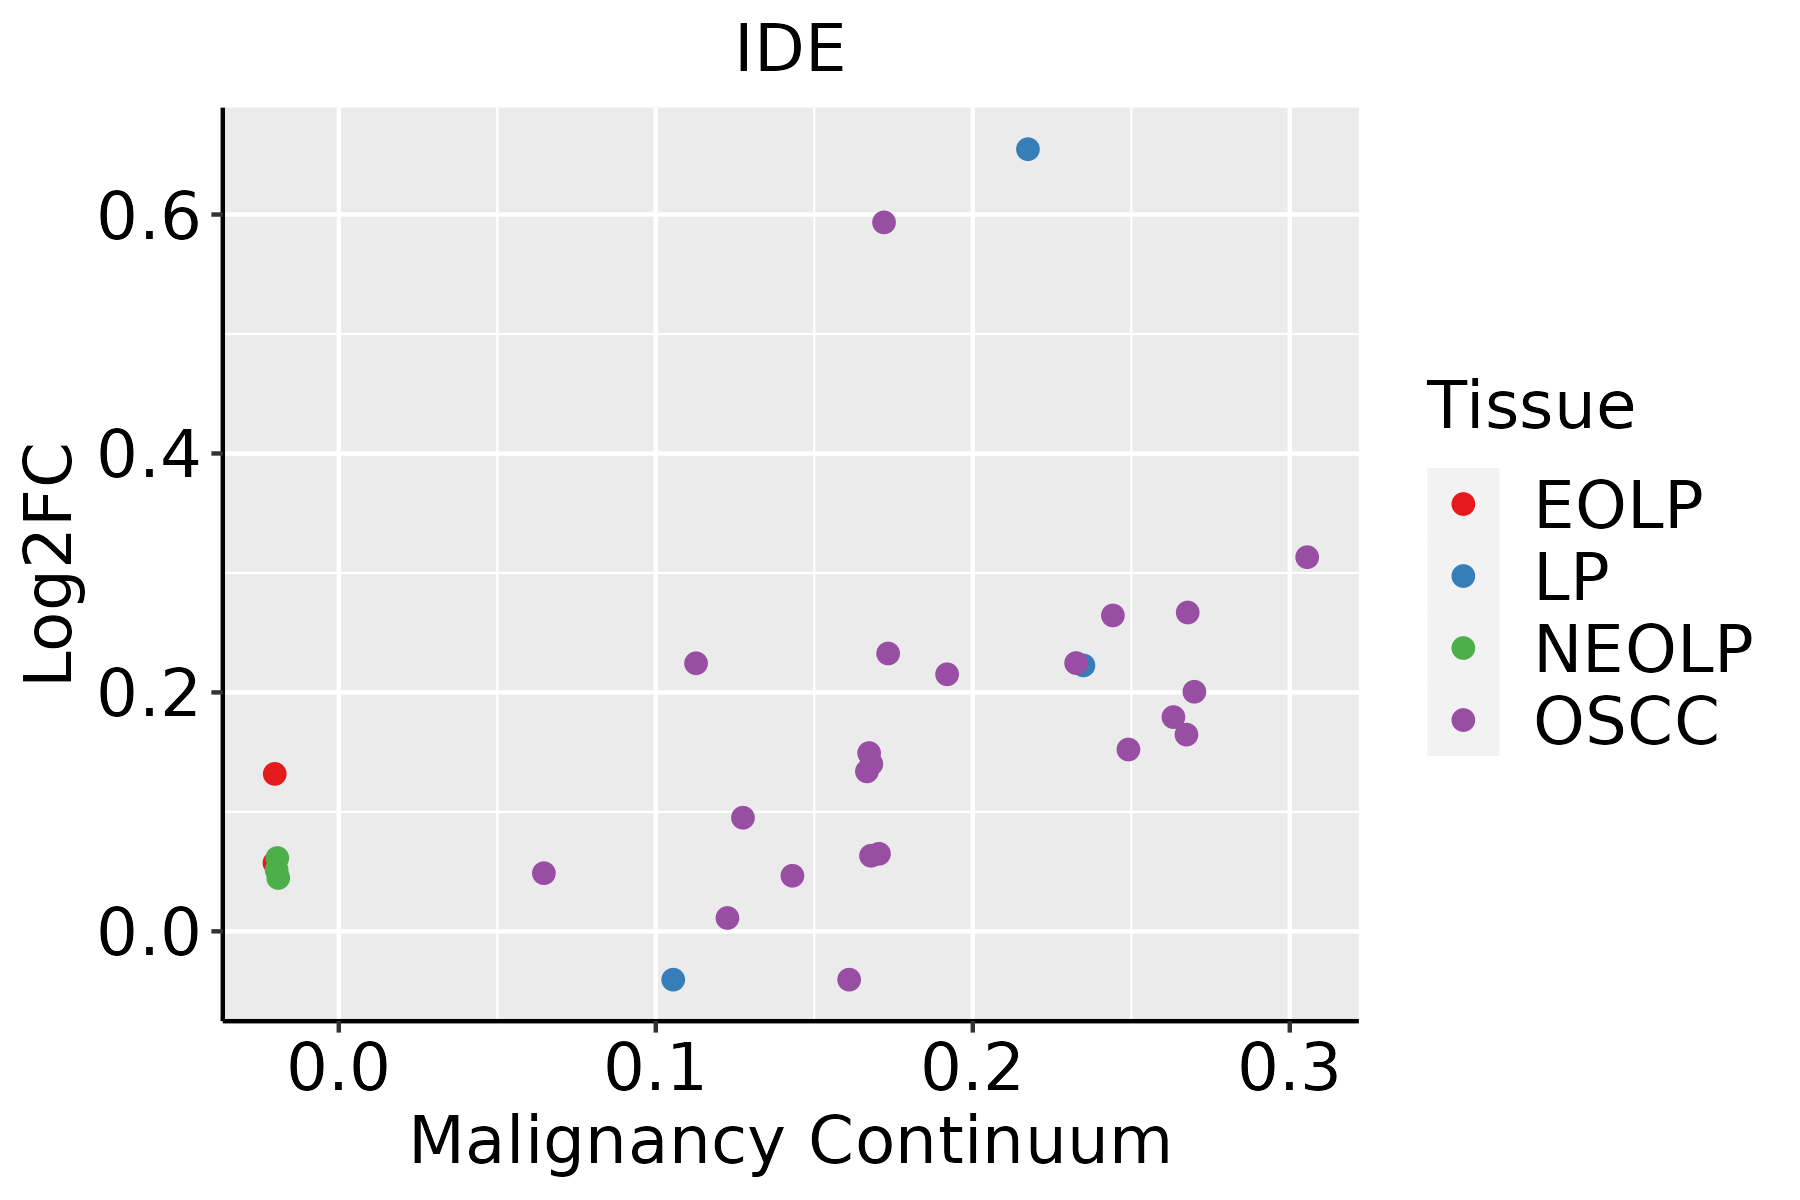 | EOLP: Erosive Oral lichen planus |
| LP: leukoplakia |
| NEOLP: Non-erosive oral lichen planus |
| OSCC: Oral squamous cell carcinoma |
| Thyroid | 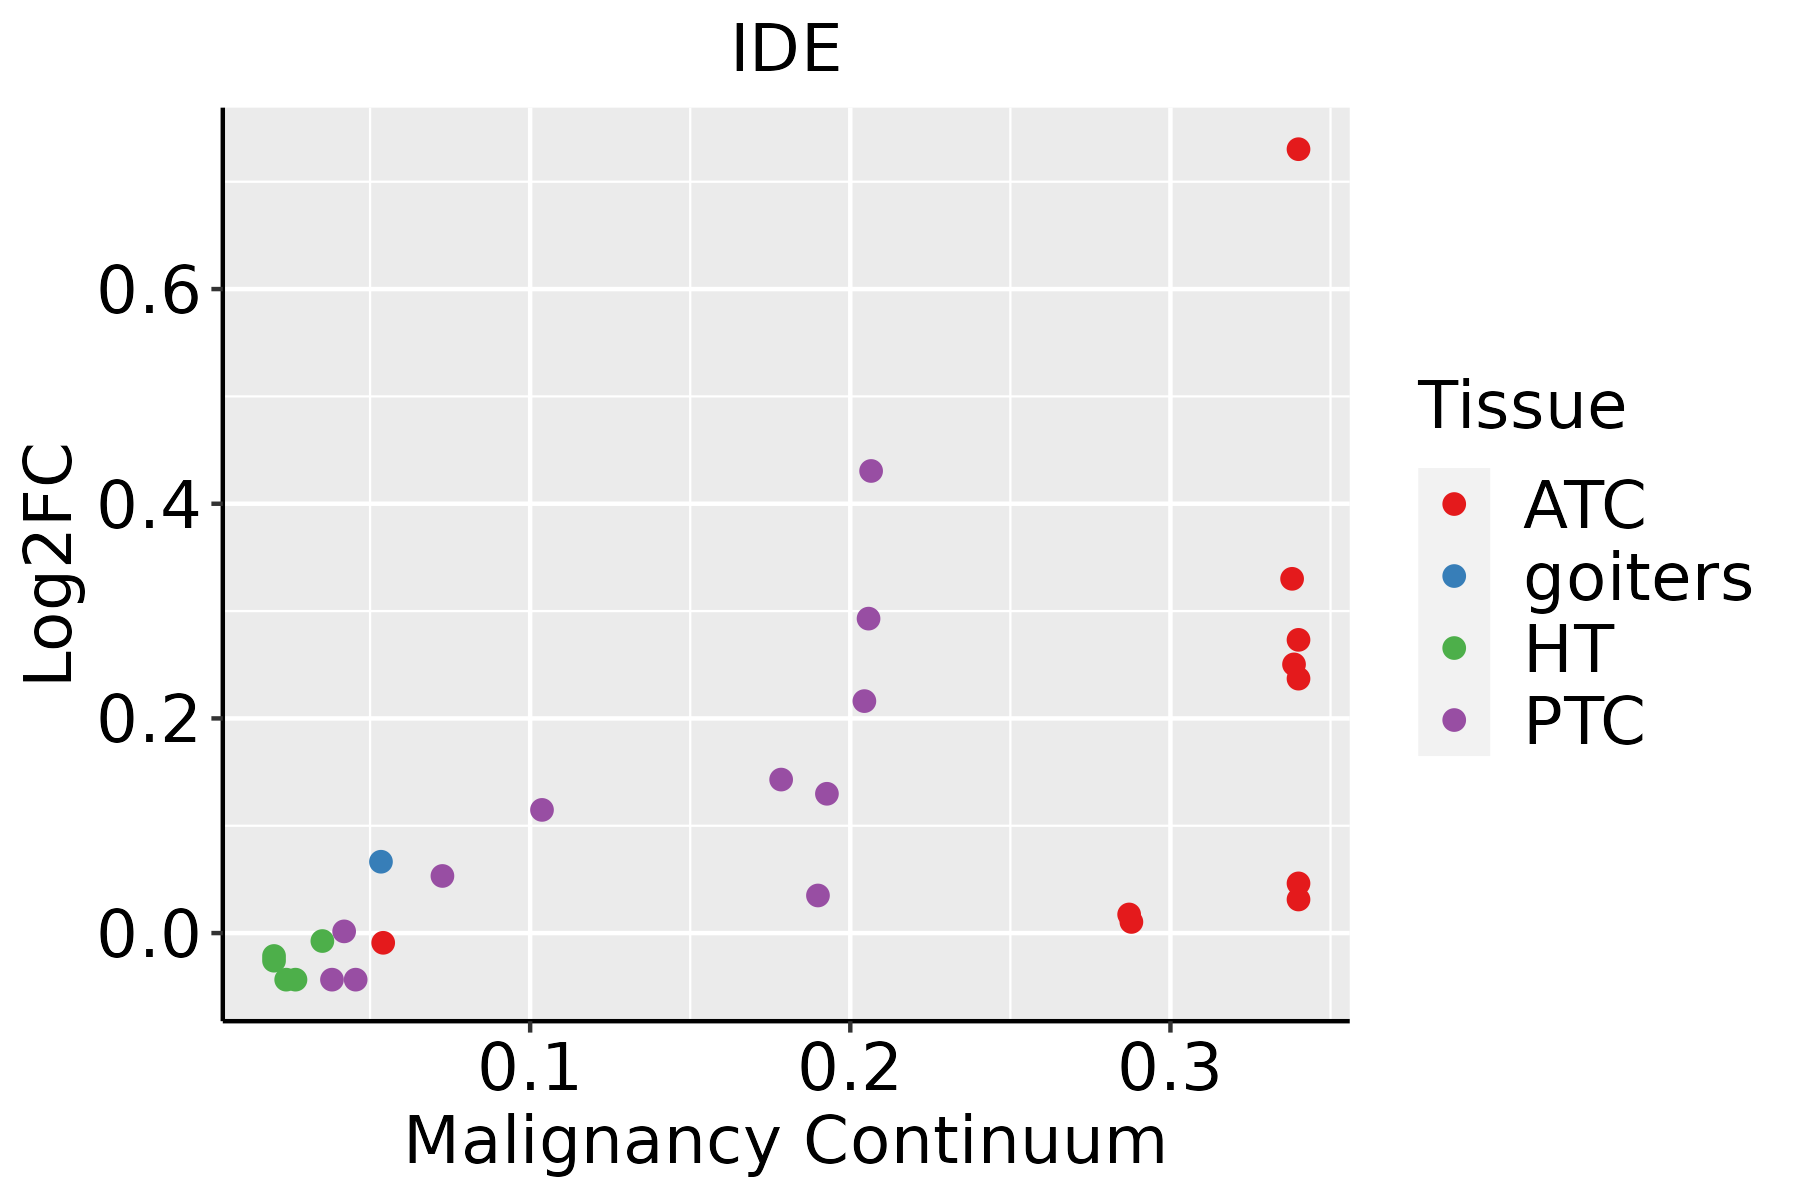 | ATC: Anaplastic thyroid cancer |
| HT: Hashimoto's thyroiditis |
| PTC: Papillary thyroid cancer |
| GO ID | Tissue | Disease Stage | Description | Gene Ratio | Bg Ratio | pvalue | p.adjust | Count |
| GO:000906015 | Endometrium | EEC | aerobic respiration | 79/2168 | 189/18723 | 2.63e-26 | 3.95e-23 | 79 |
| GO:004533315 | Endometrium | EEC | cellular respiration | 83/2168 | 230/18723 | 1.72e-22 | 2.06e-19 | 83 |
| GO:001598015 | Endometrium | EEC | energy derivation by oxidation of organic compounds | 97/2168 | 318/18723 | 5.37e-20 | 3.58e-17 | 97 |
| GO:001603217 | Endometrium | EEC | viral process | 112/2168 | 415/18723 | 2.48e-18 | 1.35e-15 | 112 |
| GO:000609115 | Endometrium | EEC | generation of precursor metabolites and energy | 125/2168 | 490/18723 | 3.76e-18 | 1.88e-15 | 125 |
| GO:004217617 | Endometrium | EEC | regulation of protein catabolic process | 103/2168 | 391/18723 | 3.54e-16 | 1.52e-13 | 103 |
| GO:001905817 | Endometrium | EEC | viral life cycle | 86/2168 | 317/18723 | 1.63e-14 | 4.65e-12 | 86 |
| GO:000989617 | Endometrium | EEC | positive regulation of catabolic process | 108/2168 | 492/18723 | 2.55e-11 | 3.64e-09 | 108 |
| GO:004440317 | Endometrium | EEC | biological process involved in symbiotic interaction | 73/2168 | 290/18723 | 7.47e-11 | 9.95e-09 | 73 |
| GO:005109817 | Endometrium | EEC | regulation of binding | 83/2168 | 363/18723 | 6.72e-10 | 6.61e-08 | 83 |
| GO:005170117 | Endometrium | EEC | biological process involved in interaction with host | 54/2168 | 203/18723 | 2.67e-09 | 2.01e-07 | 54 |
| GO:004573217 | Endometrium | EEC | positive regulation of protein catabolic process | 59/2168 | 231/18723 | 2.69e-09 | 2.01e-07 | 59 |
| GO:005212617 | Endometrium | EEC | movement in host environment | 47/2168 | 175/18723 | 2.03e-08 | 1.23e-06 | 47 |
| GO:005109917 | Endometrium | EEC | positive regulation of binding | 44/2168 | 173/18723 | 3.08e-07 | 1.27e-05 | 44 |
| GO:004671817 | Endometrium | EEC | viral entry into host cell | 38/2168 | 144/18723 | 7.19e-07 | 2.58e-05 | 38 |
| GO:004586117 | Endometrium | EEC | negative regulation of proteolysis | 72/2168 | 351/18723 | 8.46e-07 | 2.98e-05 | 72 |
| GO:004440917 | Endometrium | EEC | entry into host | 39/2168 | 151/18723 | 9.34e-07 | 3.22e-05 | 39 |
| GO:004339315 | Endometrium | EEC | regulation of protein binding | 46/2168 | 196/18723 | 1.94e-06 | 5.80e-05 | 46 |
| GO:004346714 | Endometrium | EEC | regulation of generation of precursor metabolites and energy | 34/2168 | 130/18723 | 3.36e-06 | 9.13e-05 | 34 |
| GO:190371513 | Endometrium | EEC | regulation of aerobic respiration | 14/2168 | 33/18723 | 7.17e-06 | 1.66e-04 | 14 |
| Hugo Symbol | Variant Class | Variant Classification | dbSNP RS | HGVSc | HGVSp | HGVSp Short | SWISSPROT | BIOTYPE | SIFT | PolyPhen | Tumor Sample Barcode | Tissue | Histology | Sex | Age | Stage | Therapy Types | Drugs | Outcome |
| IDE | SNV | Missense_Mutation | novel | c.2006C>T | p.Ser669Phe | p.S669F | P14735 | protein_coding | deleterious(0.01) | benign(0.339) | TCGA-5L-AAT1-01 | Breast | breast invasive carcinoma | Female | <65 | III/IV | Hormone Therapy | letrozol | SD |
| IDE | SNV | Missense_Mutation | | c.2849G>T | p.Arg950Met | p.R950M | P14735 | protein_coding | tolerated(0.19) | benign(0.003) | TCGA-AN-A0AK-01 | Breast | breast invasive carcinoma | Female | >=65 | I/II | Unknown | Unknown | SD |
| IDE | SNV | Missense_Mutation | | c.1929N>C | p.Lys643Asn | p.K643N | P14735 | protein_coding | tolerated(0.18) | benign(0.006) | TCGA-AR-A24Z-01 | Breast | breast invasive carcinoma | Female | <65 | I/II | Chemotherapy | doxorubicin | SD |
| IDE | SNV | Missense_Mutation | | c.706G>C | p.Asp236His | p.D236H | P14735 | protein_coding | deleterious(0.01) | probably_damaging(0.91) | TCGA-AR-A256-01 | Breast | breast invasive carcinoma | Female | <65 | I/II | Chemotherapy | doxorubicin | PD |
| IDE | SNV | Missense_Mutation | novel | c.2152N>G | p.Gln718Glu | p.Q718E | P14735 | protein_coding | tolerated(0.26) | benign(0.019) | TCGA-BH-A0HP-01 | Breast | breast invasive carcinoma | Female | >=65 | III/IV | Chemotherapy | doxorubicin | SD |
| IDE | insertion | Frame_Shift_Ins | novel | c.2580_2581insTTTTTTTTTTT | p.Ser861PhefsTer11 | p.S861Ffs*11 | P14735 | protein_coding | | | TCGA-BH-A0EB-01 | Breast | breast invasive carcinoma | Female | >=65 | I/II | Hormone Therapy | arimidex | SD |
| IDE | SNV | Missense_Mutation | | c.2062N>G | p.Leu688Val | p.L688V | P14735 | protein_coding | tolerated(0.5) | benign(0.035) | TCGA-FU-A3HZ-01 | Cervix | cervical & endocervical cancer | Female | <65 | I/II | Chemotherapy | cisplatin | CR |
| IDE | SNV | Missense_Mutation | | c.1402N>A | p.Leu468Ile | p.L468I | P14735 | protein_coding | tolerated(0.08) | possibly_damaging(0.486) | TCGA-FU-A3HZ-01 | Cervix | cervical & endocervical cancer | Female | <65 | I/II | Chemotherapy | cisplatin | CR |
| IDE | SNV | Missense_Mutation | | c.1384N>C | p.Asp462His | p.D462H | P14735 | protein_coding | deleterious(0.01) | probably_damaging(0.967) | TCGA-IR-A3LH-01 | Cervix | cervical & endocervical cancer | Female | <65 | I/II | Chemotherapy | cisplatin | CR |
| IDE | SNV | Missense_Mutation | rs766038121 | c.2569C>A | p.His857Asn | p.H857N | P14735 | protein_coding | tolerated(0.59) | benign(0.085) | TCGA-VS-A8Q8-01 | Cervix | cervical & endocervical cancer | Female | <65 | I/II | Unknown | Unknown | PD |
| Entrez ID | Symbol | Category | Interaction Types | Drug Claim Name | Drug Name | PMIDs |
| 3416 | IDE | DRUGGABLE GENOME, NEUTRAL ZINC METALLOPEPTIDASE, EXTERNAL SIDE OF PLASMA MEMBRANE, CELL SURFACE, ENZYME, PROTEASE | | CALMIDAZOLIUM CHLORIDE | CALMIDAZOLIUM CHLORIDE | |
| 3416 | IDE | DRUGGABLE GENOME, NEUTRAL ZINC METALLOPEPTIDASE, EXTERNAL SIDE OF PLASMA MEMBRANE, CELL SURFACE, ENZYME, PROTEASE | inhibitor | 252166800 | | |
| 3416 | IDE | DRUGGABLE GENOME, NEUTRAL ZINC METALLOPEPTIDASE, EXTERNAL SIDE OF PLASMA MEMBRANE, CELL SURFACE, ENZYME, PROTEASE | | Bacitracin | BACITRACIN | |
| 3416 | IDE | DRUGGABLE GENOME, NEUTRAL ZINC METALLOPEPTIDASE, EXTERNAL SIDE OF PLASMA MEMBRANE, CELL SURFACE, ENZYME, PROTEASE | | OLEOYL DOPAMINE | OLEOYL DOPAMINE | |
| 3416 | IDE | DRUGGABLE GENOME, NEUTRAL ZINC METALLOPEPTIDASE, EXTERNAL SIDE OF PLASMA MEMBRANE, CELL SURFACE, ENZYME, PROTEASE | | N-(4-NITROPHENYL)ANTHRANILIC ACID | CHEMBL1574420 | |
| 3416 | IDE | DRUGGABLE GENOME, NEUTRAL ZINC METALLOPEPTIDASE, EXTERNAL SIDE OF PLASMA MEMBRANE, CELL SURFACE, ENZYME, PROTEASE | inhibitor | 252166798 | | |
| 3416 | IDE | DRUGGABLE GENOME, NEUTRAL ZINC METALLOPEPTIDASE, EXTERNAL SIDE OF PLASMA MEMBRANE, CELL SURFACE, ENZYME, PROTEASE | | BIOTIN | BIOTIN | |
| 3416 | IDE | DRUGGABLE GENOME, NEUTRAL ZINC METALLOPEPTIDASE, EXTERNAL SIDE OF PLASMA MEMBRANE, CELL SURFACE, ENZYME, PROTEASE | inhibitor | 252166797 | | |
| 3416 | IDE | DRUGGABLE GENOME, NEUTRAL ZINC METALLOPEPTIDASE, EXTERNAL SIDE OF PLASMA MEMBRANE, CELL SURFACE, ENZYME, PROTEASE | | PRO-001 | | |


