
|
|||||
|
 | |
| |
| |
| |
| |
| |
|
Gene: ID4 |
Gene summary for ID4 |
| Gene information | Species | Human | Gene symbol | ID4 | Gene ID | 3400 |
| Gene name | inhibitor of DNA binding 4, HLH protein | |
| Gene Alias | IDB4 | |
| Cytomap | 6p22.3 | |
| Gene Type | protein-coding | GO ID | GO:0000122 | UniProtAcc | P47928 |
Top |
Malignant transformation analysis |
| Identification of the aberrant gene expression in precancerous and cancerous lesions by comparing the gene expression of stem-like cells in diseased tissues with normal stem cells |
| Entrez ID | Symbol | Replicates | Species | Organ | Tissue | Adj P-value | Log2FC | Malignancy |
| 3400 | ID4 | CA_HPV_1 | Human | Cervix | CC | 8.11e-04 | -1.67e-01 | 0.0264 |
| 3400 | ID4 | CA_HPV_3 | Human | Cervix | CC | 3.20e-18 | 4.95e-01 | 0.0414 |
| 3400 | ID4 | H2 | Human | Cervix | HSIL_HPV | 2.34e-02 | 2.42e-01 | 0.0632 |
| 3400 | ID4 | T2 | Human | Cervix | CC | 3.81e-03 | 5.24e-01 | 0.0709 |
| 3400 | ID4 | AEH-subject1 | Human | Endometrium | AEH | 2.59e-04 | 2.67e-01 | -0.3059 |
| 3400 | ID4 | AEH-subject3 | Human | Endometrium | AEH | 2.59e-07 | 3.13e-01 | -0.2576 |
| 3400 | ID4 | AEH-subject4 | Human | Endometrium | AEH | 7.72e-03 | -7.15e-02 | -0.2657 |
| 3400 | ID4 | AEH-subject5 | Human | Endometrium | AEH | 3.51e-19 | -4.77e-01 | -0.2953 |
| 3400 | ID4 | EEC-subject1 | Human | Endometrium | EEC | 1.78e-04 | -1.62e-01 | -0.2682 |
| 3400 | ID4 | EEC-subject2 | Human | Endometrium | EEC | 1.85e-04 | -2.34e-01 | -0.2607 |
| 3400 | ID4 | EEC-subject3 | Human | Endometrium | EEC | 2.90e-22 | -3.83e-01 | -0.2525 |
| 3400 | ID4 | GSM5276934 | Human | Endometrium | EEC | 8.10e-22 | -4.82e-01 | -0.0913 |
| 3400 | ID4 | GSM5276937 | Human | Endometrium | EEC | 2.42e-16 | -5.08e-01 | -0.0897 |
| 3400 | ID4 | GSM6177620_NYU_UCEC1_lib1_lib1 | Human | Endometrium | EEC | 3.49e-17 | -2.73e-01 | -0.1869 |
| 3400 | ID4 | GSM6177620_NYU_UCEC1_lib2_lib2 | Human | Endometrium | EEC | 2.53e-22 | -2.42e-01 | -0.1875 |
| 3400 | ID4 | GSM6177620_NYU_UCEC1_lib3_lib3 | Human | Endometrium | EEC | 1.73e-19 | -1.16e-01 | -0.1883 |
| 3400 | ID4 | GSM6177621_NYU_UCEC2_lib1_lib1 | Human | Endometrium | EEC | 6.56e-18 | -2.89e-01 | -0.1934 |
| 3400 | ID4 | GSM6177622_NYU_UCEC3_lib1_lib1 | Human | Endometrium | EEC | 8.80e-32 | -2.53e-01 | -0.1917 |
| 3400 | ID4 | GSM6177622_NYU_UCEC3_lib2_lib2 | Human | Endometrium | EEC | 8.85e-30 | -3.83e-01 | -0.1916 |
| 3400 | ID4 | LZE24T | Human | Esophagus | ESCC | 1.25e-02 | 9.50e-03 | 0.0596 |
| Page: 1 2 3 4 5 |
| Tissue | Expression Dynamics | Abbreviation |
| Cervix | 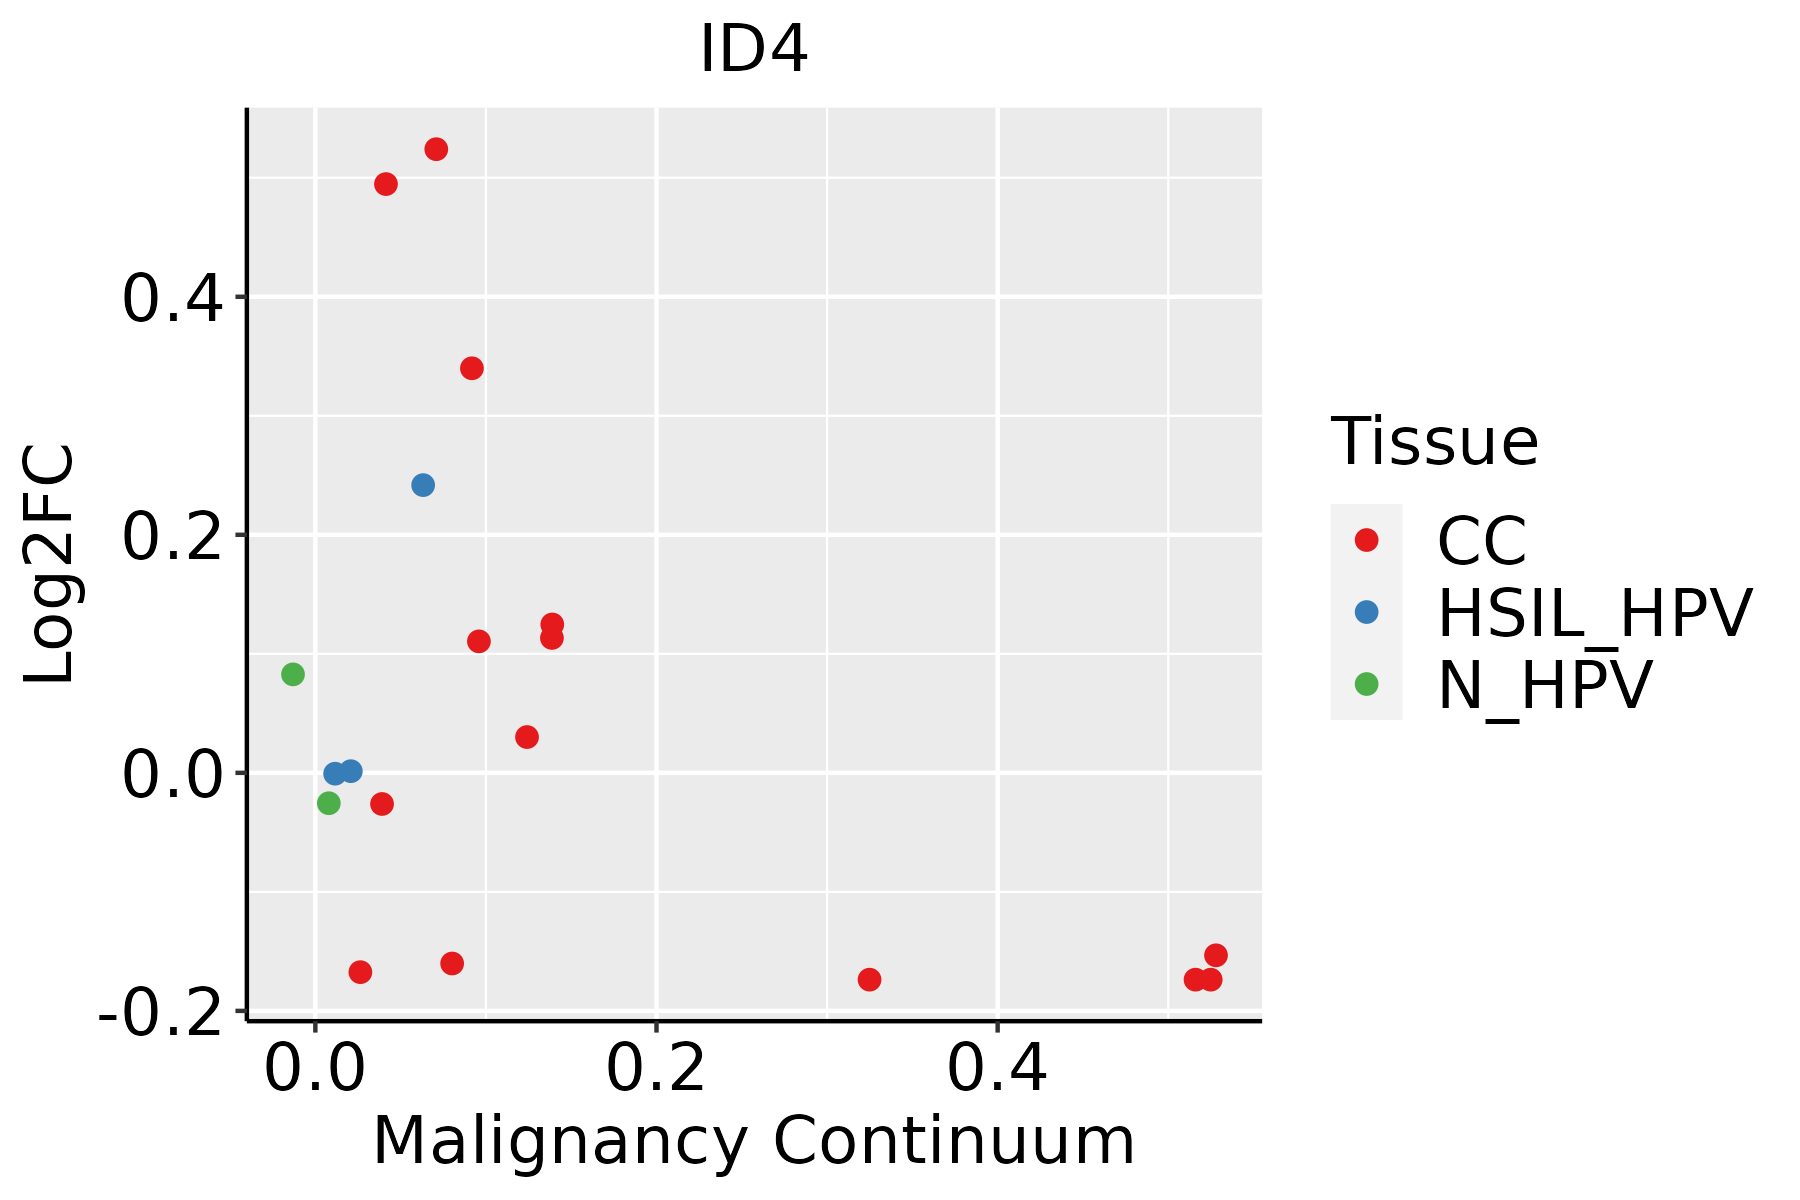 | CC: Cervix cancer |
| HSIL_HPV: HPV-infected high-grade squamous intraepithelial lesions | ||
| N_HPV: HPV-infected normal cervix | ||
| Endometrium | 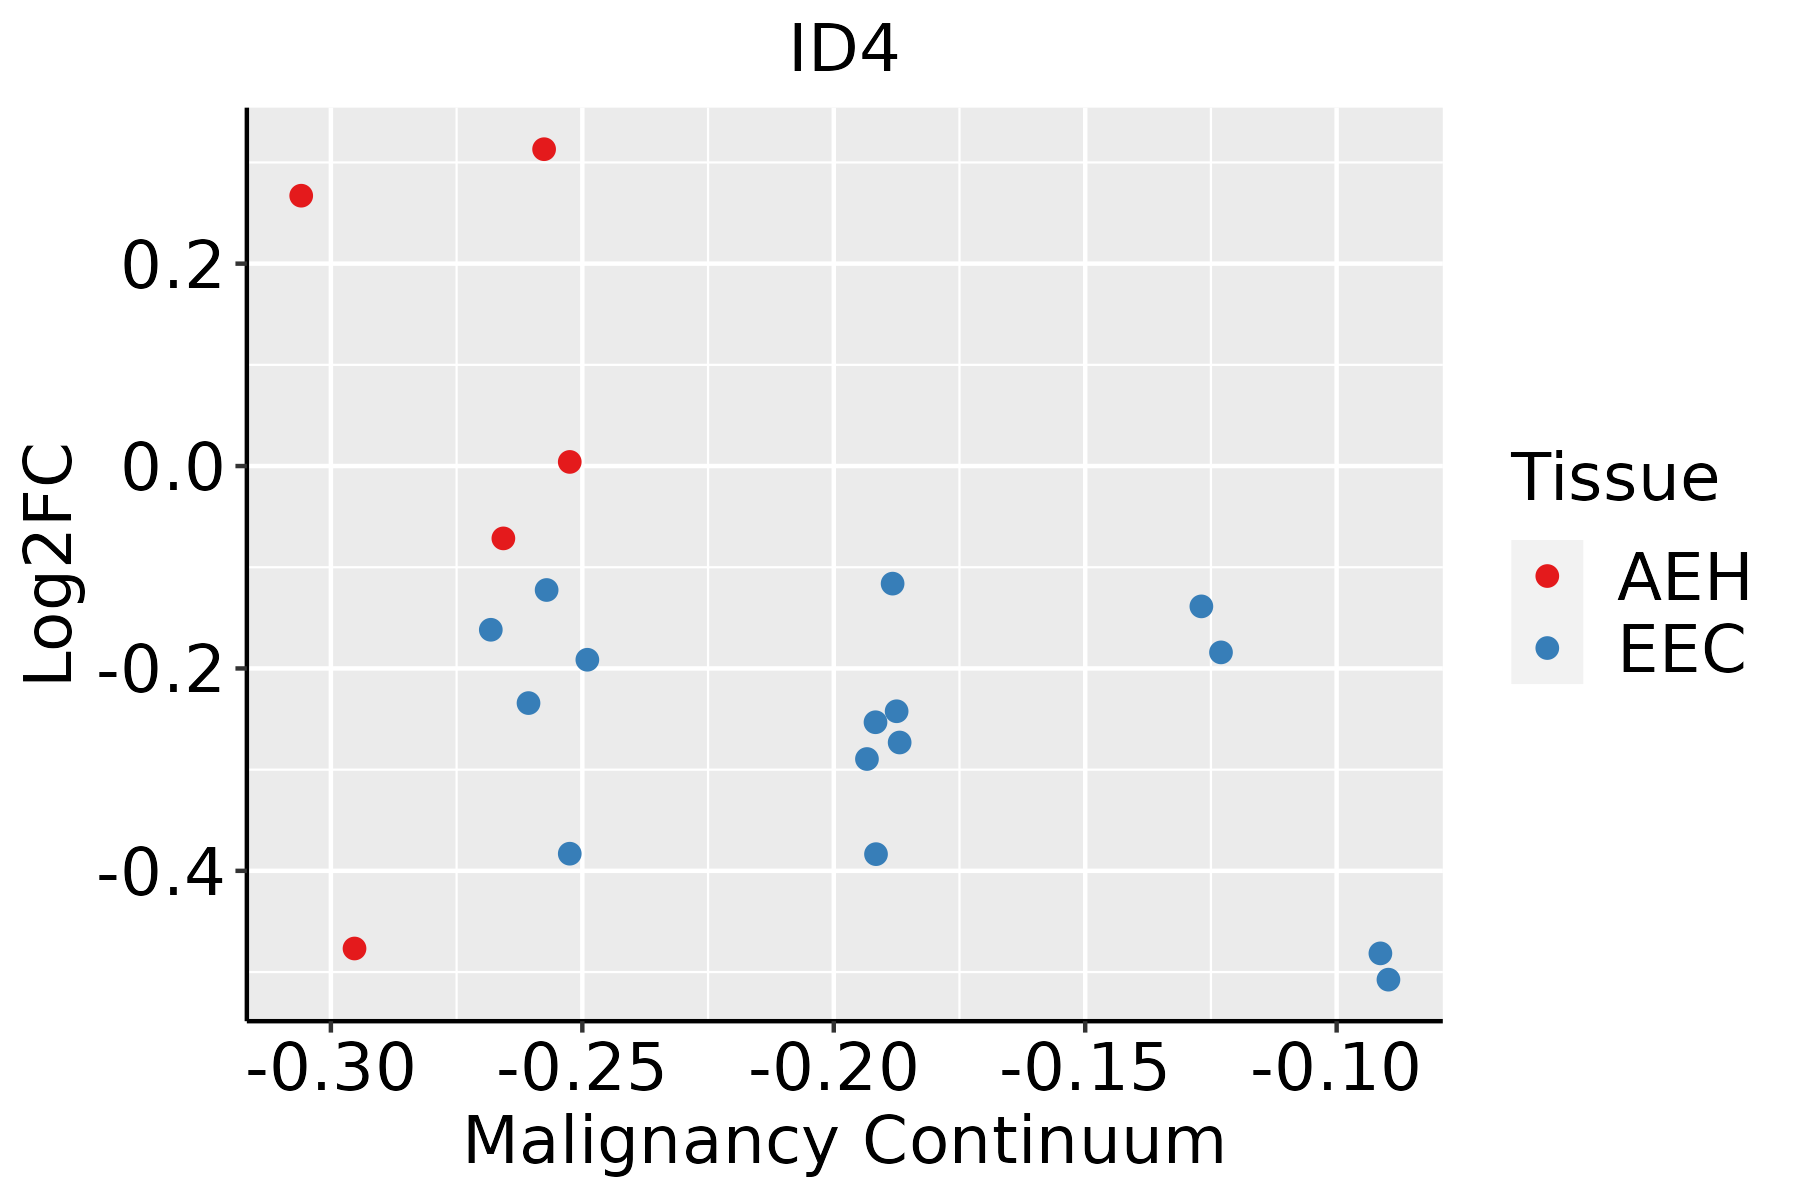 | AEH: Atypical endometrial hyperplasia |
| EEC: Endometrioid Cancer | ||
| Esophagus | 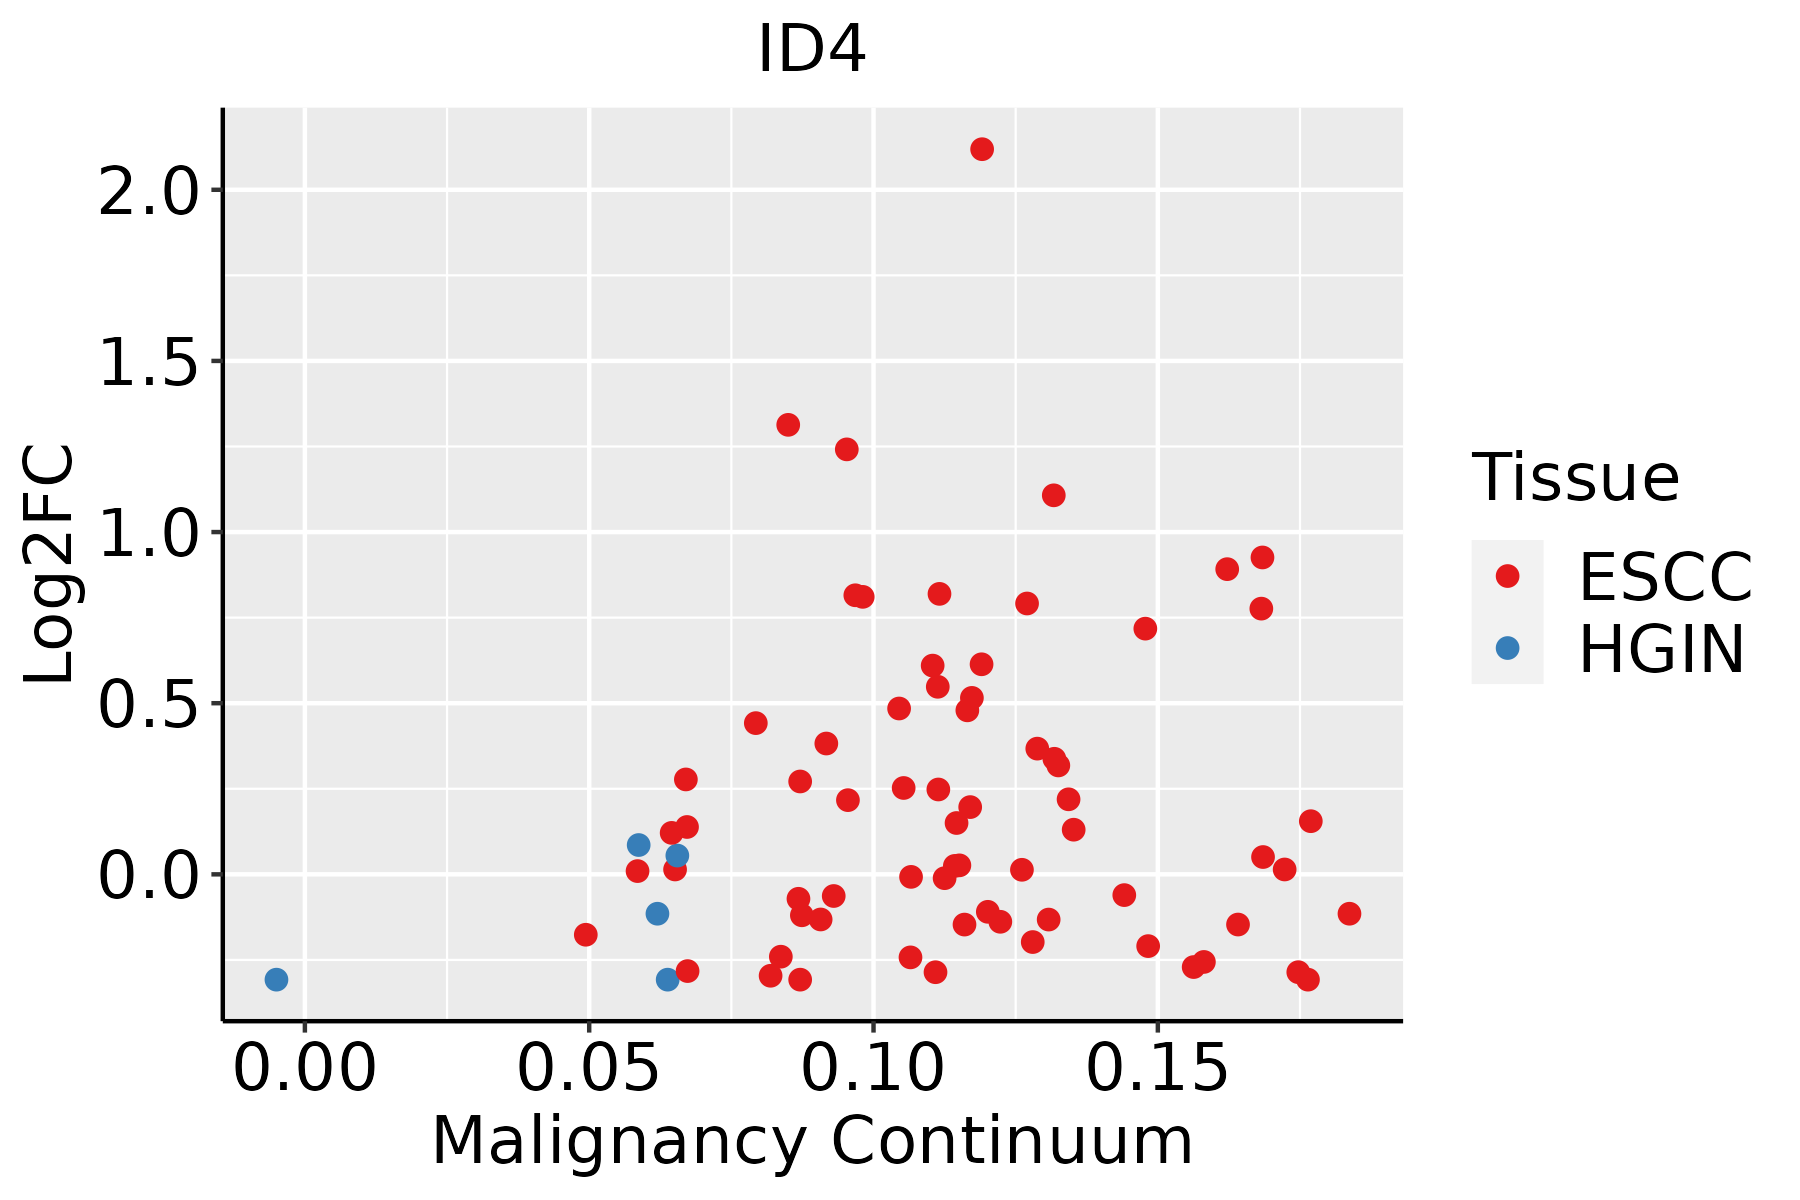 | ESCC: Esophageal squamous cell carcinoma |
| HGIN: High-grade intraepithelial neoplasias | ||
| LGIN: Low-grade intraepithelial neoplasias | ||
| Oral Cavity | 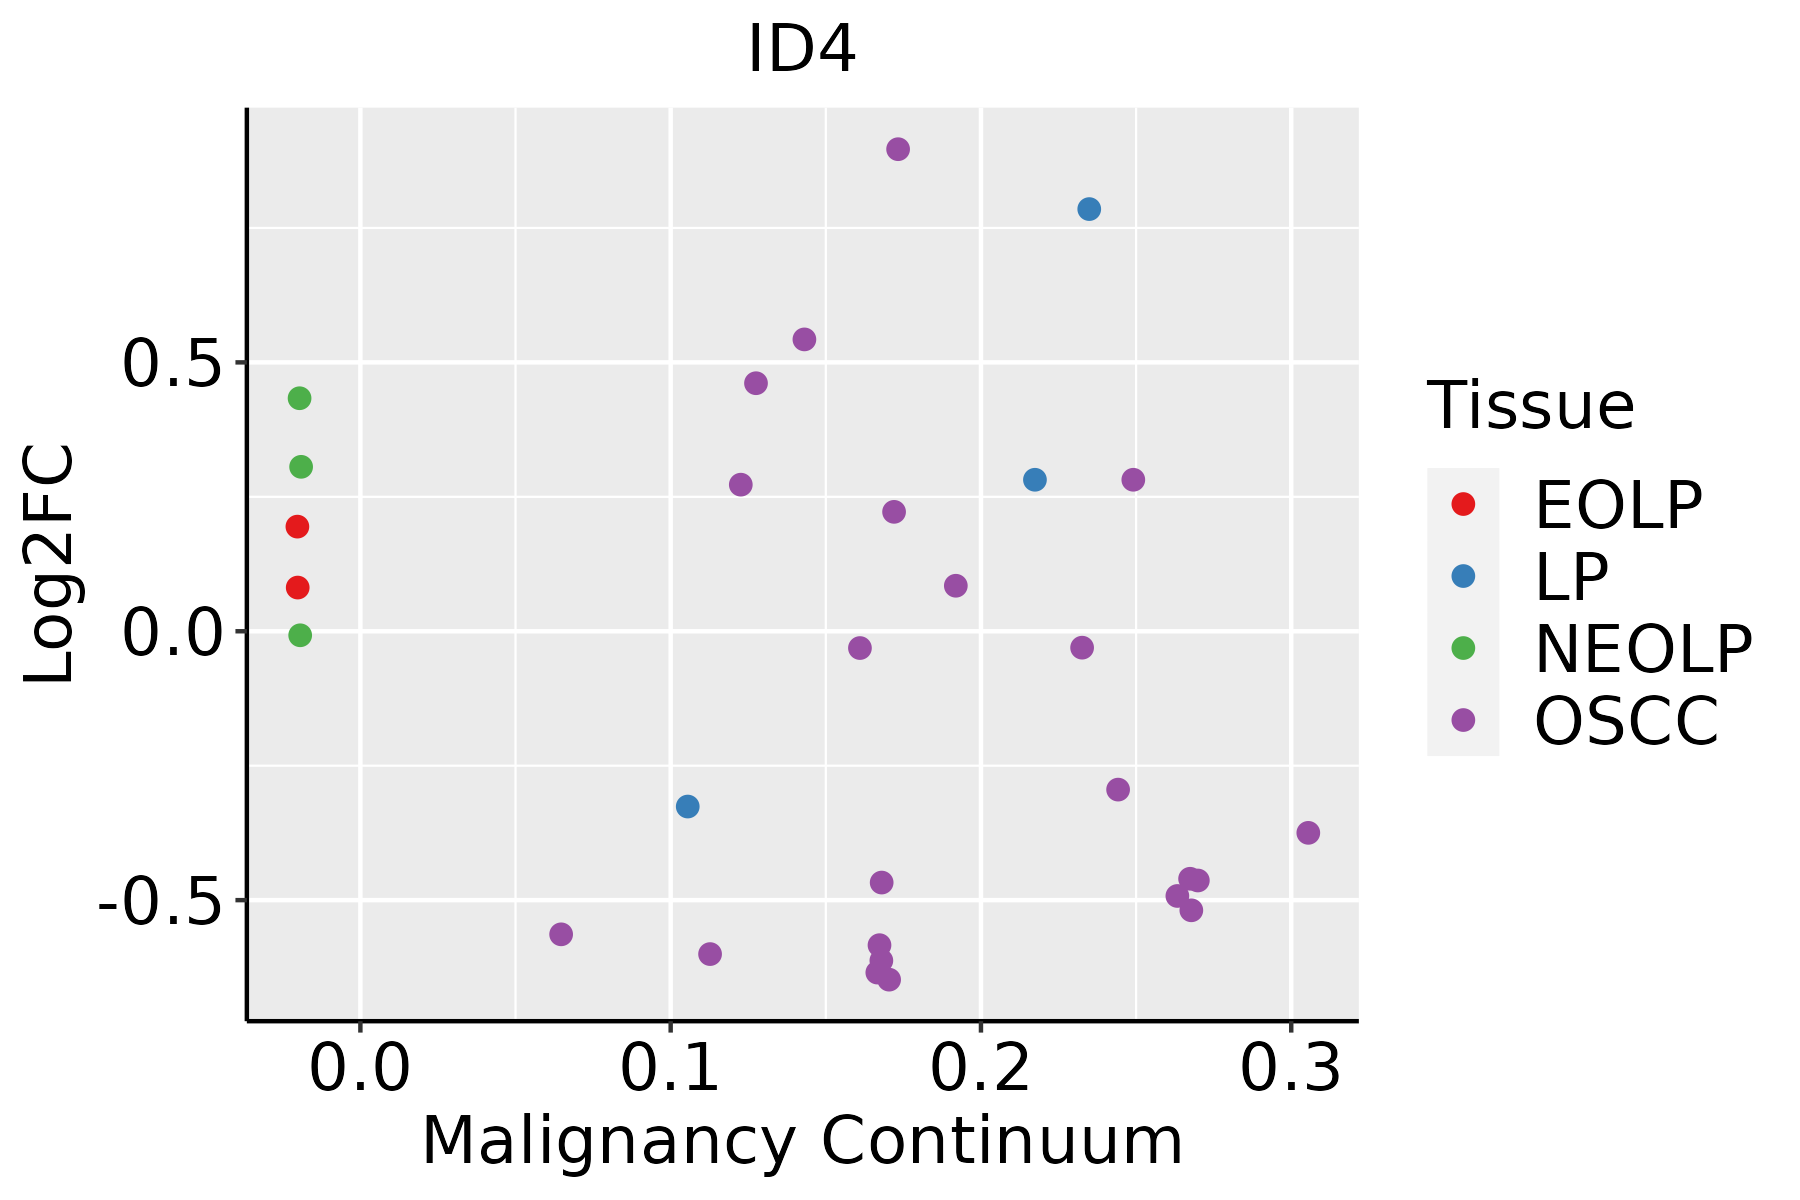 | EOLP: Erosive Oral lichen planus |
| LP: leukoplakia | ||
| NEOLP: Non-erosive oral lichen planus | ||
| OSCC: Oral squamous cell carcinoma | ||
| Prostate | 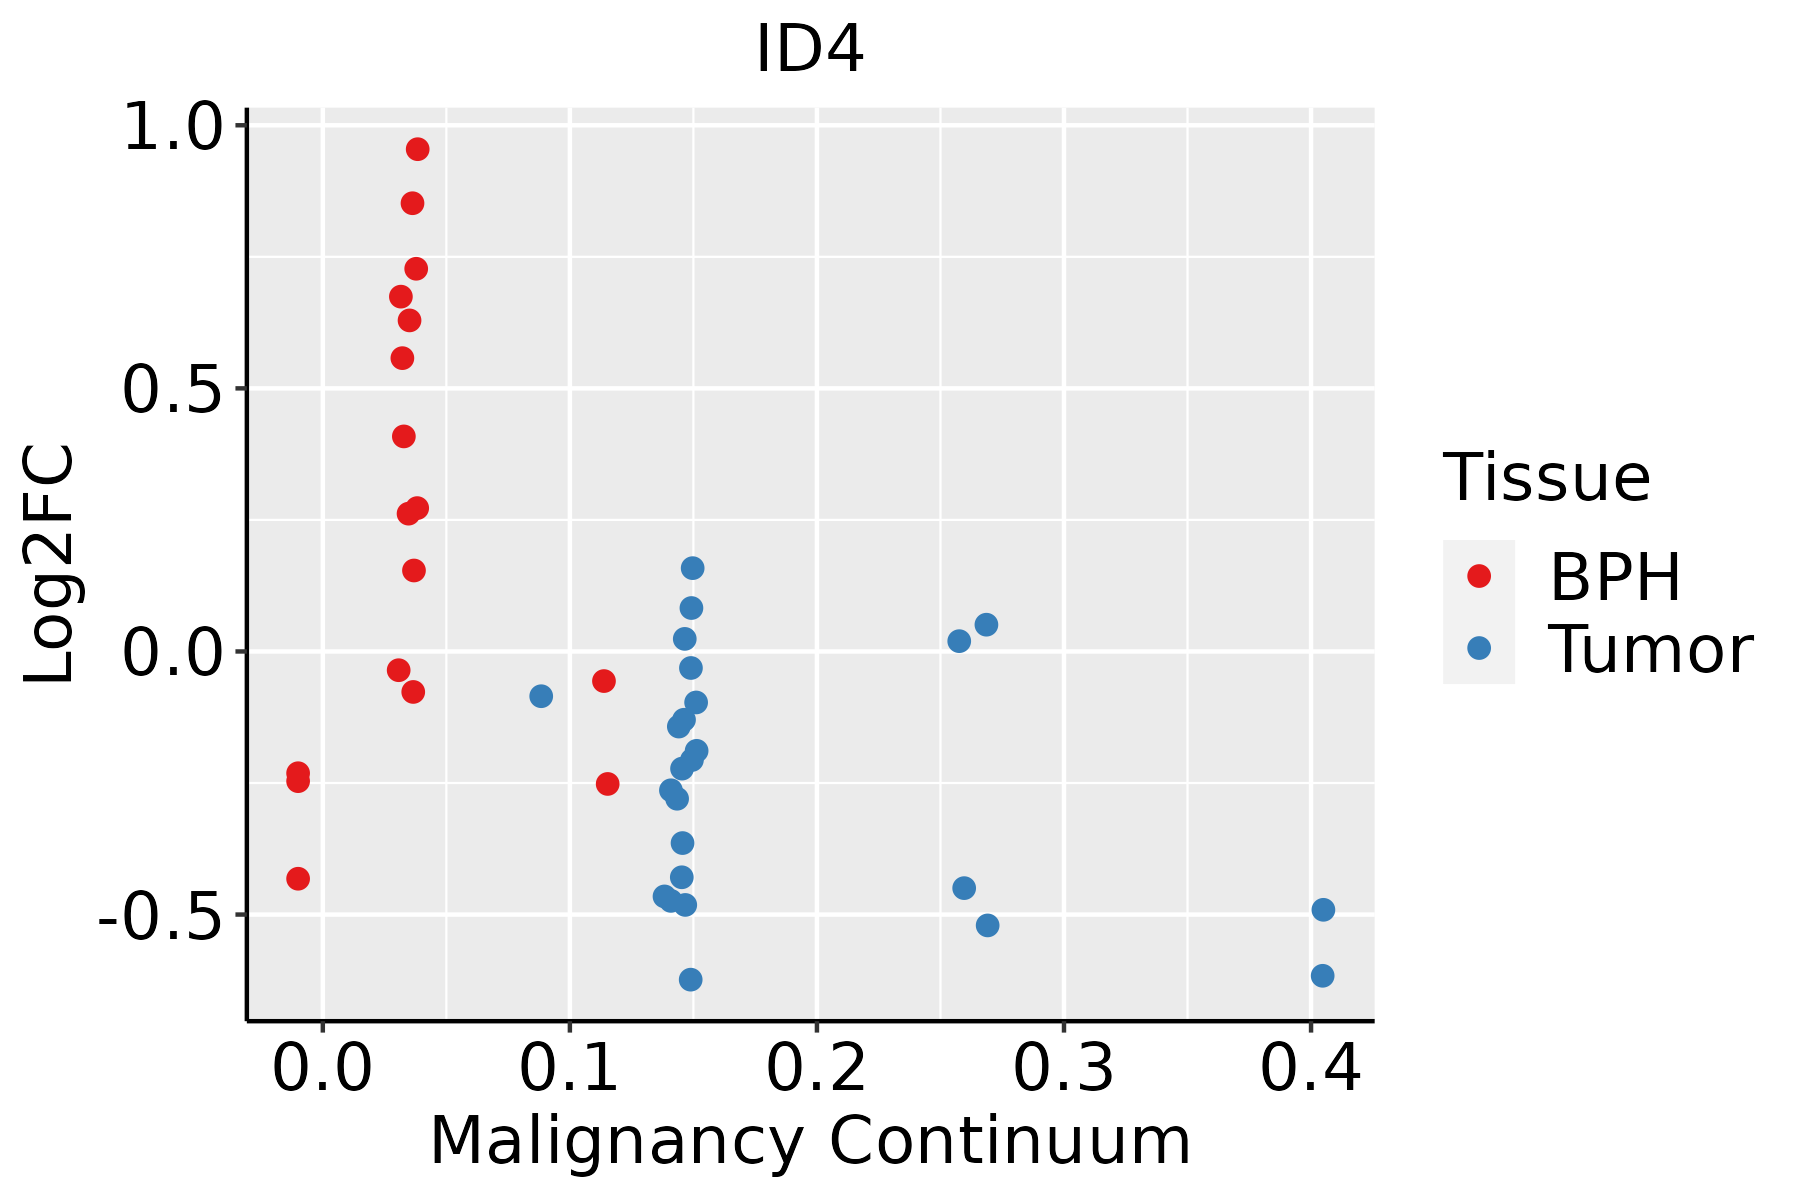 | BPH: Benign Prostatic Hyperplasia |
| Skin |  | AK: Actinic keratosis |
| cSCC: Cutaneous squamous cell carcinoma | ||
| SCCIS:squamous cell carcinoma in situ | ||
| Thyroid | 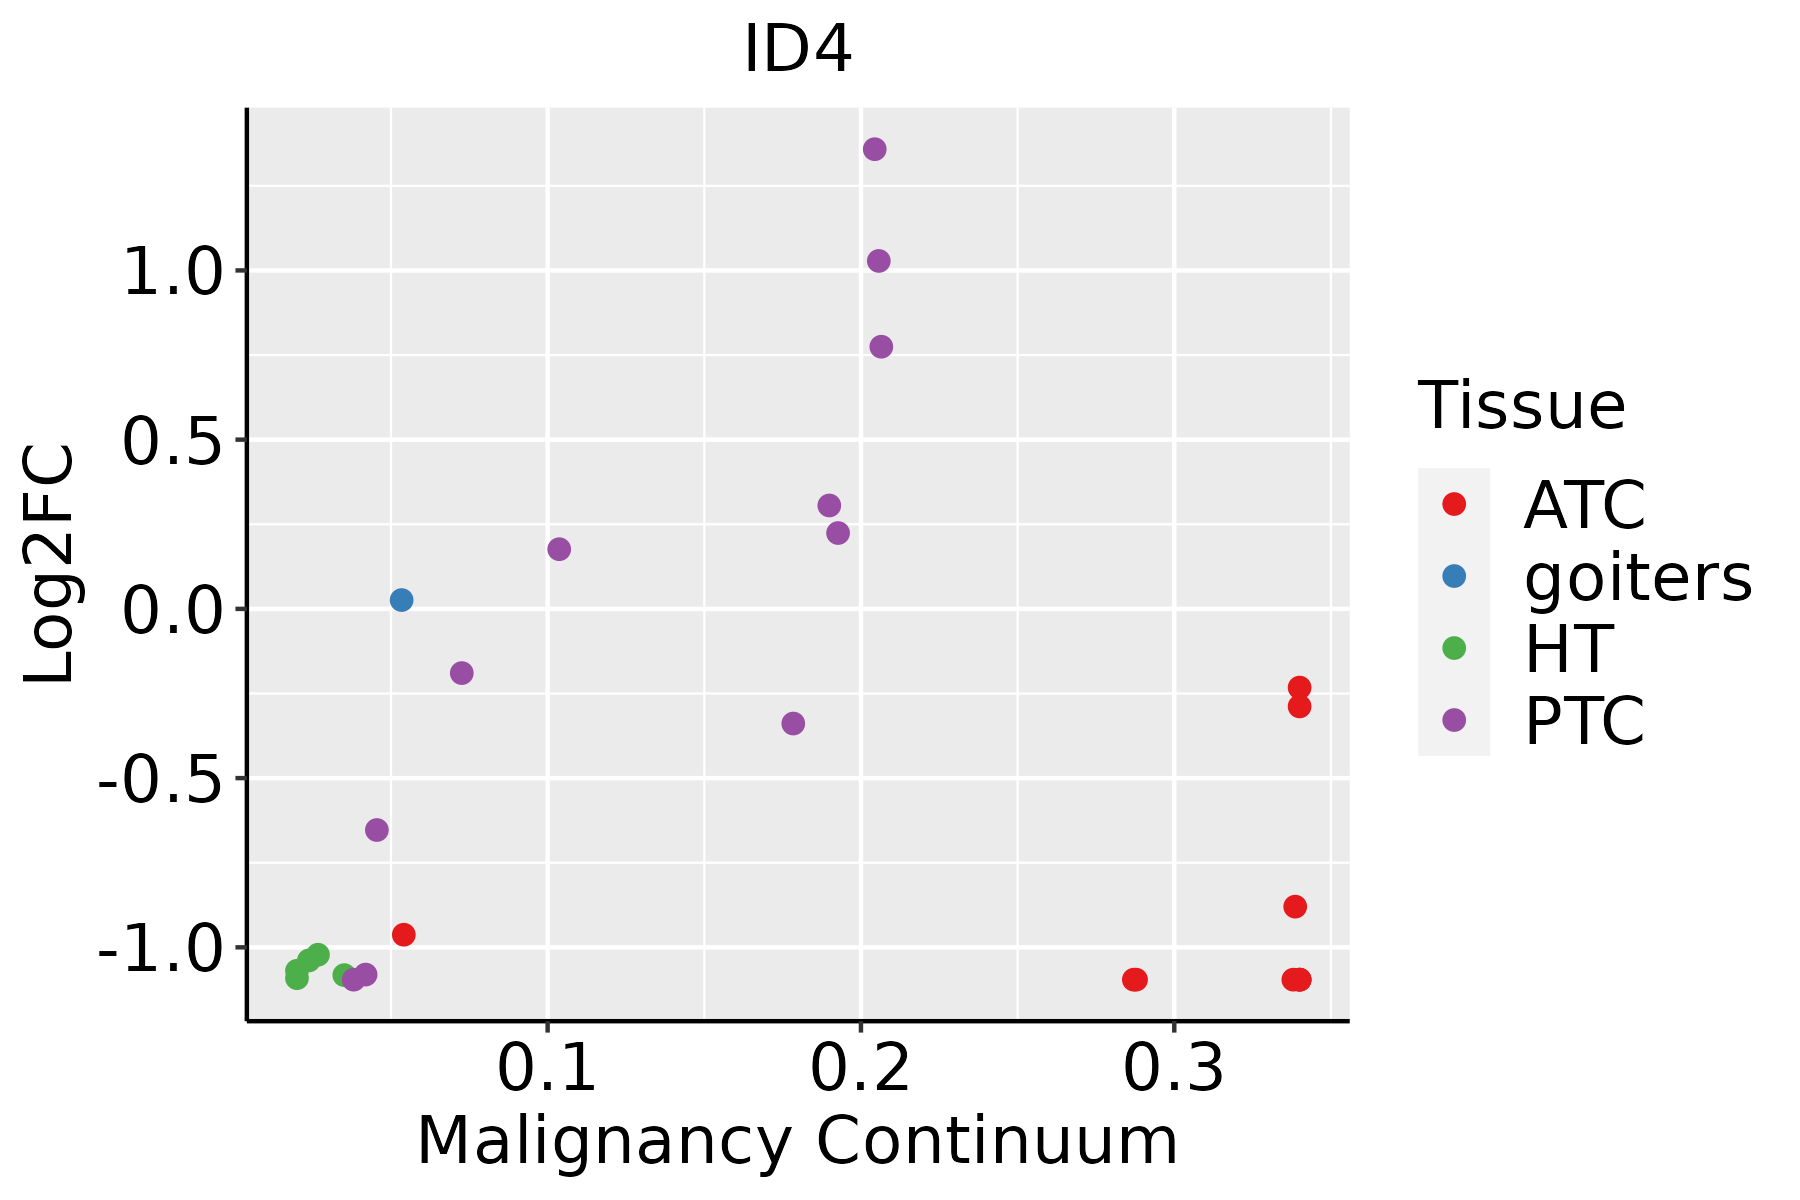 | ATC: Anaplastic thyroid cancer |
| HT: Hashimoto's thyroiditis | ||
| PTC: Papillary thyroid cancer |
| ∗log2FC in expression of this searched gene in stem-like cells from each diseased tissue sample relative to stem-like cells in normal samples in each tissue plotted against the malignancy continuum. Samples are colored based on if they are from different disease stage. |
Top |
Malignant transformation related pathway analysis |
| Find out the enriched GO biological processes and KEGG pathways involved in transition from healthy to precancer to cancer |
| Tissue | Disease Stage | Enriched GO biological Processes |
| Colorectum | AD |  |
| Colorectum | SER |  |
| Colorectum | MSS |  |
| Colorectum | MSI-H |  |
| Colorectum | FAP |  |
| ∗Top 15 enriched GO BP terms are showed in the bar plot of each disease state in each tissue. Each row represents a significant GO biological process which is colored according to the -log10(p.adjust). |
| Page: 1 2 3 4 5 6 7 8 9 |
| GO ID | Tissue | Disease Stage | Description | Gene Ratio | Bg Ratio | pvalue | p.adjust | Count |
| GO:00485118 | Cervix | CC | rhythmic process | 65/2311 | 298/18723 | 2.79e-06 | 8.04e-05 | 65 |
| GO:00063257 | Cervix | CC | chromatin organization | 78/2311 | 409/18723 | 5.40e-05 | 8.02e-04 | 78 |
| GO:00076238 | Cervix | CC | circadian rhythm | 46/2311 | 210/18723 | 6.76e-05 | 9.60e-04 | 46 |
| GO:00329226 | Cervix | CC | circadian regulation of gene expression | 18/2311 | 68/18723 | 1.18e-03 | 9.56e-03 | 18 |
| GO:00485119 | Endometrium | AEH | rhythmic process | 67/2100 | 298/18723 | 1.69e-08 | 1.04e-06 | 67 |
| GO:00076239 | Endometrium | AEH | circadian rhythm | 47/2100 | 210/18723 | 2.54e-06 | 7.28e-05 | 47 |
| GO:00329227 | Endometrium | AEH | circadian regulation of gene expression | 22/2100 | 68/18723 | 2.65e-06 | 7.57e-05 | 22 |
| GO:00063258 | Endometrium | AEH | chromatin organization | 64/2100 | 409/18723 | 3.69e-03 | 2.52e-02 | 64 |
| GO:004851114 | Endometrium | EEC | rhythmic process | 67/2168 | 298/18723 | 5.86e-08 | 3.11e-06 | 67 |
| GO:003292212 | Endometrium | EEC | circadian regulation of gene expression | 22/2168 | 68/18723 | 4.49e-06 | 1.14e-04 | 22 |
| GO:000762314 | Endometrium | EEC | circadian rhythm | 46/2168 | 210/18723 | 1.37e-05 | 2.73e-04 | 46 |
| GO:000632513 | Endometrium | EEC | chromatin organization | 65/2168 | 409/18723 | 4.98e-03 | 3.14e-02 | 65 |
| GO:000632516 | Esophagus | HGIN | chromatin organization | 92/2587 | 409/18723 | 1.05e-06 | 4.16e-05 | 92 |
| GO:0010498111 | Esophagus | ESCC | proteasomal protein catabolic process | 369/8552 | 490/18723 | 1.13e-41 | 1.80e-38 | 369 |
| GO:0043161111 | Esophagus | ESCC | proteasome-mediated ubiquitin-dependent protein catabolic process | 312/8552 | 412/18723 | 3.53e-36 | 4.48e-33 | 312 |
| GO:001657015 | Esophagus | ESCC | histone modification | 323/8552 | 463/18723 | 2.61e-26 | 7.88e-24 | 323 |
| GO:001820514 | Esophagus | ESCC | peptidyl-lysine modification | 259/8552 | 376/18723 | 3.90e-20 | 5.26e-18 | 259 |
| GO:00434143 | Esophagus | ESCC | macromolecule methylation | 199/8552 | 316/18723 | 3.44e-10 | 9.57e-09 | 199 |
| GO:0030099111 | Esophagus | ESCC | myeloid cell differentiation | 232/8552 | 381/18723 | 1.22e-09 | 2.90e-08 | 232 |
| GO:00322592 | Esophagus | ESCC | methylation | 222/8552 | 364/18723 | 2.26e-09 | 5.09e-08 | 222 |
| Page: 1 2 3 4 5 6 7 8 9 10 11 12 13 14 15 |
| Pathway ID | Tissue | Disease Stage | Description | Gene Ratio | Bg Ratio | pvalue | p.adjust | qvalue | Count |
| hsa043504 | Endometrium | AEH | TGF-beta signaling pathway | 26/1197 | 108/8465 | 3.82e-03 | 2.18e-02 | 1.59e-02 | 26 |
| hsa0435011 | Endometrium | AEH | TGF-beta signaling pathway | 26/1197 | 108/8465 | 3.82e-03 | 2.18e-02 | 1.59e-02 | 26 |
| hsa043502 | Endometrium | EEC | TGF-beta signaling pathway | 26/1237 | 108/8465 | 5.95e-03 | 3.12e-02 | 2.33e-02 | 26 |
| hsa043503 | Endometrium | EEC | TGF-beta signaling pathway | 26/1237 | 108/8465 | 5.95e-03 | 3.12e-02 | 2.33e-02 | 26 |
| hsa043507 | Esophagus | ESCC | TGF-beta signaling pathway | 69/4205 | 108/8465 | 1.92e-03 | 5.54e-03 | 2.84e-03 | 69 |
| hsa0435014 | Esophagus | ESCC | TGF-beta signaling pathway | 69/4205 | 108/8465 | 1.92e-03 | 5.54e-03 | 2.84e-03 | 69 |
| hsa043506 | Oral cavity | OSCC | TGF-beta signaling pathway | 60/3704 | 108/8465 | 8.66e-03 | 1.97e-02 | 1.00e-02 | 60 |
| hsa0435013 | Oral cavity | OSCC | TGF-beta signaling pathway | 60/3704 | 108/8465 | 8.66e-03 | 1.97e-02 | 1.00e-02 | 60 |
| hsa0435041 | Oral cavity | NEOLP | TGF-beta signaling pathway | 28/1112 | 108/8465 | 2.46e-04 | 1.62e-03 | 1.02e-03 | 28 |
| hsa0435051 | Oral cavity | NEOLP | TGF-beta signaling pathway | 28/1112 | 108/8465 | 2.46e-04 | 1.62e-03 | 1.02e-03 | 28 |
| hsa043505 | Prostate | BPH | TGF-beta signaling pathway | 35/1718 | 108/8465 | 1.98e-03 | 7.92e-03 | 4.90e-03 | 35 |
| hsa0435012 | Prostate | BPH | TGF-beta signaling pathway | 35/1718 | 108/8465 | 1.98e-03 | 7.92e-03 | 4.90e-03 | 35 |
| hsa0435021 | Prostate | Tumor | TGF-beta signaling pathway | 39/1791 | 108/8465 | 2.33e-04 | 1.35e-03 | 8.39e-04 | 39 |
| hsa0435031 | Prostate | Tumor | TGF-beta signaling pathway | 39/1791 | 108/8465 | 2.33e-04 | 1.35e-03 | 8.39e-04 | 39 |
| Page: 1 |
Top |
Cell-cell communication analysis |
| Identification of potential cell-cell interactions between two cell types and their ligand-receptor pairs for different disease states |
| Ligand | Receptor | LRpair | Pathway | Tissue | Disease Stage |
| Page: 1 |
Top |
Single-cell gene regulatory network inference analysis |
| Find out the significant the regulons (TFs) and the target genes of each regulon across cell types for different disease states |
| TF | Cell Type | Tissue | Disease Stage | Target Gene | RSS | Regulon Activity |
| ID4 | SURF | Endometrium | Healthy | GRN,LINC01541,MAOA, etc. | 4.53e-01 |  |
| ID4 | GDT | Oral cavity | ADJ | C11orf96,COL18A1,COL4A1, etc. | 1.45e-01 |  |
| ID4 | cDC | Oral cavity | LP | C11orf96,COL18A1,COL4A1, etc. | 1.20e-01 |  |
| ID4 | cDC | Oral cavity | OSCC | C11orf96,COL18A1,COL4A1, etc. | 5.64e-01 |  |
| ID4 | BN | Thyroid | ADJ | TFF3,TG,TPO, etc. | 1.09e-02 |  |
| ID4 | pDC | Thyroid | ADJ | TFF3,TG,TPO, etc. | 1.68e-02 | |
| ID4 | pDC | Thyroid | ATC | TFF3,TG,TPO, etc. | 5.72e-03 |  |
| ID4 | BMEM | Thyroid | ATC | TFF3,TG,TPO, etc. | 0.00e+00 | |
| ID4 | PLA | Thyroid | ATC | TFF3,TG,TPO, etc. | 1.69e-02 | |
| ID4 | GC | Thyroid | ATC | TFF3,TG,TPO, etc. | 0.00e+00 | |
| ∗The dot plots of a searched regulon are shown for all cell subpopulations in each disease state of each tissue based on the regulon specific score inferred using pySCENIC and by calculating the average expression. |
| Page: 1 2 3 |
Top |
Somatic mutation of malignant transformation related genes |
| Annotation of somatic variants for genes involved in malignant transformation |
| Hugo Symbol | Variant Class | Variant Classification | dbSNP RS | HGVSc | HGVSp | HGVSp Short | SWISSPROT | BIOTYPE | SIFT | PolyPhen | Tumor Sample Barcode | Tissue | Histology | Sex | Age | Stage | Therapy Types | Drugs | Outcome |
| ID4 | SNV | Missense_Mutation | c.320N>T | p.Ala107Val | p.A107V | P47928 | protein_coding | tolerated(0.16) | benign(0.236) | TCGA-CK-6746-01 | Colorectum | colon adenocarcinoma | Female | >=65 | I/II | Unknown | Unknown | SD | |
| ID4 | SNV | Missense_Mutation | novel | c.276G>T | p.Glu92Asp | p.E92D | P47928 | protein_coding | deleterious(0) | benign(0.239) | TCGA-FI-A2D5-01 | Endometrium | uterine corpus endometrioid carcinoma | Female | <65 | III/IV | Chemotherapy | carboplatinum | PD |
| ID4 | SNV | Missense_Mutation | novel | c.374N>G | p.His125Arg | p.H125R | P47928 | protein_coding | tolerated(0.85) | benign(0) | TCGA-90-7964-01 | Lung | lung squamous cell carcinoma | Male | >=65 | I/II | Unknown | Unknown | SD |
| ID4 | SNV | Missense_Mutation | novel | c.182N>T | p.Ala61Val | p.A61V | P47928 | protein_coding | tolerated(1) | benign(0.005) | TCGA-BR-8591-01 | Stomach | stomach adenocarcinoma | Male | >=65 | III/IV | Unknown | Unknown | SD |
| Page: 1 |
Top |
Related drugs of malignant transformation related genes |
| Identification of chemicals and drugs interact with genes involved in malignant transfromation |
| (DGIdb 4.0) |
| Entrez ID | Symbol | Category | Interaction Types | Drug Claim Name | Drug Name | PMIDs |
| Page: 1 |

Copyright 2023-Present -The University of Texas Health Science Center at Houston |