
|
|||||
|
 | |
| |
| |
| |
| |
| |
|
Gene: ICE2 |
Gene summary for ICE2 |
| Gene information | Species | Human | Gene symbol | ICE2 | Gene ID | 79664 |
| Gene name | interactor of little elongation complex ELL subunit 2 | |
| Gene Alias | BRCC1 | |
| Cytomap | 15q22.2 | |
| Gene Type | protein-coding | GO ID | GO:0006139 | UniProtAcc | Q659A1 |
Top |
Malignant transformation analysis |
| Identification of the aberrant gene expression in precancerous and cancerous lesions by comparing the gene expression of stem-like cells in diseased tissues with normal stem cells |
| Entrez ID | Symbol | Replicates | Species | Organ | Tissue | Adj P-value | Log2FC | Malignancy |
| 79664 | ICE2 | LZE2T | Human | Esophagus | ESCC | 3.82e-03 | 4.96e-01 | 0.082 |
| 79664 | ICE2 | LZE4T | Human | Esophagus | ESCC | 1.85e-15 | 4.24e-01 | 0.0811 |
| 79664 | ICE2 | LZE5T | Human | Esophagus | ESCC | 6.27e-04 | 2.42e-01 | 0.0514 |
| 79664 | ICE2 | LZE7T | Human | Esophagus | ESCC | 2.42e-15 | 6.45e-01 | 0.0667 |
| 79664 | ICE2 | LZE8T | Human | Esophagus | ESCC | 2.26e-02 | 1.34e-01 | 0.067 |
| 79664 | ICE2 | LZE20T | Human | Esophagus | ESCC | 3.23e-02 | 1.42e-01 | 0.0662 |
| 79664 | ICE2 | LZE24T | Human | Esophagus | ESCC | 1.78e-11 | 2.57e-01 | 0.0596 |
| 79664 | ICE2 | LZE6T | Human | Esophagus | ESCC | 3.59e-05 | 2.45e-01 | 0.0845 |
| 79664 | ICE2 | P1T-E | Human | Esophagus | ESCC | 1.77e-09 | 4.59e-01 | 0.0875 |
| 79664 | ICE2 | P2T-E | Human | Esophagus | ESCC | 7.58e-25 | 5.17e-01 | 0.1177 |
| 79664 | ICE2 | P4T-E | Human | Esophagus | ESCC | 1.47e-22 | 4.73e-01 | 0.1323 |
| 79664 | ICE2 | P5T-E | Human | Esophagus | ESCC | 4.91e-09 | 1.77e-01 | 0.1327 |
| 79664 | ICE2 | P8T-E | Human | Esophagus | ESCC | 6.03e-30 | 4.50e-01 | 0.0889 |
| 79664 | ICE2 | P9T-E | Human | Esophagus | ESCC | 3.43e-12 | 2.90e-01 | 0.1131 |
| 79664 | ICE2 | P10T-E | Human | Esophagus | ESCC | 4.49e-28 | 5.35e-01 | 0.116 |
| 79664 | ICE2 | P11T-E | Human | Esophagus | ESCC | 4.23e-07 | 2.14e-01 | 0.1426 |
| 79664 | ICE2 | P12T-E | Human | Esophagus | ESCC | 2.65e-25 | 4.55e-01 | 0.1122 |
| 79664 | ICE2 | P15T-E | Human | Esophagus | ESCC | 6.97e-42 | 7.57e-01 | 0.1149 |
| 79664 | ICE2 | P16T-E | Human | Esophagus | ESCC | 1.29e-24 | 4.37e-01 | 0.1153 |
| 79664 | ICE2 | P17T-E | Human | Esophagus | ESCC | 8.01e-03 | 1.72e-01 | 0.1278 |
| Page: 1 2 3 4 5 |
| Tissue | Expression Dynamics | Abbreviation |
| Esophagus | 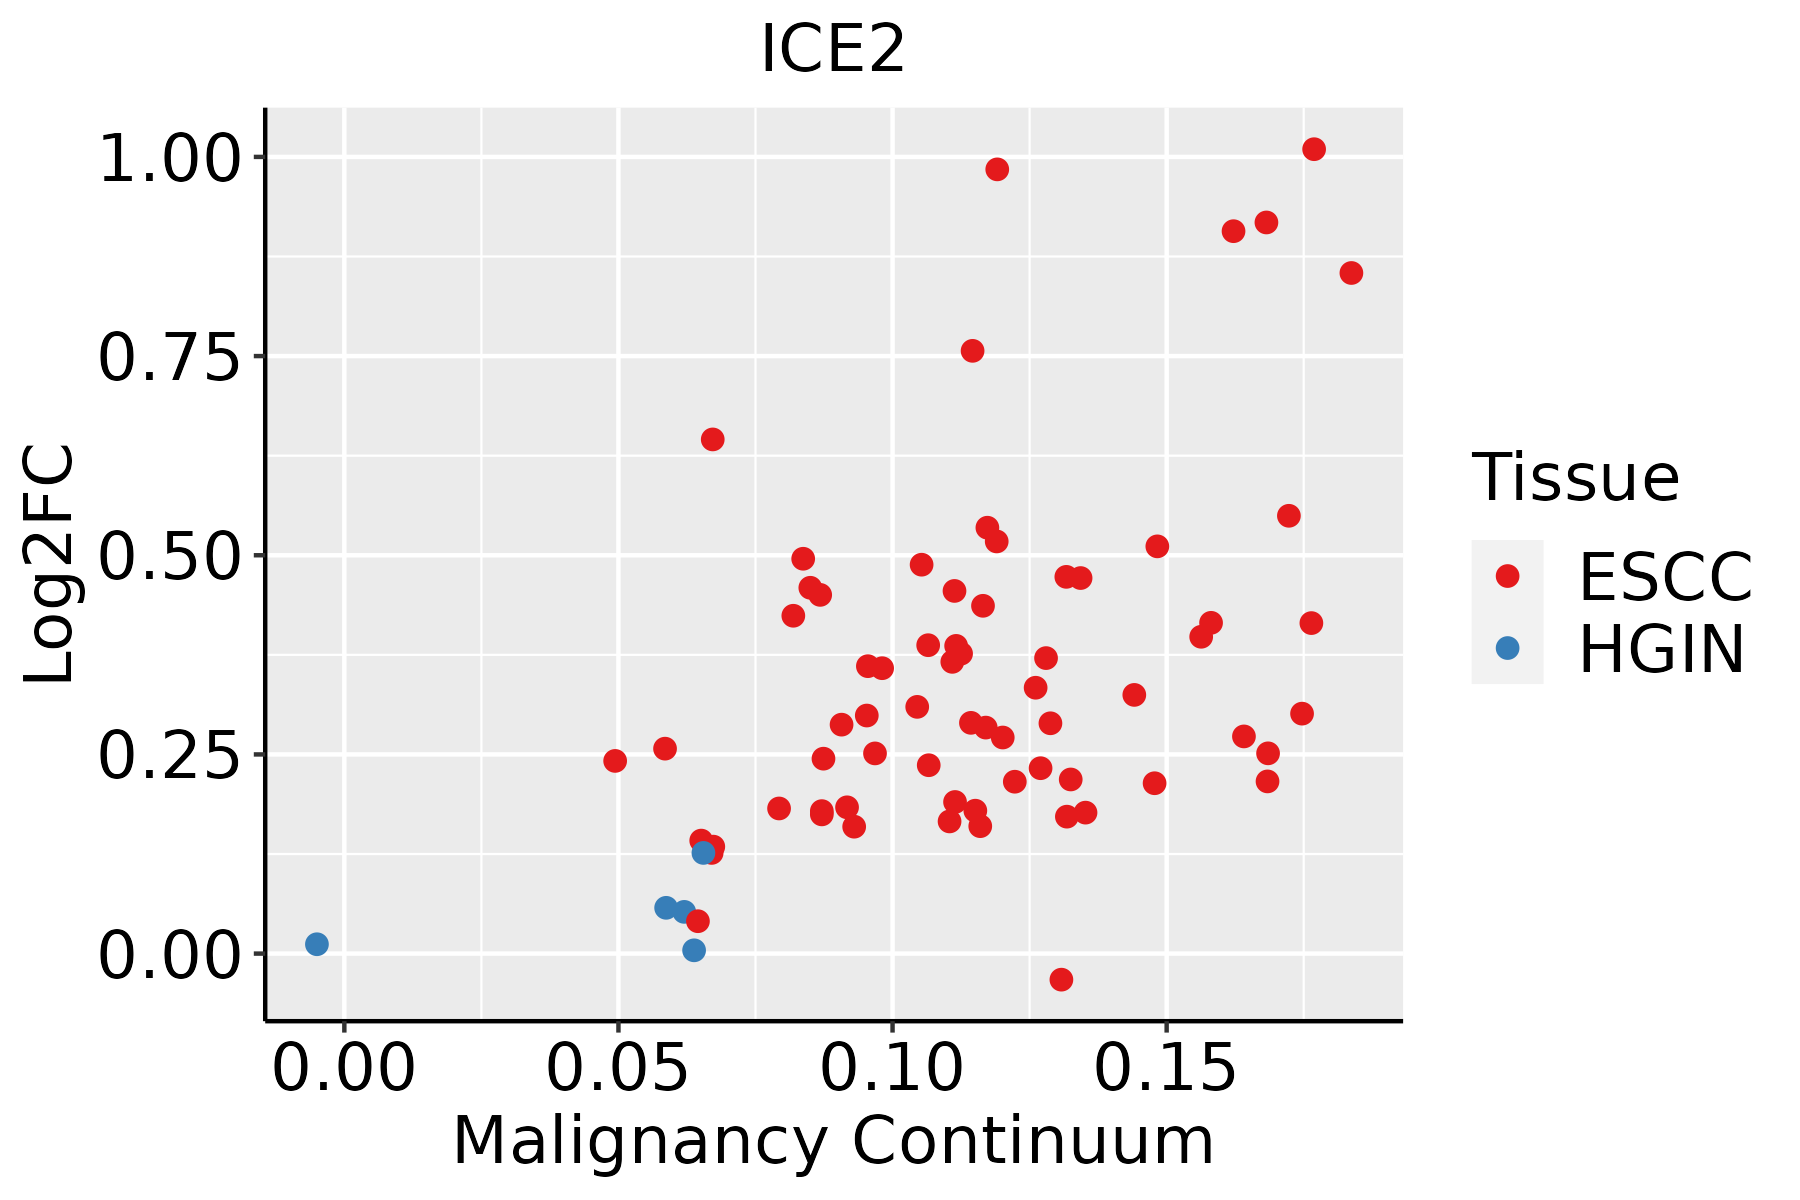 | ESCC: Esophageal squamous cell carcinoma |
| HGIN: High-grade intraepithelial neoplasias | ||
| LGIN: Low-grade intraepithelial neoplasias | ||
| Liver |  | HCC: Hepatocellular carcinoma |
| NAFLD: Non-alcoholic fatty liver disease | ||
| Oral Cavity | 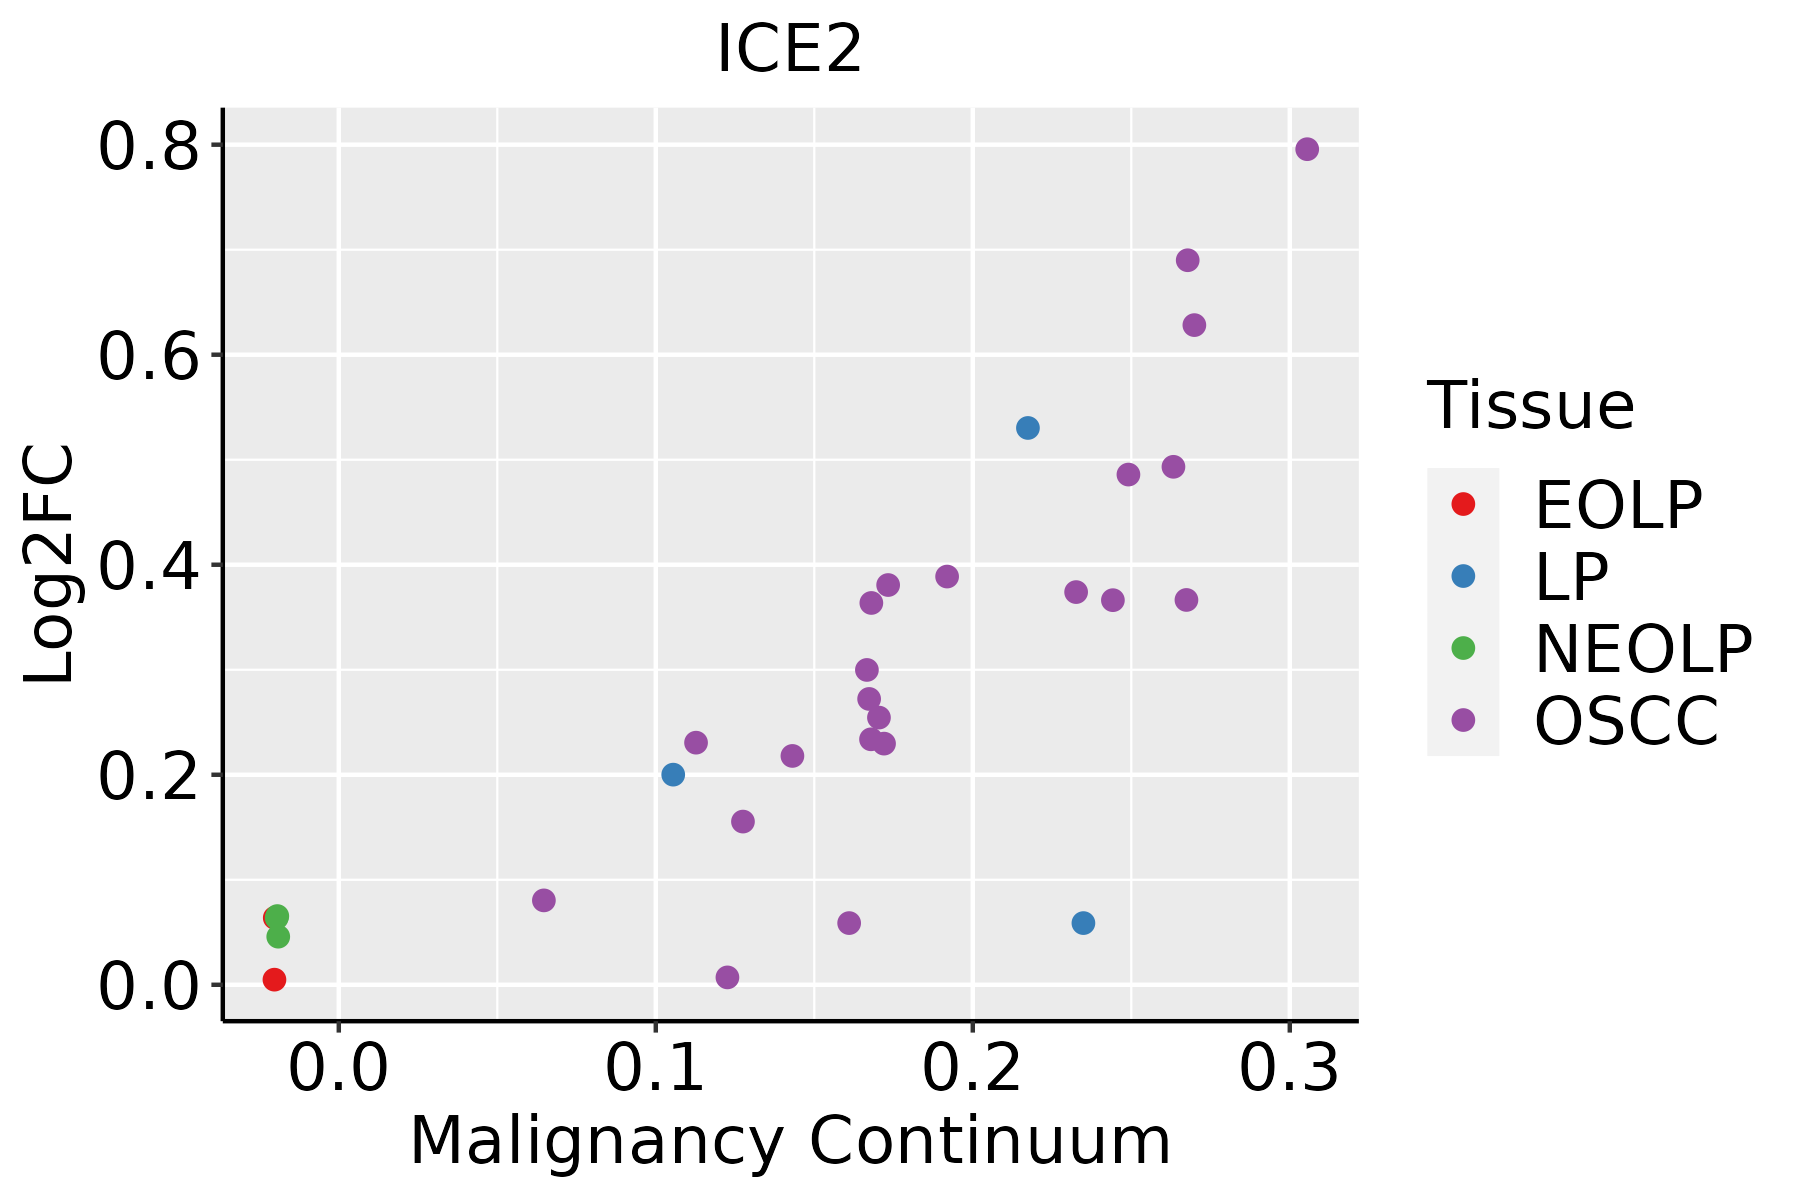 | EOLP: Erosive Oral lichen planus |
| LP: leukoplakia | ||
| NEOLP: Non-erosive oral lichen planus | ||
| OSCC: Oral squamous cell carcinoma |
| ∗log2FC in expression of this searched gene in stem-like cells from each diseased tissue sample relative to stem-like cells in normal samples in each tissue plotted against the malignancy continuum. Samples are colored based on if they are from different disease stage. |
Top |
Malignant transformation related pathway analysis |
| Find out the enriched GO biological processes and KEGG pathways involved in transition from healthy to precancer to cancer |
| Tissue | Disease Stage | Enriched GO biological Processes |
| Colorectum | AD |  |
| Colorectum | SER |  |
| Colorectum | MSS |  |
| Colorectum | MSI-H |  |
| Colorectum | FAP |  |
| ∗Top 15 enriched GO BP terms are showed in the bar plot of each disease state in each tissue. Each row represents a significant GO biological process which is colored according to the -log10(p.adjust). |
| Page: 1 2 3 4 5 6 7 8 9 |
| GO ID | Tissue | Disease Stage | Description | Gene Ratio | Bg Ratio | pvalue | p.adjust | Count |
| GO:00063833 | Esophagus | ESCC | transcription by RNA polymerase III | 41/8552 | 46/18723 | 7.69e-10 | 1.90e-08 | 41 |
| GO:00987812 | Esophagus | ESCC | ncRNA transcription | 45/8552 | 56/18723 | 1.05e-07 | 1.72e-06 | 45 |
| GO:0006359 | Esophagus | ESCC | regulation of transcription by RNA polymerase III | 19/8552 | 22/18723 | 9.52e-05 | 6.78e-04 | 19 |
| GO:00093011 | Esophagus | ESCC | snRNA transcription | 16/8552 | 19/18723 | 6.45e-04 | 3.43e-03 | 16 |
| GO:0045945 | Esophagus | ESCC | positive regulation of transcription by RNA polymerase III | 10/8552 | 11/18723 | 2.54e-03 | 1.08e-02 | 10 |
| GO:00427951 | Esophagus | ESCC | snRNA transcription by RNA polymerase II | 13/8552 | 16/18723 | 4.05e-03 | 1.62e-02 | 13 |
| GO:0006383 | Liver | HCC | transcription by RNA polymerase III | 31/7958 | 46/18723 | 5.67e-04 | 3.61e-03 | 31 |
| GO:0098781 | Liver | HCC | ncRNA transcription | 33/7958 | 56/18723 | 9.64e-03 | 3.63e-02 | 33 |
| GO:00063832 | Oral cavity | OSCC | transcription by RNA polymerase III | 34/7305 | 46/18723 | 1.61e-06 | 2.11e-05 | 34 |
| GO:00987811 | Oral cavity | OSCC | ncRNA transcription | 38/7305 | 56/18723 | 1.15e-05 | 1.18e-04 | 38 |
| GO:0009301 | Oral cavity | OSCC | snRNA transcription | 13/7305 | 19/18723 | 9.07e-03 | 3.26e-02 | 13 |
| GO:0042795 | Oral cavity | OSCC | snRNA transcription by RNA polymerase II | 11/7305 | 16/18723 | 1.56e-02 | 4.99e-02 | 11 |
| Page: 1 |
| Pathway ID | Tissue | Disease Stage | Description | Gene Ratio | Bg Ratio | pvalue | p.adjust | qvalue | Count |
| Page: 1 |
Top |
Cell-cell communication analysis |
| Identification of potential cell-cell interactions between two cell types and their ligand-receptor pairs for different disease states |
| Ligand | Receptor | LRpair | Pathway | Tissue | Disease Stage |
| Page: 1 |
Top |
Single-cell gene regulatory network inference analysis |
| Find out the significant the regulons (TFs) and the target genes of each regulon across cell types for different disease states |
| TF | Cell Type | Tissue | Disease Stage | Target Gene | RSS | Regulon Activity |
| ∗The dot plots of a searched regulon are shown for all cell subpopulations in each disease state of each tissue based on the regulon specific score inferred using pySCENIC and by calculating the average expression. |
| Page: 1 |
Top |
Somatic mutation of malignant transformation related genes |
| Annotation of somatic variants for genes involved in malignant transformation |
| Hugo Symbol | Variant Class | Variant Classification | dbSNP RS | HGVSc | HGVSp | HGVSp Short | SWISSPROT | BIOTYPE | SIFT | PolyPhen | Tumor Sample Barcode | Tissue | Histology | Sex | Age | Stage | Therapy Types | Drugs | Outcome |
| ICE2 | SNV | Missense_Mutation | c.1805N>T | p.Arg602Ile | p.R602I | Q659A1 | protein_coding | tolerated(0.22) | benign(0) | TCGA-A2-A04Y-01 | Breast | breast invasive carcinoma | Female | <65 | I/II | Chemotherapy | cytoxan | SD | |
| ICE2 | SNV | Missense_Mutation | c.1597N>C | p.Asp533His | p.D533H | Q659A1 | protein_coding | deleterious(0.02) | benign(0.003) | TCGA-A8-A06Q-01 | Breast | breast invasive carcinoma | Female | <65 | III/IV | Unknown | Unknown | SD | |
| ICE2 | SNV | Missense_Mutation | novel | c.2606C>A | p.Ser869Tyr | p.S869Y | Q659A1 | protein_coding | deleterious(0) | probably_damaging(0.983) | TCGA-AN-A046-01 | Breast | breast invasive carcinoma | Female | >=65 | I/II | Unknown | Unknown | SD |
| ICE2 | SNV | Missense_Mutation | novel | c.164T>G | p.Leu55Trp | p.L55W | Q659A1 | protein_coding | deleterious(0.01) | probably_damaging(0.936) | TCGA-AN-A046-01 | Breast | breast invasive carcinoma | Female | >=65 | I/II | Unknown | Unknown | SD |
| ICE2 | SNV | Missense_Mutation | c.2588N>G | p.Ser863Cys | p.S863C | Q659A1 | protein_coding | deleterious(0) | probably_damaging(0.989) | TCGA-E2-A1LI-01 | Breast | breast invasive carcinoma | Female | <65 | I/II | Chemotherapy | adriamycin | SD | |
| ICE2 | insertion | Frame_Shift_Ins | novel | c.821_822insTA | p.Arg275ThrfsTer7 | p.R275Tfs*7 | Q659A1 | protein_coding | TCGA-A8-A08T-01 | Breast | breast invasive carcinoma | Female | <65 | III/IV | Unknown | Unknown | PD | ||
| ICE2 | insertion | Frame_Shift_Ins | novel | c.820_821insTTAAAAAATATATCACAATTAGATA | p.Ser274PhefsTer19 | p.S274Ffs*19 | Q659A1 | protein_coding | TCGA-A8-A08T-01 | Breast | breast invasive carcinoma | Female | <65 | III/IV | Unknown | Unknown | PD | ||
| ICE2 | SNV | Missense_Mutation | novel | c.1769N>A | p.Gly590Glu | p.G590E | Q659A1 | protein_coding | tolerated(1) | benign(0.001) | TCGA-C5-A2LZ-01 | Cervix | cervical & endocervical cancer | Female | >=65 | III/IV | Unknown | Unknown | PD |
| ICE2 | SNV | Missense_Mutation | novel | c.1435N>C | p.Glu479Gln | p.E479Q | Q659A1 | protein_coding | tolerated(0.07) | benign(0.055) | TCGA-C5-A2LZ-01 | Cervix | cervical & endocervical cancer | Female | >=65 | III/IV | Unknown | Unknown | PD |
| ICE2 | SNV | Missense_Mutation | c.44A>T | p.Asp15Val | p.D15V | Q659A1 | protein_coding | deleterious(0) | probably_damaging(0.988) | TCGA-AA-A01K-01 | Colorectum | colon adenocarcinoma | Female | >=65 | III/IV | Chemotherapy | folinic | CR |
| Page: 1 2 3 4 5 6 7 8 9 10 |
Top |
Related drugs of malignant transformation related genes |
| Identification of chemicals and drugs interact with genes involved in malignant transfromation |
| (DGIdb 4.0) |
| Entrez ID | Symbol | Category | Interaction Types | Drug Claim Name | Drug Name | PMIDs |
| Page: 1 |

Copyright 2023-Present -The University of Texas Health Science Center at Houston |