
|
|||||
|
 | |
| |
| |
| |
| |
| |
|
Gene: ICE1 |
Gene summary for ICE1 |
| Gene information | Species | Human | Gene symbol | ICE1 | Gene ID | 23379 |
| Gene name | interactor of little elongation complex ELL subunit 1 | |
| Gene Alias | KIAA0947 | |
| Cytomap | 5p15.32 | |
| Gene Type | protein-coding | GO ID | GO:0006139 | UniProtAcc | Q9Y2F5 |
Top |
Malignant transformation analysis |
| Identification of the aberrant gene expression in precancerous and cancerous lesions by comparing the gene expression of stem-like cells in diseased tissues with normal stem cells |
| Entrez ID | Symbol | Replicates | Species | Organ | Tissue | Adj P-value | Log2FC | Malignancy |
| 23379 | ICE1 | LZE2T | Human | Esophagus | ESCC | 4.42e-06 | 7.63e-01 | 0.082 |
| 23379 | ICE1 | LZE4T | Human | Esophagus | ESCC | 2.48e-09 | 8.95e-02 | 0.0811 |
| 23379 | ICE1 | LZE7T | Human | Esophagus | ESCC | 4.44e-03 | 6.52e-02 | 0.0667 |
| 23379 | ICE1 | LZE24T | Human | Esophagus | ESCC | 2.39e-08 | 2.05e-01 | 0.0596 |
| 23379 | ICE1 | P1T-E | Human | Esophagus | ESCC | 3.06e-15 | 5.90e-01 | 0.0875 |
| 23379 | ICE1 | P2T-E | Human | Esophagus | ESCC | 7.66e-36 | 6.50e-01 | 0.1177 |
| 23379 | ICE1 | P4T-E | Human | Esophagus | ESCC | 2.19e-30 | 7.40e-01 | 0.1323 |
| 23379 | ICE1 | P5T-E | Human | Esophagus | ESCC | 2.87e-27 | 5.24e-01 | 0.1327 |
| 23379 | ICE1 | P8T-E | Human | Esophagus | ESCC | 3.28e-25 | 4.42e-01 | 0.0889 |
| 23379 | ICE1 | P9T-E | Human | Esophagus | ESCC | 9.70e-21 | 3.20e-01 | 0.1131 |
| 23379 | ICE1 | P10T-E | Human | Esophagus | ESCC | 2.20e-31 | 6.47e-01 | 0.116 |
| 23379 | ICE1 | P11T-E | Human | Esophagus | ESCC | 5.52e-14 | 3.73e-01 | 0.1426 |
| 23379 | ICE1 | P12T-E | Human | Esophagus | ESCC | 3.43e-34 | 7.05e-01 | 0.1122 |
| 23379 | ICE1 | P15T-E | Human | Esophagus | ESCC | 1.21e-16 | 3.22e-01 | 0.1149 |
| 23379 | ICE1 | P16T-E | Human | Esophagus | ESCC | 7.31e-21 | 2.07e-01 | 0.1153 |
| 23379 | ICE1 | P17T-E | Human | Esophagus | ESCC | 9.88e-22 | 7.71e-01 | 0.1278 |
| 23379 | ICE1 | P19T-E | Human | Esophagus | ESCC | 1.24e-06 | 2.82e-01 | 0.1662 |
| 23379 | ICE1 | P20T-E | Human | Esophagus | ESCC | 8.38e-29 | 4.05e-01 | 0.1124 |
| 23379 | ICE1 | P21T-E | Human | Esophagus | ESCC | 2.75e-24 | 4.74e-01 | 0.1617 |
| 23379 | ICE1 | P22T-E | Human | Esophagus | ESCC | 2.53e-20 | 3.38e-01 | 0.1236 |
| Page: 1 2 3 4 5 |
| Tissue | Expression Dynamics | Abbreviation |
| Esophagus | 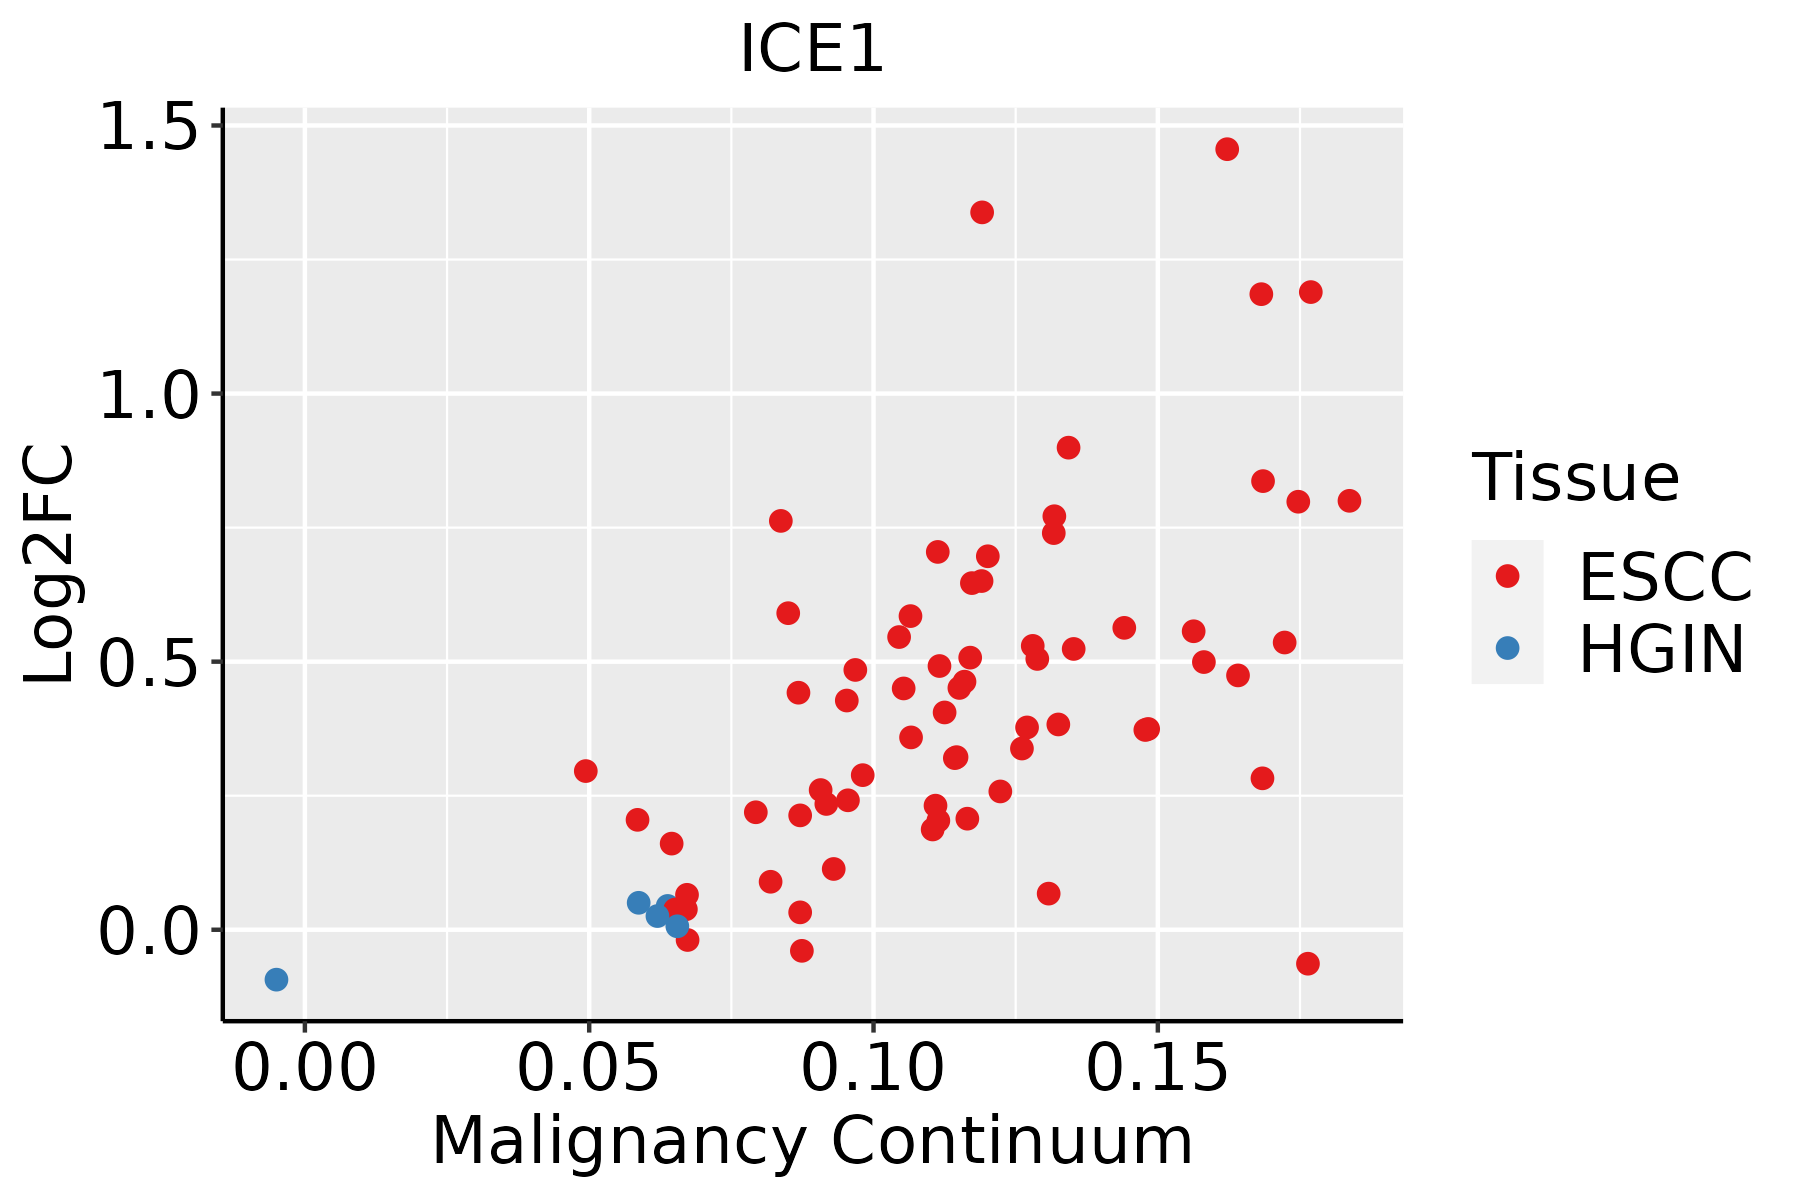 | ESCC: Esophageal squamous cell carcinoma |
| HGIN: High-grade intraepithelial neoplasias | ||
| LGIN: Low-grade intraepithelial neoplasias | ||
| Liver | 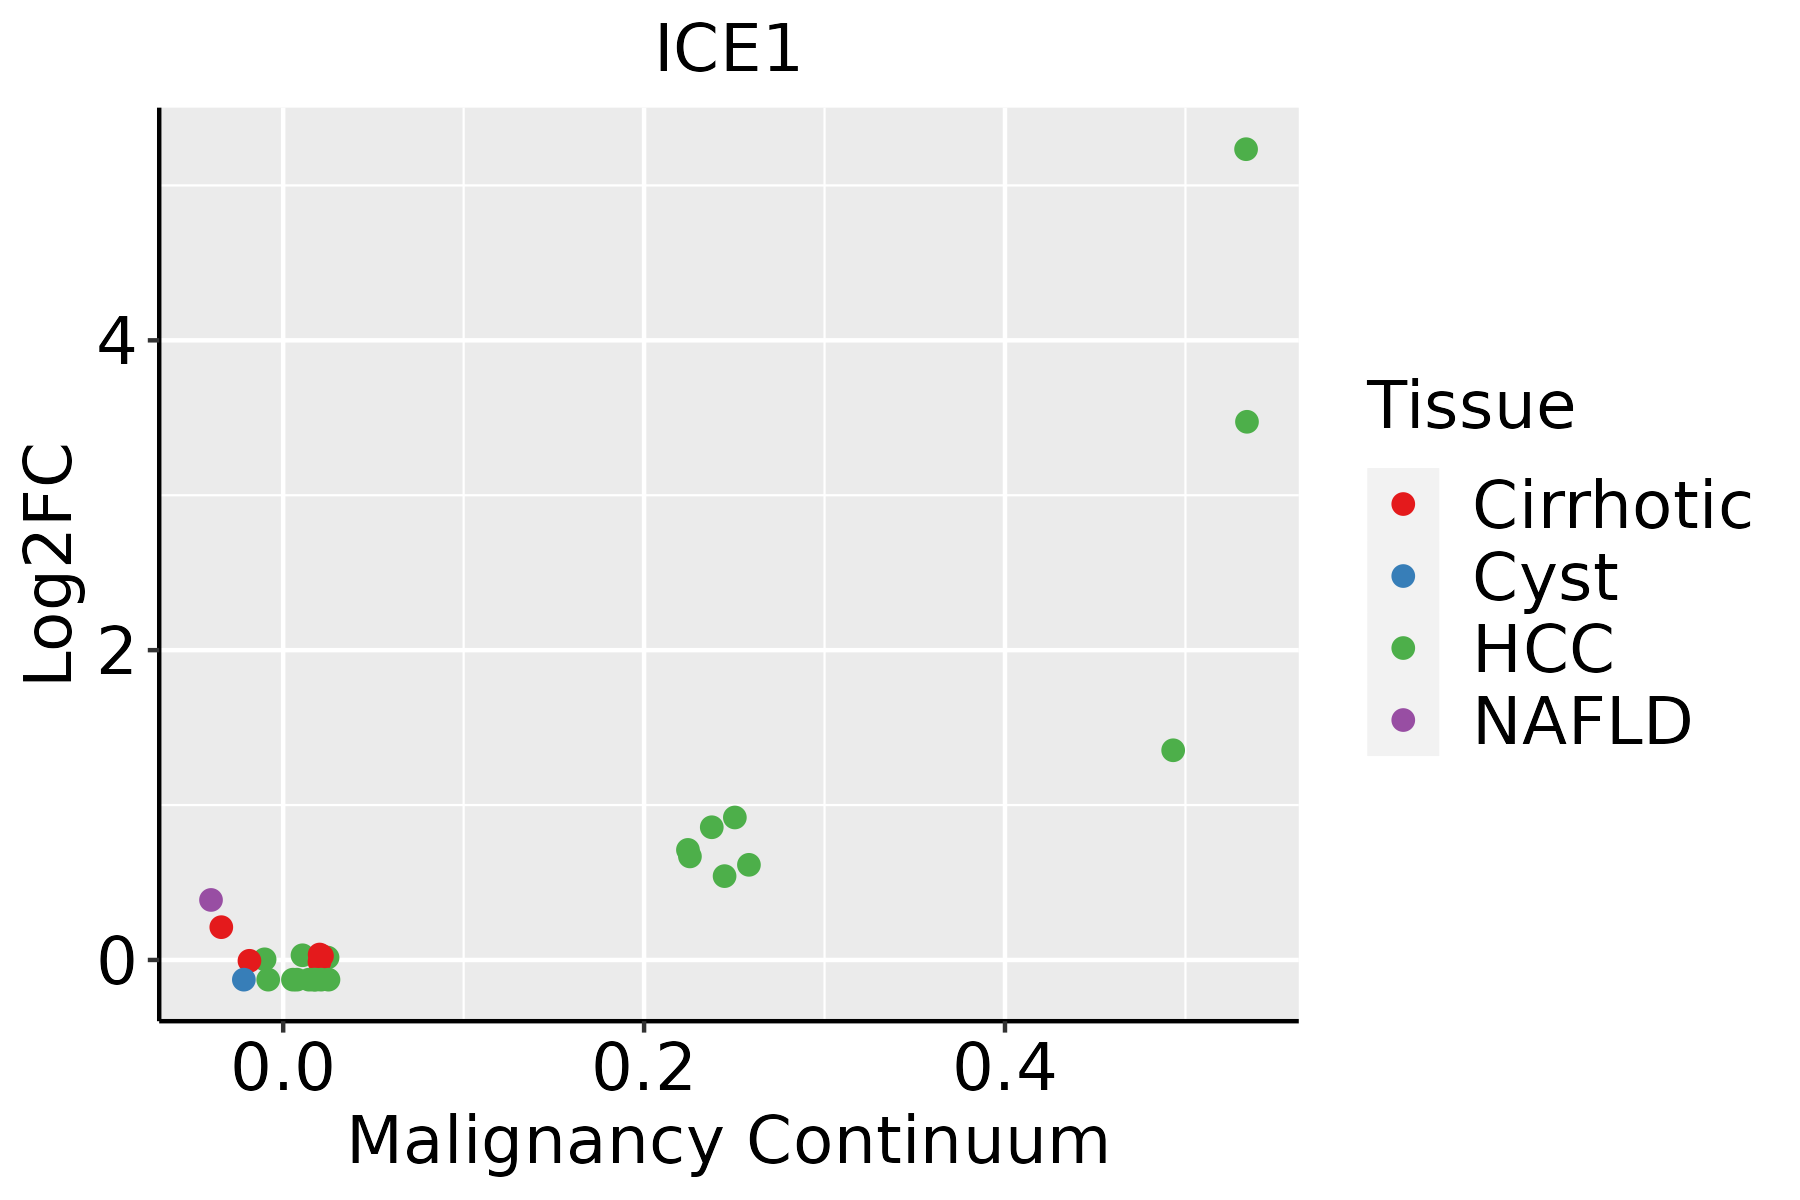 | HCC: Hepatocellular carcinoma |
| NAFLD: Non-alcoholic fatty liver disease | ||
| Oral Cavity |  | EOLP: Erosive Oral lichen planus |
| LP: leukoplakia | ||
| NEOLP: Non-erosive oral lichen planus | ||
| OSCC: Oral squamous cell carcinoma | ||
| Thyroid |  | ATC: Anaplastic thyroid cancer |
| HT: Hashimoto's thyroiditis | ||
| PTC: Papillary thyroid cancer |
| ∗log2FC in expression of this searched gene in stem-like cells from each diseased tissue sample relative to stem-like cells in normal samples in each tissue plotted against the malignancy continuum. Samples are colored based on if they are from different disease stage. |
Top |
Malignant transformation related pathway analysis |
| Find out the enriched GO biological processes and KEGG pathways involved in transition from healthy to precancer to cancer |
| Tissue | Disease Stage | Enriched GO biological Processes |
| Colorectum | AD |  |
| Colorectum | SER |  |
| Colorectum | MSS |  |
| Colorectum | MSI-H |  |
| Colorectum | FAP |  |
| ∗Top 15 enriched GO BP terms are showed in the bar plot of each disease state in each tissue. Each row represents a significant GO biological process which is colored according to the -log10(p.adjust). |
| Page: 1 2 3 4 5 6 7 8 9 |
| GO ID | Tissue | Disease Stage | Description | Gene Ratio | Bg Ratio | pvalue | p.adjust | Count |
| GO:0051656 | Colorectum | AD | establishment of organelle localization | 131/3918 | 390/18723 | 3.00e-09 | 2.06e-07 | 131 |
| GO:0007051 | Colorectum | AD | spindle organization | 58/3918 | 184/18723 | 4.71e-04 | 5.20e-03 | 58 |
| GO:1902850 | Colorectum | AD | microtubule cytoskeleton organization involved in mitosis | 48/3918 | 147/18723 | 5.87e-04 | 6.21e-03 | 48 |
| GO:0090307 | Colorectum | AD | mitotic spindle assembly | 25/3918 | 65/18723 | 9.12e-04 | 8.71e-03 | 25 |
| GO:0007052 | Colorectum | AD | mitotic spindle organization | 40/3918 | 120/18723 | 1.03e-03 | 9.61e-03 | 40 |
| GO:0051225 | Colorectum | AD | spindle assembly | 37/3918 | 117/18723 | 4.32e-03 | 2.96e-02 | 37 |
| GO:0140014 | Colorectum | AD | mitotic nuclear division | 78/3918 | 287/18723 | 6.48e-03 | 4.05e-02 | 78 |
| GO:0046605 | Colorectum | AD | regulation of centrosome cycle | 18/3918 | 49/18723 | 7.93e-03 | 4.73e-02 | 18 |
| GO:00516561 | Colorectum | SER | establishment of organelle localization | 100/2897 | 390/18723 | 1.11e-07 | 6.79e-06 | 100 |
| GO:00466051 | Colorectum | SER | regulation of centrosome cycle | 17/2897 | 49/18723 | 7.17e-04 | 9.44e-03 | 17 |
| GO:0010824 | Colorectum | SER | regulation of centrosome duplication | 15/2897 | 45/18723 | 2.29e-03 | 2.19e-02 | 15 |
| GO:00516562 | Colorectum | MSS | establishment of organelle localization | 115/3467 | 390/18723 | 7.30e-08 | 3.67e-06 | 115 |
| GO:00070511 | Colorectum | MSS | spindle organization | 53/3467 | 184/18723 | 4.23e-04 | 5.19e-03 | 53 |
| GO:19028501 | Colorectum | MSS | microtubule cytoskeleton organization involved in mitosis | 44/3467 | 147/18723 | 5.17e-04 | 5.98e-03 | 44 |
| GO:00070521 | Colorectum | MSS | mitotic spindle organization | 36/3467 | 120/18723 | 1.52e-03 | 1.39e-02 | 36 |
| GO:00903071 | Colorectum | MSS | mitotic spindle assembly | 22/3467 | 65/18723 | 2.33e-03 | 1.90e-02 | 22 |
| GO:00512251 | Colorectum | MSS | spindle assembly | 33/3467 | 117/18723 | 6.68e-03 | 4.38e-02 | 33 |
| GO:01400141 | Colorectum | MSS | mitotic nuclear division | 70/3467 | 287/18723 | 7.48e-03 | 4.72e-02 | 70 |
| GO:00516563 | Colorectum | FAP | establishment of organelle localization | 97/2622 | 390/18723 | 5.91e-09 | 9.48e-07 | 97 |
| GO:00070512 | Colorectum | FAP | spindle organization | 41/2622 | 184/18723 | 1.50e-03 | 1.34e-02 | 41 |
| Page: 1 2 3 4 5 |
| Pathway ID | Tissue | Disease Stage | Description | Gene Ratio | Bg Ratio | pvalue | p.adjust | qvalue | Count |
| Page: 1 |
Top |
Cell-cell communication analysis |
| Identification of potential cell-cell interactions between two cell types and their ligand-receptor pairs for different disease states |
| Ligand | Receptor | LRpair | Pathway | Tissue | Disease Stage |
| Page: 1 |
Top |
Single-cell gene regulatory network inference analysis |
| Find out the significant the regulons (TFs) and the target genes of each regulon across cell types for different disease states |
| TF | Cell Type | Tissue | Disease Stage | Target Gene | RSS | Regulon Activity |
| ∗The dot plots of a searched regulon are shown for all cell subpopulations in each disease state of each tissue based on the regulon specific score inferred using pySCENIC and by calculating the average expression. |
| Page: 1 |
Top |
Somatic mutation of malignant transformation related genes |
| Annotation of somatic variants for genes involved in malignant transformation |
| Hugo Symbol | Variant Class | Variant Classification | dbSNP RS | HGVSc | HGVSp | HGVSp Short | SWISSPROT | BIOTYPE | SIFT | PolyPhen | Tumor Sample Barcode | Tissue | Histology | Sex | Age | Stage | Therapy Types | Drugs | Outcome |
| ICE1 | SNV | Missense_Mutation | novel | c.3328N>C | p.Glu1110Gln | p.E1110Q | Q9Y2F5 | protein_coding | deleterious(0.01) | benign(0.289) | TCGA-5L-AAT1-01 | Breast | breast invasive carcinoma | Female | <65 | III/IV | Hormone Therapy | letrozol | SD |
| ICE1 | SNV | Missense_Mutation | novel | c.1897T>C | p.Ser633Pro | p.S633P | Q9Y2F5 | protein_coding | tolerated(0.14) | benign(0.043) | TCGA-A2-A0EQ-01 | Breast | breast invasive carcinoma | Female | <65 | I/II | Chemotherapy | adriamycin | SD |
| ICE1 | SNV | Missense_Mutation | novel | c.4735N>T | p.His1579Tyr | p.H1579Y | Q9Y2F5 | protein_coding | tolerated(0.12) | benign(0.132) | TCGA-A7-A56D-01 | Breast | breast invasive carcinoma | Female | >=65 | I/II | Hormone Therapy | arimidex | SD |
| ICE1 | SNV | Missense_Mutation | c.147N>A | p.Asn49Lys | p.N49K | Q9Y2F5 | protein_coding | deleterious(0.01) | probably_damaging(0.998) | TCGA-A8-A076-01 | Breast | breast invasive carcinoma | Female | >=65 | I/II | Hormone Therapy | anastrozole | SD | |
| ICE1 | SNV | Missense_Mutation | novel | c.5107N>A | p.Ala1703Thr | p.A1703T | Q9Y2F5 | protein_coding | tolerated(0.09) | benign(0.338) | TCGA-A8-A07G-01 | Breast | breast invasive carcinoma | Female | >=65 | I/II | Chemotherapy | 5-fluorouracil | CR |
| ICE1 | SNV | Missense_Mutation | rs749575254 | c.4526G>A | p.Arg1509His | p.R1509H | Q9Y2F5 | protein_coding | deleterious(0.03) | probably_damaging(0.973) | TCGA-A8-A09A-01 | Breast | breast invasive carcinoma | Female | <65 | I/II | Hormone Therapy | tamoxiphen | SD |
| ICE1 | SNV | Missense_Mutation | c.3484N>C | p.Ser1162Arg | p.S1162R | Q9Y2F5 | protein_coding | deleterious(0) | possibly_damaging(0.714) | TCGA-A8-A09Q-01 | Breast | breast invasive carcinoma | Female | >=65 | III/IV | Hormone Therapy | anastrozole | SD | |
| ICE1 | SNV | Missense_Mutation | c.1560N>C | p.Glu520Asp | p.E520D | Q9Y2F5 | protein_coding | tolerated(0.4) | benign(0.001) | TCGA-AC-A23H-01 | Breast | breast invasive carcinoma | Female | >=65 | I/II | Unknown | Unknown | PD | |
| ICE1 | SNV | Missense_Mutation | c.2434N>A | p.Glu812Lys | p.E812K | Q9Y2F5 | protein_coding | deleterious(0.04) | benign(0.342) | TCGA-AC-A5XS-01 | Breast | breast invasive carcinoma | Female | >=65 | I/II | Hormone Therapy | femara | SD | |
| ICE1 | SNV | Missense_Mutation | rs773709911 | c.4036C>T | p.Pro1346Ser | p.P1346S | Q9Y2F5 | protein_coding | tolerated(0.23) | benign(0.125) | TCGA-AN-A0AK-01 | Breast | breast invasive carcinoma | Female | >=65 | I/II | Unknown | Unknown | SD |
| Page: 1 2 3 4 5 6 7 8 9 10 11 12 13 14 15 16 17 18 19 20 21 22 23 24 25 26 27 28 29 30 31 |
Top |
Related drugs of malignant transformation related genes |
| Identification of chemicals and drugs interact with genes involved in malignant transfromation |
| (DGIdb 4.0) |
| Entrez ID | Symbol | Category | Interaction Types | Drug Claim Name | Drug Name | PMIDs |
| Page: 1 |

Copyright 2023-Present -The University of Texas Health Science Center at Houston |