
|
|||||
|
 | |
| |
| |
| |
| |
| |
|
Gene: ICAM4 |
Gene summary for ICAM4 |
| Gene information | Species | Human | Gene symbol | ICAM4 | Gene ID | 3386 |
| Gene name | intercellular adhesion molecule 4 (Landsteiner-Wiener blood group) | |
| Gene Alias | CD242 | |
| Cytomap | 19p13.2 | |
| Gene Type | protein-coding | GO ID | GO:0007155 | UniProtAcc | Q14773 |
Top |
Malignant transformation analysis |
| Identification of the aberrant gene expression in precancerous and cancerous lesions by comparing the gene expression of stem-like cells in diseased tissues with normal stem cells |
| Entrez ID | Symbol | Replicates | Species | Organ | Tissue | Adj P-value | Log2FC | Malignancy |
| 3386 | ICAM4 | LZE22T | Human | Esophagus | ESCC | 1.12e-02 | 1.77e-01 | 0.068 |
| 3386 | ICAM4 | P8T-E | Human | Esophagus | ESCC | 7.19e-19 | 4.03e-01 | 0.0889 |
| 3386 | ICAM4 | P10T-E | Human | Esophagus | ESCC | 5.59e-03 | 2.58e-02 | 0.116 |
| 3386 | ICAM4 | P31T-E | Human | Esophagus | ESCC | 4.65e-02 | 8.34e-03 | 0.1251 |
| 3386 | ICAM4 | P36T-E | Human | Esophagus | ESCC | 8.80e-04 | 8.12e-02 | 0.1187 |
| 3386 | ICAM4 | P65T-E | Human | Esophagus | ESCC | 2.73e-06 | 1.63e-01 | 0.0978 |
| 3386 | ICAM4 | P74T-E | Human | Esophagus | ESCC | 5.56e-19 | 6.77e-01 | 0.1479 |
| 3386 | ICAM4 | P75T-E | Human | Esophagus | ESCC | 1.11e-03 | 1.42e-01 | 0.1125 |
| 3386 | ICAM4 | P79T-E | Human | Esophagus | ESCC | 1.41e-03 | 3.95e-02 | 0.1154 |
| 3386 | ICAM4 | P127T-E | Human | Esophagus | ESCC | 3.50e-02 | 4.08e-02 | 0.0826 |
| 3386 | ICAM4 | P130T-E | Human | Esophagus | ESCC | 2.48e-21 | 5.08e-01 | 0.1676 |
| 3386 | ICAM4 | HCC1 | Human | Liver | HCC | 3.12e-03 | 5.89e-01 | 0.5336 |
| 3386 | ICAM4 | HCC2 | Human | Liver | HCC | 1.32e-03 | 8.95e-01 | 0.5341 |
| 3386 | ICAM4 | C43 | Human | Oral cavity | OSCC | 8.91e-18 | 3.22e-01 | 0.1704 |
| 3386 | ICAM4 | C46 | Human | Oral cavity | OSCC | 4.98e-13 | 4.13e-01 | 0.1673 |
| 3386 | ICAM4 | LN22 | Human | Oral cavity | OSCC | 1.26e-05 | 6.92e-01 | 0.1733 |
| 3386 | ICAM4 | LN38 | Human | Oral cavity | OSCC | 2.48e-03 | 6.70e-01 | 0.168 |
| 3386 | ICAM4 | LN46 | Human | Oral cavity | OSCC | 2.36e-16 | 5.81e-01 | 0.1666 |
| Page: 1 |
| Tissue | Expression Dynamics | Abbreviation |
| Esophagus |  | ESCC: Esophageal squamous cell carcinoma |
| HGIN: High-grade intraepithelial neoplasias | ||
| LGIN: Low-grade intraepithelial neoplasias | ||
| Liver |  | HCC: Hepatocellular carcinoma |
| NAFLD: Non-alcoholic fatty liver disease | ||
| Oral Cavity | 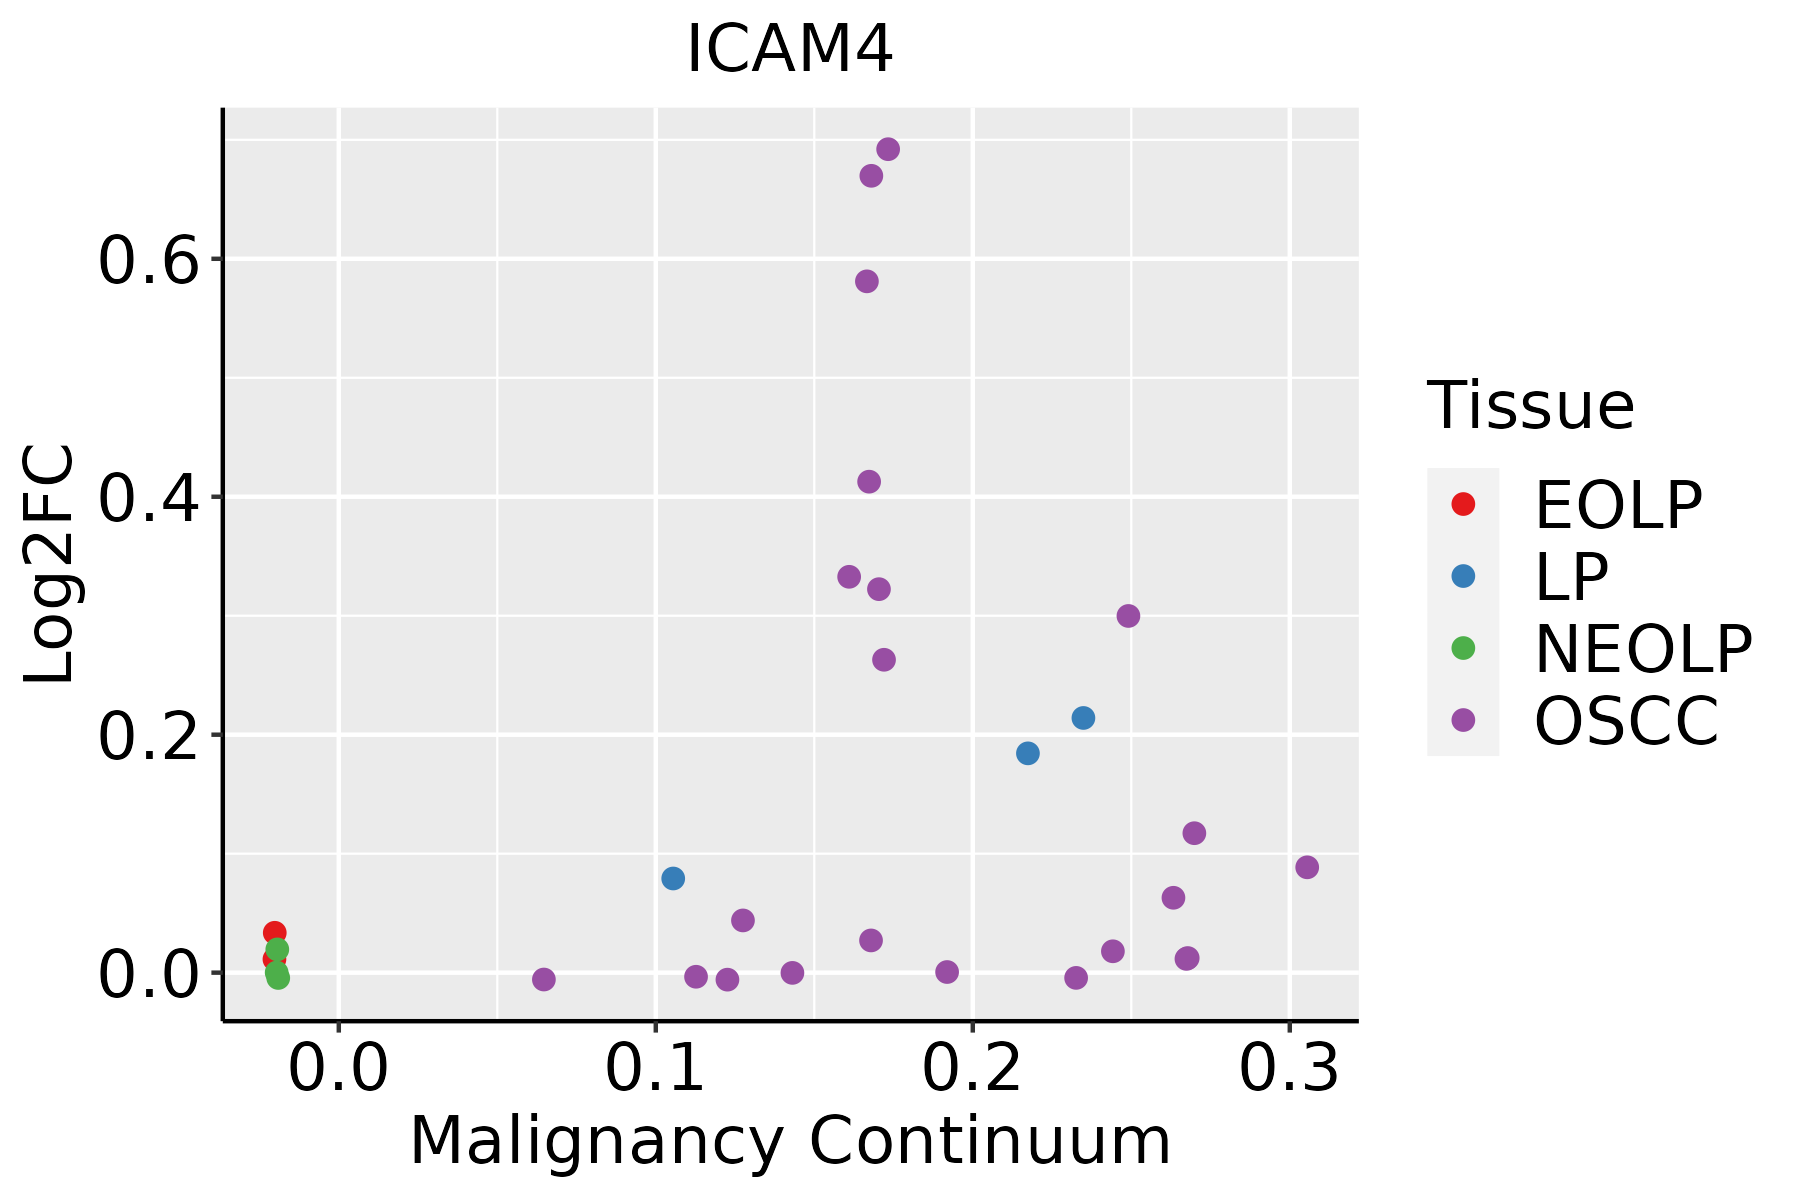 | EOLP: Erosive Oral lichen planus |
| LP: leukoplakia | ||
| NEOLP: Non-erosive oral lichen planus | ||
| OSCC: Oral squamous cell carcinoma |
| ∗log2FC in expression of this searched gene in stem-like cells from each diseased tissue sample relative to stem-like cells in normal samples in each tissue plotted against the malignancy continuum. Samples are colored based on if they are from different disease stage. |
Top |
Malignant transformation related pathway analysis |
| Find out the enriched GO biological processes and KEGG pathways involved in transition from healthy to precancer to cancer |
| Tissue | Disease Stage | Enriched GO biological Processes |
| Colorectum | AD |  |
| Colorectum | SER |  |
| Colorectum | MSS |  |
| Colorectum | MSI-H |  |
| Colorectum | FAP |  |
| ∗Top 15 enriched GO BP terms are showed in the bar plot of each disease state in each tissue. Each row represents a significant GO biological process which is colored according to the -log10(p.adjust). |
| Page: 1 2 3 4 5 6 7 8 9 |
| GO ID | Tissue | Disease Stage | Description | Gene Ratio | Bg Ratio | pvalue | p.adjust | Count |
| Page: 1 |
| Pathway ID | Tissue | Disease Stage | Description | Gene Ratio | Bg Ratio | pvalue | p.adjust | qvalue | Count |
| Page: 1 |
Top |
Cell-cell communication analysis |
| Identification of potential cell-cell interactions between two cell types and their ligand-receptor pairs for different disease states |
| Ligand | Receptor | LRpair | Pathway | Tissue | Disease Stage |
| Page: 1 |
Top |
Single-cell gene regulatory network inference analysis |
| Find out the significant the regulons (TFs) and the target genes of each regulon across cell types for different disease states |
| TF | Cell Type | Tissue | Disease Stage | Target Gene | RSS | Regulon Activity |
| ∗The dot plots of a searched regulon are shown for all cell subpopulations in each disease state of each tissue based on the regulon specific score inferred using pySCENIC and by calculating the average expression. |
| Page: 1 |
Top |
Somatic mutation of malignant transformation related genes |
| Annotation of somatic variants for genes involved in malignant transformation |
| Hugo Symbol | Variant Class | Variant Classification | dbSNP RS | HGVSc | HGVSp | HGVSp Short | SWISSPROT | BIOTYPE | SIFT | PolyPhen | Tumor Sample Barcode | Tissue | Histology | Sex | Age | Stage | Therapy Types | Drugs | Outcome |
| ICAM4 | SNV | Missense_Mutation | c.115N>T | p.Leu39Phe | p.L39F | Q14773 | protein_coding | tolerated_low_confidence(0.19) | benign(0.198) | TCGA-AC-A23H-01 | Breast | breast invasive carcinoma | Female | >=65 | I/II | Unknown | Unknown | PD | |
| ICAM4 | SNV | Missense_Mutation | c.743N>T | p.Gly248Val | p.G248V | Q14773 | protein_coding | tolerated_low_confidence(0.07) | benign(0.088) | TCGA-AA-3966-01 | Colorectum | colon adenocarcinoma | Female | >=65 | I/II | Unknown | Unknown | SD | |
| ICAM4 | SNV | Missense_Mutation | novel | c.172N>A | p.Ala58Thr | p.A58T | Q14773 | protein_coding | tolerated_low_confidence(0.07) | probably_damaging(0.996) | TCGA-DM-A0XF-01 | Colorectum | colon adenocarcinoma | Female | >=65 | III/IV | Chemotherapy | mayo | CR |
| ICAM4 | SNV | Missense_Mutation | rs151158164 | c.587C>T | p.Pro196Leu | p.P196L | Q14773 | protein_coding | deleterious_low_confidence(0) | benign(0.247) | TCGA-G4-6309-01 | Colorectum | colon adenocarcinoma | Female | <65 | III/IV | Chemotherapy | xeloda | PD |
| ICAM4 | SNV | Missense_Mutation | c.653N>A | p.Arg218Gln | p.R218Q | Q14773 | protein_coding | tolerated_low_confidence(0.12) | benign(0.001) | TCGA-AG-A002-01 | Colorectum | rectum adenocarcinoma | Male | <65 | I/II | Unknown | Unknown | SD | |
| ICAM4 | SNV | Missense_Mutation | rs370615268 | c.700G>A | p.Val234Ile | p.V234I | Q14773 | protein_coding | deleterious_low_confidence(0) | benign(0.013) | TCGA-F5-6814-01 | Colorectum | rectum adenocarcinoma | Male | <65 | I/II | Unknown | Unknown | SD |
| ICAM4 | SNV | Missense_Mutation | c.245N>A | p.Arg82His | p.R82H | Q14773 | protein_coding | deleterious_low_confidence(0.04) | benign(0.073) | TCGA-AP-A059-01 | Endometrium | uterine corpus endometrioid carcinoma | Female | >=65 | I/II | Unknown | Unknown | SD | |
| ICAM4 | SNV | Missense_Mutation | c.719N>T | p.Ser240Ile | p.S240I | Q14773 | protein_coding | deleterious_low_confidence(0) | benign(0) | TCGA-AP-A059-01 | Endometrium | uterine corpus endometrioid carcinoma | Female | >=65 | I/II | Unknown | Unknown | SD | |
| ICAM4 | SNV | Missense_Mutation | c.494N>A | p.Arg165His | p.R165H | Q14773 | protein_coding | deleterious_low_confidence(0.01) | benign(0.339) | TCGA-AX-A0J1-01 | Endometrium | uterine corpus endometrioid carcinoma | Female | >=65 | I/II | Unknown | Unknown | SD | |
| ICAM4 | SNV | Missense_Mutation | novel | c.496G>T | p.Asp166Tyr | p.D166Y | Q14773 | protein_coding | deleterious_low_confidence(0) | probably_damaging(0.914) | TCGA-BK-A6W3-01 | Endometrium | uterine corpus endometrioid carcinoma | Female | <65 | I/II | Unknown | Unknown | SD |
| Page: 1 2 3 |
Top |
Related drugs of malignant transformation related genes |
| Identification of chemicals and drugs interact with genes involved in malignant transfromation |
| (DGIdb 4.0) |
| Entrez ID | Symbol | Category | Interaction Types | Drug Claim Name | Drug Name | PMIDs |
| Page: 1 |

Copyright 2023-Present -The University of Texas Health Science Center at Houston |