
|
|||||
|
 | |
| |
| |
| |
| |
| |
|
Gene: ICAM3 |
Gene summary for ICAM3 |
| Gene information | Species | Human | Gene symbol | ICAM3 | Gene ID | 3385 |
| Gene name | intercellular adhesion molecule 3 | |
| Gene Alias | CD50 | |
| Cytomap | 19p13.2 | |
| Gene Type | protein-coding | GO ID | GO:0006810 | UniProtAcc | K7ERN2 |
Top |
Malignant transformation analysis |
| Identification of the aberrant gene expression in precancerous and cancerous lesions by comparing the gene expression of stem-like cells in diseased tissues with normal stem cells |
| Entrez ID | Symbol | Replicates | Species | Organ | Tissue | Adj P-value | Log2FC | Malignancy |
| 3385 | ICAM3 | LZE4T | Human | Esophagus | ESCC | 2.37e-02 | 1.07e-01 | 0.0811 |
| 3385 | ICAM3 | LZE7T | Human | Esophagus | ESCC | 1.40e-08 | 4.47e-01 | 0.0667 |
| 3385 | ICAM3 | LZE20T | Human | Esophagus | ESCC | 7.90e-04 | 9.73e-02 | 0.0662 |
| 3385 | ICAM3 | LZE22D1 | Human | Esophagus | HGIN | 1.90e-05 | 2.29e-01 | 0.0595 |
| 3385 | ICAM3 | LZE22T | Human | Esophagus | ESCC | 1.57e-02 | 1.48e-01 | 0.068 |
| 3385 | ICAM3 | LZE24T | Human | Esophagus | ESCC | 9.19e-06 | 1.33e-01 | 0.0596 |
| 3385 | ICAM3 | LZE6T | Human | Esophagus | ESCC | 3.01e-06 | 3.10e-01 | 0.0845 |
| 3385 | ICAM3 | P4T-E | Human | Esophagus | ESCC | 1.36e-04 | 8.46e-02 | 0.1323 |
| 3385 | ICAM3 | P8T-E | Human | Esophagus | ESCC | 8.73e-09 | 1.30e-01 | 0.0889 |
| 3385 | ICAM3 | P9T-E | Human | Esophagus | ESCC | 1.11e-03 | 8.40e-02 | 0.1131 |
| 3385 | ICAM3 | P11T-E | Human | Esophagus | ESCC | 2.46e-02 | 1.02e-01 | 0.1426 |
| 3385 | ICAM3 | P12T-E | Human | Esophagus | ESCC | 2.51e-03 | 1.84e-02 | 0.1122 |
| 3385 | ICAM3 | P19T-E | Human | Esophagus | ESCC | 5.57e-05 | 3.61e-01 | 0.1662 |
| 3385 | ICAM3 | P23T-E | Human | Esophagus | ESCC | 7.44e-12 | 2.46e-01 | 0.108 |
| 3385 | ICAM3 | P24T-E | Human | Esophagus | ESCC | 2.94e-07 | 1.08e-01 | 0.1287 |
| 3385 | ICAM3 | P31T-E | Human | Esophagus | ESCC | 2.91e-02 | 4.37e-02 | 0.1251 |
| 3385 | ICAM3 | P32T-E | Human | Esophagus | ESCC | 1.17e-04 | 1.17e-01 | 0.1666 |
| 3385 | ICAM3 | P37T-E | Human | Esophagus | ESCC | 1.24e-04 | 7.90e-02 | 0.1371 |
| 3385 | ICAM3 | P39T-E | Human | Esophagus | ESCC | 8.52e-05 | 6.12e-02 | 0.0894 |
| 3385 | ICAM3 | P42T-E | Human | Esophagus | ESCC | 2.79e-04 | 9.88e-02 | 0.1175 |
| Page: 1 2 3 4 |
| Tissue | Expression Dynamics | Abbreviation |
| Esophagus | 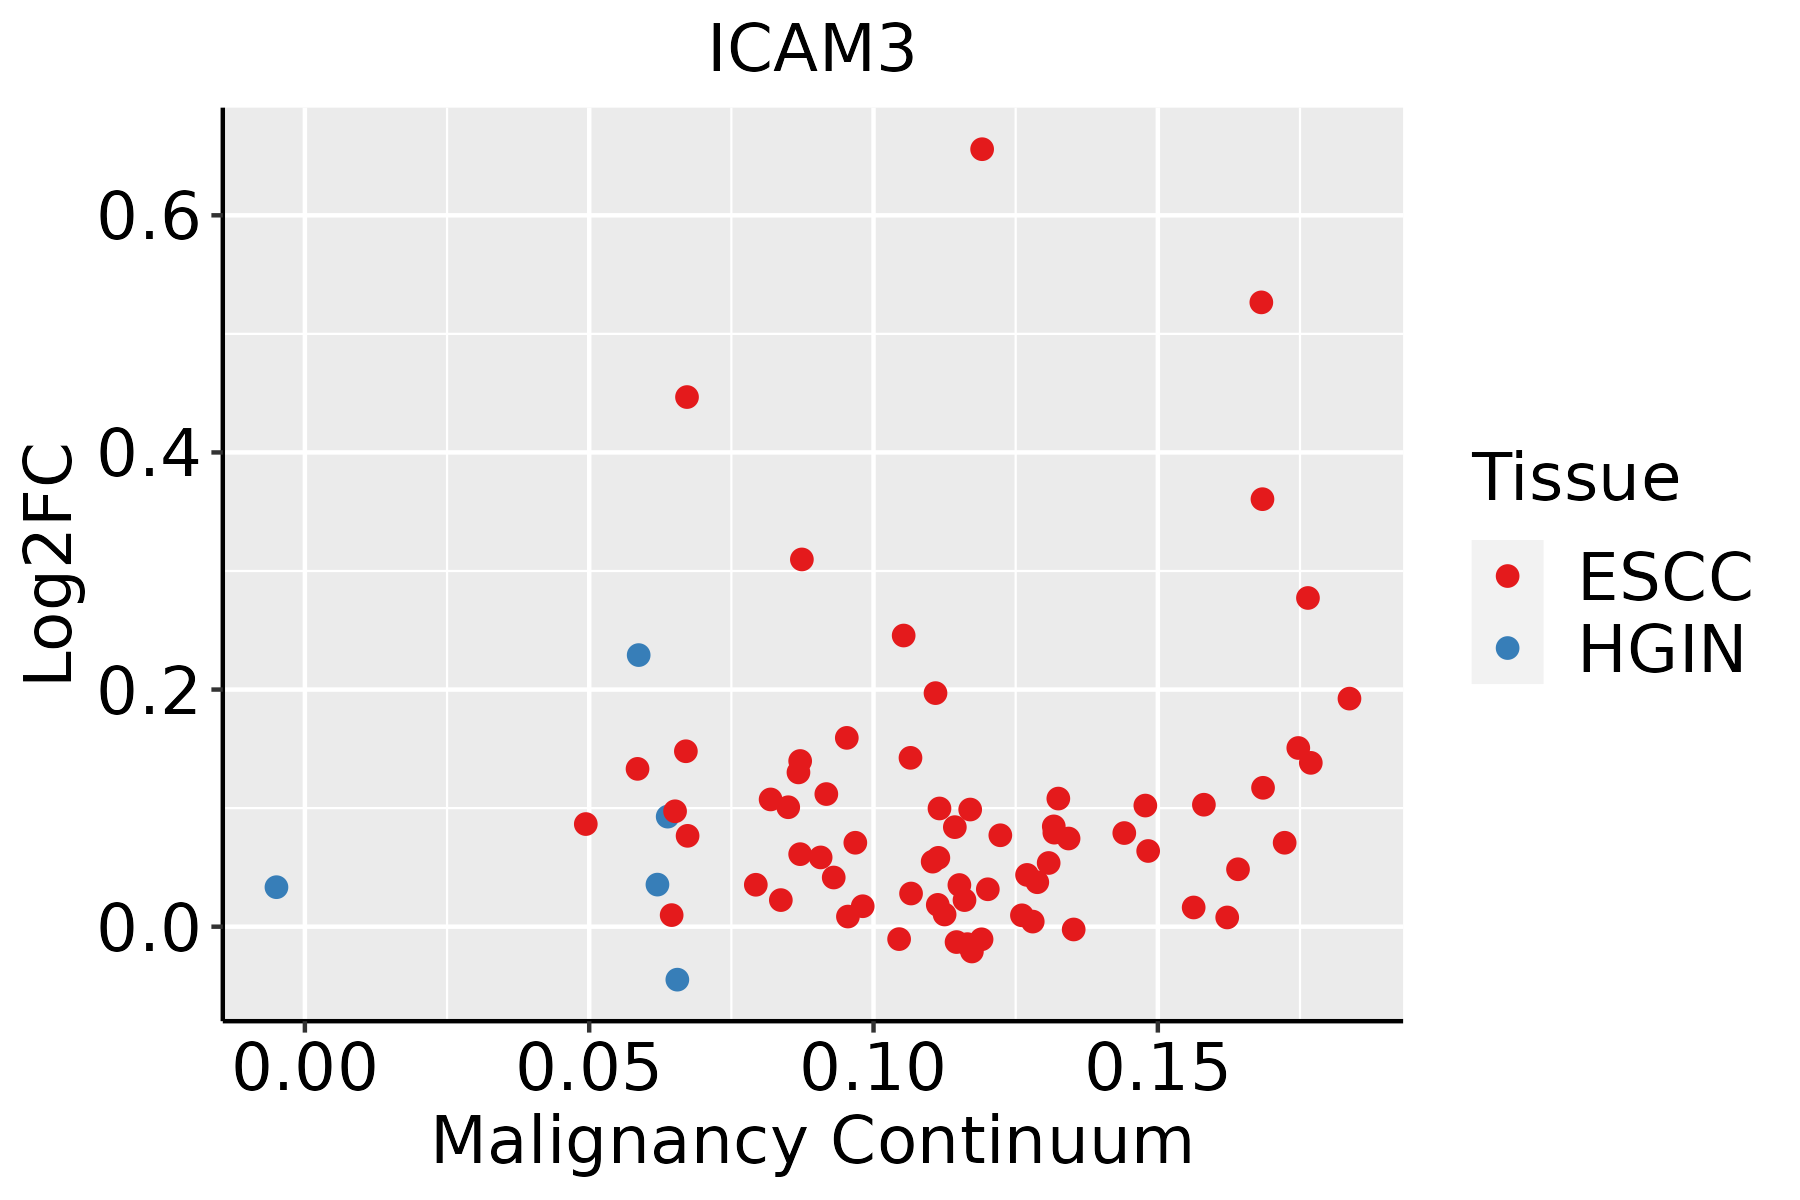 | ESCC: Esophageal squamous cell carcinoma |
| HGIN: High-grade intraepithelial neoplasias | ||
| LGIN: Low-grade intraepithelial neoplasias | ||
| Liver | 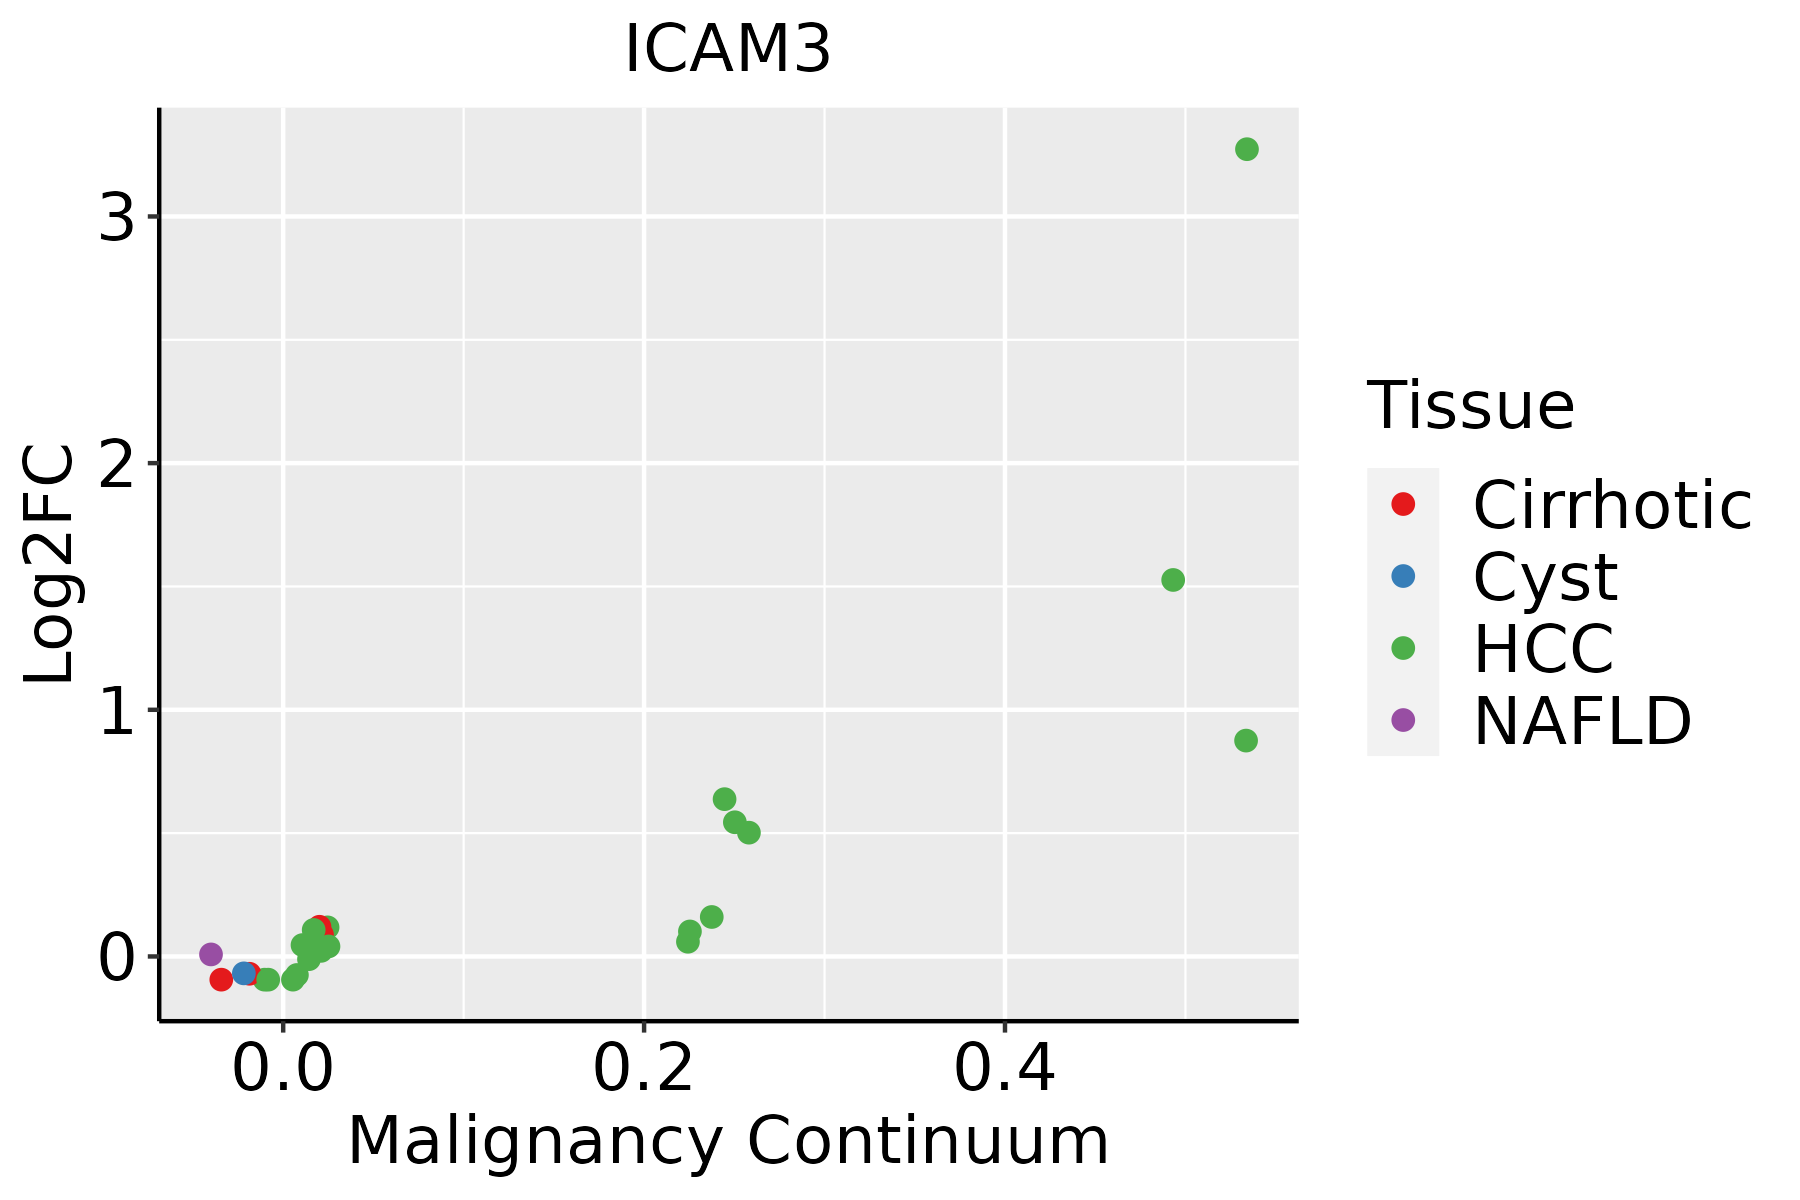 | HCC: Hepatocellular carcinoma |
| NAFLD: Non-alcoholic fatty liver disease | ||
| Oral Cavity | 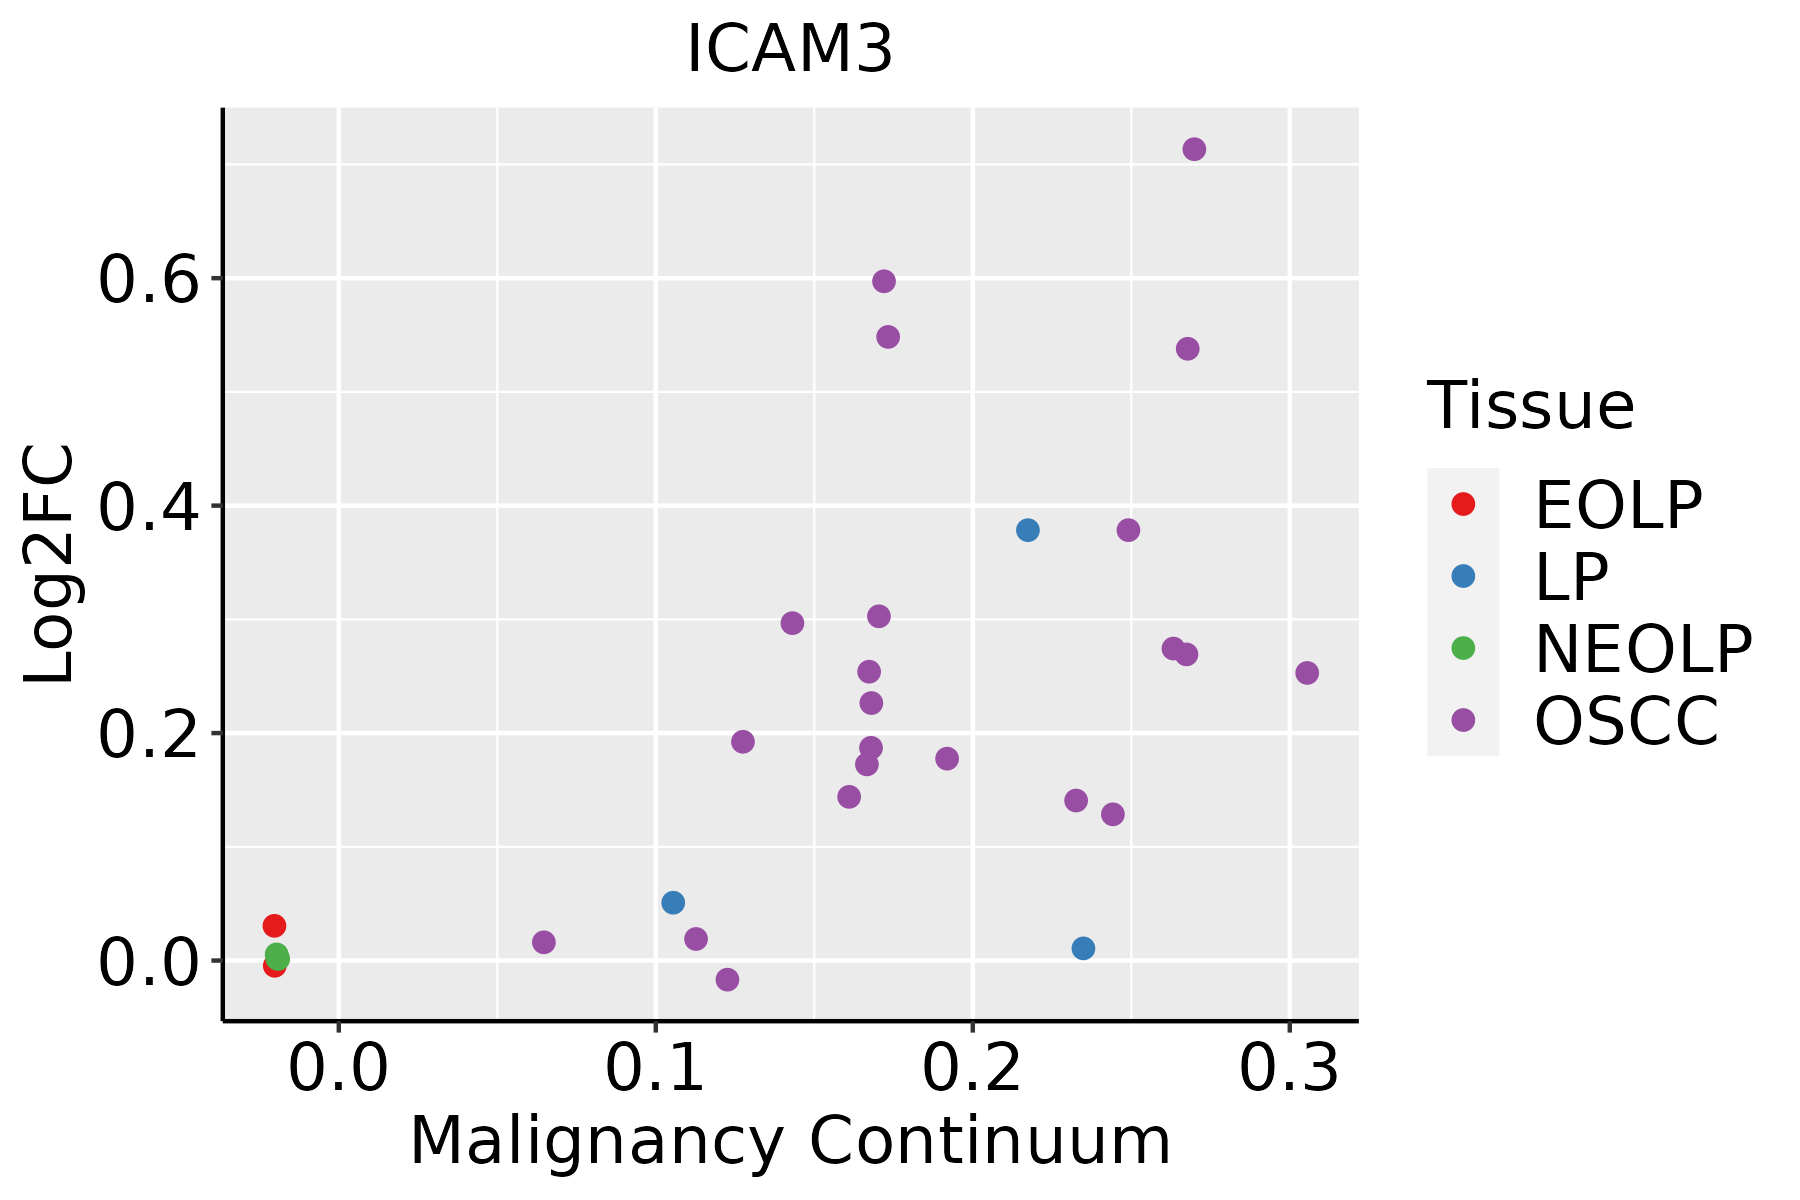 | EOLP: Erosive Oral lichen planus |
| LP: leukoplakia | ||
| NEOLP: Non-erosive oral lichen planus | ||
| OSCC: Oral squamous cell carcinoma | ||
| Thyroid |  | ATC: Anaplastic thyroid cancer |
| HT: Hashimoto's thyroiditis | ||
| PTC: Papillary thyroid cancer |
| ∗log2FC in expression of this searched gene in stem-like cells from each diseased tissue sample relative to stem-like cells in normal samples in each tissue plotted against the malignancy continuum. Samples are colored based on if they are from different disease stage. |
Top |
Malignant transformation related pathway analysis |
| Find out the enriched GO biological processes and KEGG pathways involved in transition from healthy to precancer to cancer |
| Tissue | Disease Stage | Enriched GO biological Processes |
| Colorectum | AD |  |
| Colorectum | SER |  |
| Colorectum | MSS |  |
| Colorectum | MSI-H |  |
| Colorectum | FAP |  |
| ∗Top 15 enriched GO BP terms are showed in the bar plot of each disease state in each tissue. Each row represents a significant GO biological process which is colored according to the -log10(p.adjust). |
| Page: 1 2 3 4 5 6 7 8 9 |
| GO ID | Tissue | Disease Stage | Description | Gene Ratio | Bg Ratio | pvalue | p.adjust | Count |
| Page: 1 |
| Pathway ID | Tissue | Disease Stage | Description | Gene Ratio | Bg Ratio | pvalue | p.adjust | qvalue | Count |
| Page: 1 |
Top |
Cell-cell communication analysis |
| Identification of potential cell-cell interactions between two cell types and their ligand-receptor pairs for different disease states |
| Ligand | Receptor | LRpair | Pathway | Tissue | Disease Stage |
| Page: 1 |
Top |
Single-cell gene regulatory network inference analysis |
| Find out the significant the regulons (TFs) and the target genes of each regulon across cell types for different disease states |
| TF | Cell Type | Tissue | Disease Stage | Target Gene | RSS | Regulon Activity |
| ∗The dot plots of a searched regulon are shown for all cell subpopulations in each disease state of each tissue based on the regulon specific score inferred using pySCENIC and by calculating the average expression. |
| Page: 1 |
Top |
Somatic mutation of malignant transformation related genes |
| Annotation of somatic variants for genes involved in malignant transformation |
| Hugo Symbol | Variant Class | Variant Classification | dbSNP RS | HGVSc | HGVSp | HGVSp Short | SWISSPROT | BIOTYPE | SIFT | PolyPhen | Tumor Sample Barcode | Tissue | Histology | Sex | Age | Stage | Therapy Types | Drugs | Outcome |
| ICAM3 | SNV | Missense_Mutation | c.749C>T | p.Ser250Leu | p.S250L | P32942 | protein_coding | tolerated(0.1) | benign(0.19) | TCGA-D8-A1Y1-01 | Breast | breast invasive carcinoma | Female | >=65 | III/IV | Hormone Therapy | tamoxiphen | PD | |
| ICAM3 | SNV | Missense_Mutation | c.162T>A | p.Ser54Arg | p.S54R | P32942 | protein_coding | deleterious(0) | probably_damaging(0.999) | TCGA-D8-A1Y1-01 | Breast | breast invasive carcinoma | Female | >=65 | III/IV | Hormone Therapy | tamoxiphen | PD | |
| ICAM3 | SNV | Missense_Mutation | novel | c.619A>C | p.Thr207Pro | p.T207P | P32942 | protein_coding | deleterious(0.04) | possibly_damaging(0.719) | TCGA-D8-A27F-01 | Breast | breast invasive carcinoma | Female | <65 | I/II | Chemotherapy | adriamycin+cyclophosphamide | SD |
| ICAM3 | SNV | Missense_Mutation | novel | c.599G>A | p.Gly200Glu | p.G200E | P32942 | protein_coding | deleterious(0) | probably_damaging(0.999) | TCGA-EA-A3HU-01 | Cervix | cervical & endocervical cancer | Female | <65 | I/II | Unknown | Unknown | SD |
| ICAM3 | SNV | Missense_Mutation | c.352N>A | p.Glu118Lys | p.E118K | P32942 | protein_coding | tolerated(0.08) | possibly_damaging(0.602) | TCGA-EK-A2PG-01 | Cervix | cervical & endocervical cancer | Female | >=65 | I/II | Unknown | Unknown | SD | |
| ICAM3 | SNV | Missense_Mutation | c.1204N>C | p.Ile402Leu | p.I402L | P32942 | protein_coding | tolerated(0.83) | benign(0.03) | TCGA-FU-A3HZ-01 | Cervix | cervical & endocervical cancer | Female | <65 | I/II | Chemotherapy | cisplatin | CR | |
| ICAM3 | SNV | Missense_Mutation | c.1363A>C | p.Thr455Pro | p.T455P | P32942 | protein_coding | tolerated(0.14) | benign(0.425) | TCGA-AA-3833-01 | Colorectum | colon adenocarcinoma | Female | <65 | I/II | Unknown | Unknown | SD | |
| ICAM3 | SNV | Missense_Mutation | c.1189N>A | p.Leu397Met | p.L397M | P32942 | protein_coding | deleterious(0) | probably_damaging(0.997) | TCGA-CK-4951-01 | Colorectum | colon adenocarcinoma | Female | >=65 | I/II | Unknown | Unknown | PD | |
| ICAM3 | SNV | Missense_Mutation | rs768855498 | c.871N>A | p.Glu291Lys | p.E291K | P32942 | protein_coding | tolerated(0.26) | benign(0.031) | TCGA-CK-4951-01 | Colorectum | colon adenocarcinoma | Female | >=65 | I/II | Unknown | Unknown | PD |
| ICAM3 | SNV | Missense_Mutation | c.844G>A | p.Ala282Thr | p.A282T | P32942 | protein_coding | tolerated(0.05) | possibly_damaging(0.579) | TCGA-G4-6588-01 | Colorectum | colon adenocarcinoma | Female | <65 | I/II | Unknown | Unknown | SD |
| Page: 1 2 3 4 5 |
Top |
Related drugs of malignant transformation related genes |
| Identification of chemicals and drugs interact with genes involved in malignant transfromation |
| (DGIdb 4.0) |
| Entrez ID | Symbol | Category | Interaction Types | Drug Claim Name | Drug Name | PMIDs |
| 3385 | ICAM3 | DRUGGABLE GENOME | CSA | CYCLOSPORINE | 15732868 | |
| 3385 | ICAM3 | DRUGGABLE GENOME | INTERFERONS | 14989786 | ||
| 3385 | ICAM3 | DRUGGABLE GENOME | VITAMIN D | 10891379 | ||
| 3385 | ICAM3 | DRUGGABLE GENOME | inhibitor | CHEMBL2109481 | ICM3 | |
| 3385 | ICAM3 | DRUGGABLE GENOME | GRANULOCYTE MACROPHAGE COLONY-STIMULATING FACTOR | 12600815 | ||
| 3385 | ICAM3 | DRUGGABLE GENOME | PMA | 7525295 | ||
| 3385 | ICAM3 | DRUGGABLE GENOME | GM-CSF | REGRAMOSTIM | 12600815 | |
| 3385 | ICAM3 | DRUGGABLE GENOME | METHOTREXATE | METHOTREXATE | 16215763 |
| Page: 1 |

Copyright 2023-Present -The University of Texas Health Science Center at Houston |