
|
|||||
|
 | |
| |
| |
| |
| |
| |
|
Gene: ICAM1 |
Gene summary for ICAM1 |
| Gene information | Species | Human | Gene symbol | ICAM1 | Gene ID | 3383 |
| Gene name | intercellular adhesion molecule 1 | |
| Gene Alias | BB2 | |
| Cytomap | 19p13.2 | |
| Gene Type | protein-coding | GO ID | GO:0000003 | UniProtAcc | P05362 |
Top |
Malignant transformation analysis |
| Identification of the aberrant gene expression in precancerous and cancerous lesions by comparing the gene expression of stem-like cells in diseased tissues with normal stem cells |
| Entrez ID | Symbol | Replicates | Species | Organ | Tissue | Adj P-value | Log2FC | Malignancy |
| 3383 | ICAM1 | AEH-subject1 | Human | Endometrium | AEH | 2.49e-02 | 2.92e-01 | -0.3059 |
| 3383 | ICAM1 | GSM5276934 | Human | Endometrium | EEC | 8.90e-29 | 7.93e-01 | -0.0913 |
| 3383 | ICAM1 | GSM5276937 | Human | Endometrium | EEC | 5.41e-16 | 6.37e-01 | -0.0897 |
| 3383 | ICAM1 | LZE4T | Human | Esophagus | ESCC | 1.80e-09 | 1.25e-01 | 0.0811 |
| 3383 | ICAM1 | P2T-E | Human | Esophagus | ESCC | 1.50e-02 | 5.82e-01 | 0.1177 |
| 3383 | ICAM1 | P5T-E | Human | Esophagus | ESCC | 7.13e-04 | 4.26e-01 | 0.1327 |
| 3383 | ICAM1 | P8T-E | Human | Esophagus | ESCC | 1.36e-41 | 1.96e+00 | 0.0889 |
| 3383 | ICAM1 | P9T-E | Human | Esophagus | ESCC | 4.22e-03 | 9.26e-01 | 0.1131 |
| 3383 | ICAM1 | P11T-E | Human | Esophagus | ESCC | 4.30e-08 | 2.03e+00 | 0.1426 |
| 3383 | ICAM1 | P21T-E | Human | Esophagus | ESCC | 6.22e-18 | 9.21e-01 | 0.1617 |
| 3383 | ICAM1 | P23T-E | Human | Esophagus | ESCC | 1.25e-12 | 1.59e+00 | 0.108 |
| 3383 | ICAM1 | P24T-E | Human | Esophagus | ESCC | 5.06e-16 | 8.30e-01 | 0.1287 |
| 3383 | ICAM1 | P26T-E | Human | Esophagus | ESCC | 3.49e-03 | 1.11e-01 | 0.1276 |
| 3383 | ICAM1 | P31T-E | Human | Esophagus | ESCC | 9.52e-05 | 4.19e-01 | 0.1251 |
| 3383 | ICAM1 | P36T-E | Human | Esophagus | ESCC | 1.80e-20 | 2.01e+00 | 0.1187 |
| 3383 | ICAM1 | P37T-E | Human | Esophagus | ESCC | 6.15e-37 | 1.70e+00 | 0.1371 |
| 3383 | ICAM1 | P40T-E | Human | Esophagus | ESCC | 1.88e-03 | 7.21e-01 | 0.109 |
| 3383 | ICAM1 | P42T-E | Human | Esophagus | ESCC | 7.44e-05 | 1.13e+00 | 0.1175 |
| 3383 | ICAM1 | P47T-E | Human | Esophagus | ESCC | 6.67e-04 | 6.01e-01 | 0.1067 |
| 3383 | ICAM1 | P48T-E | Human | Esophagus | ESCC | 1.35e-02 | 7.14e-01 | 0.0959 |
| Page: 1 2 3 4 5 6 7 |
| Tissue | Expression Dynamics | Abbreviation |
| Endometrium |  | AEH: Atypical endometrial hyperplasia |
| EEC: Endometrioid Cancer | ||
| Esophagus | 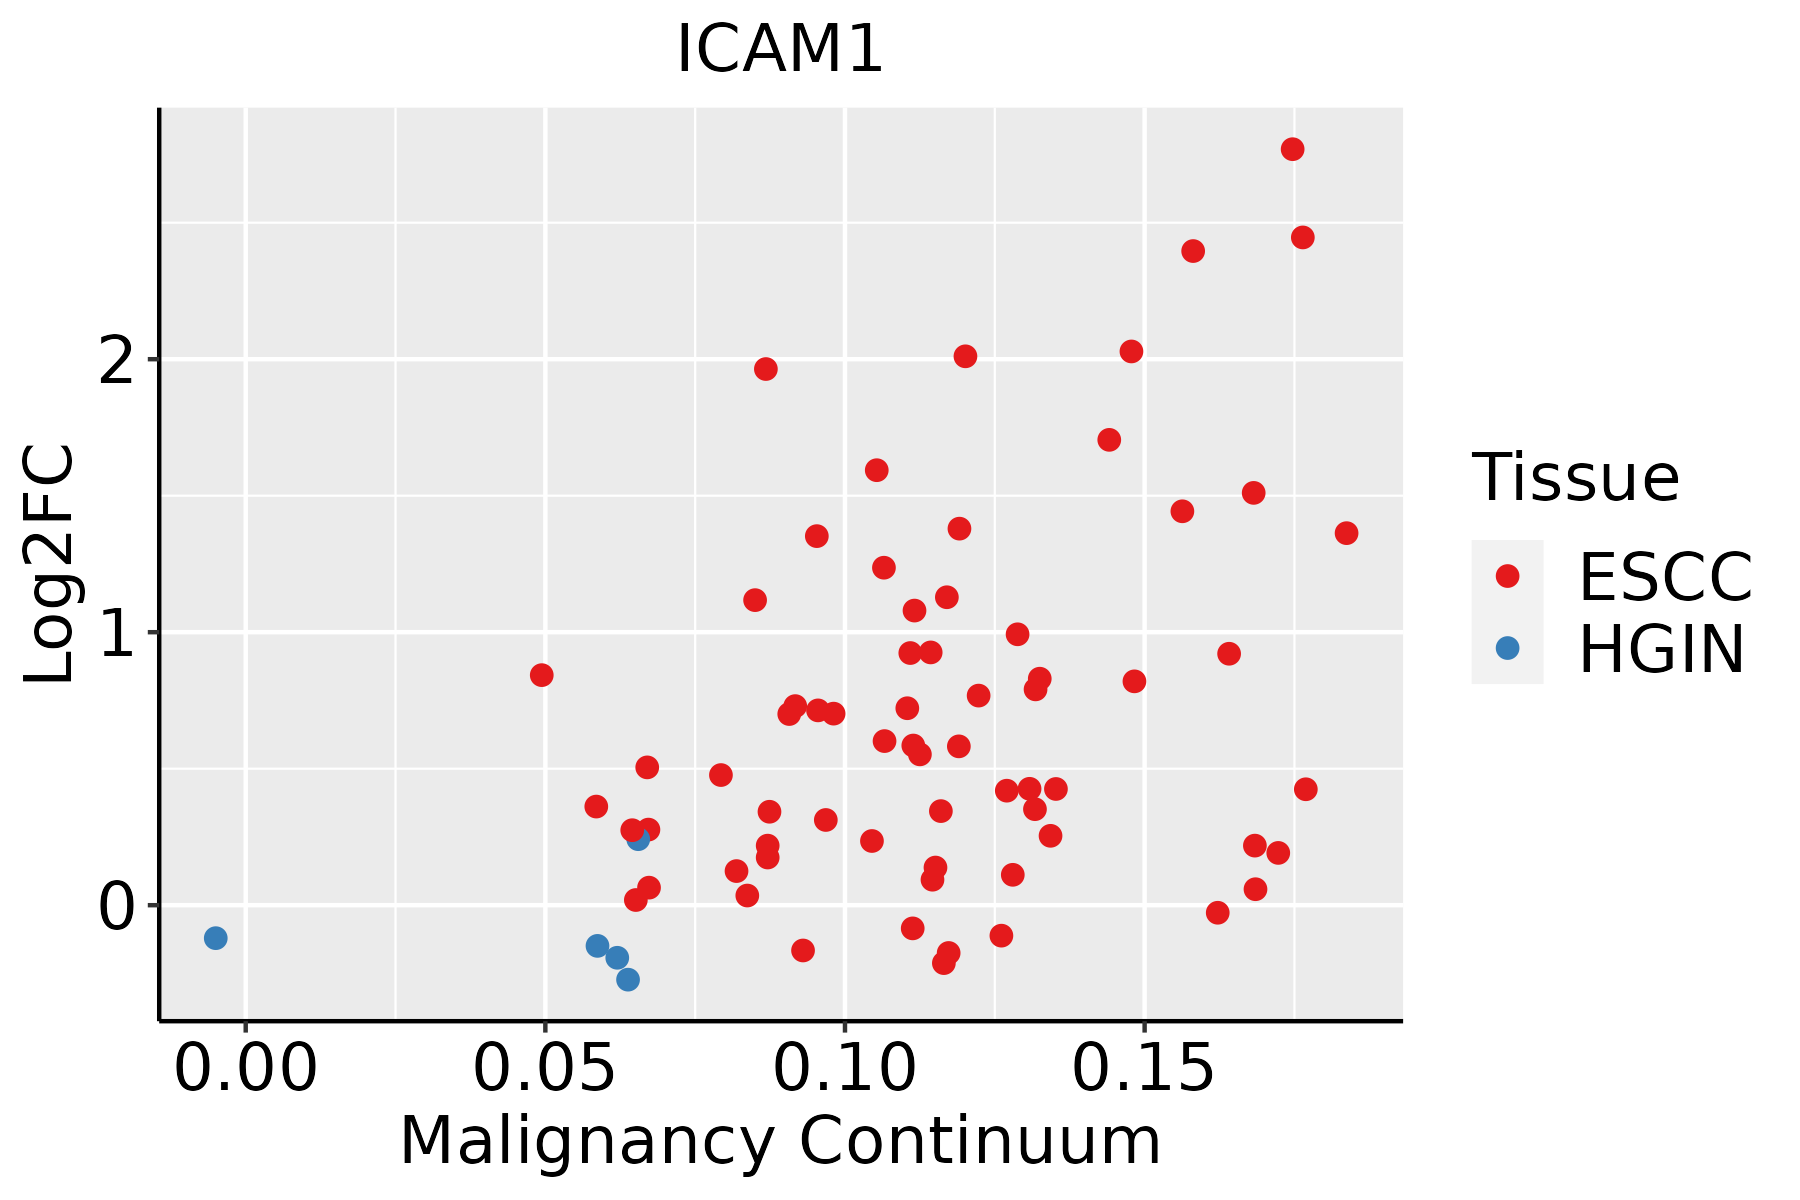 | ESCC: Esophageal squamous cell carcinoma |
| HGIN: High-grade intraepithelial neoplasias | ||
| LGIN: Low-grade intraepithelial neoplasias | ||
| GC | 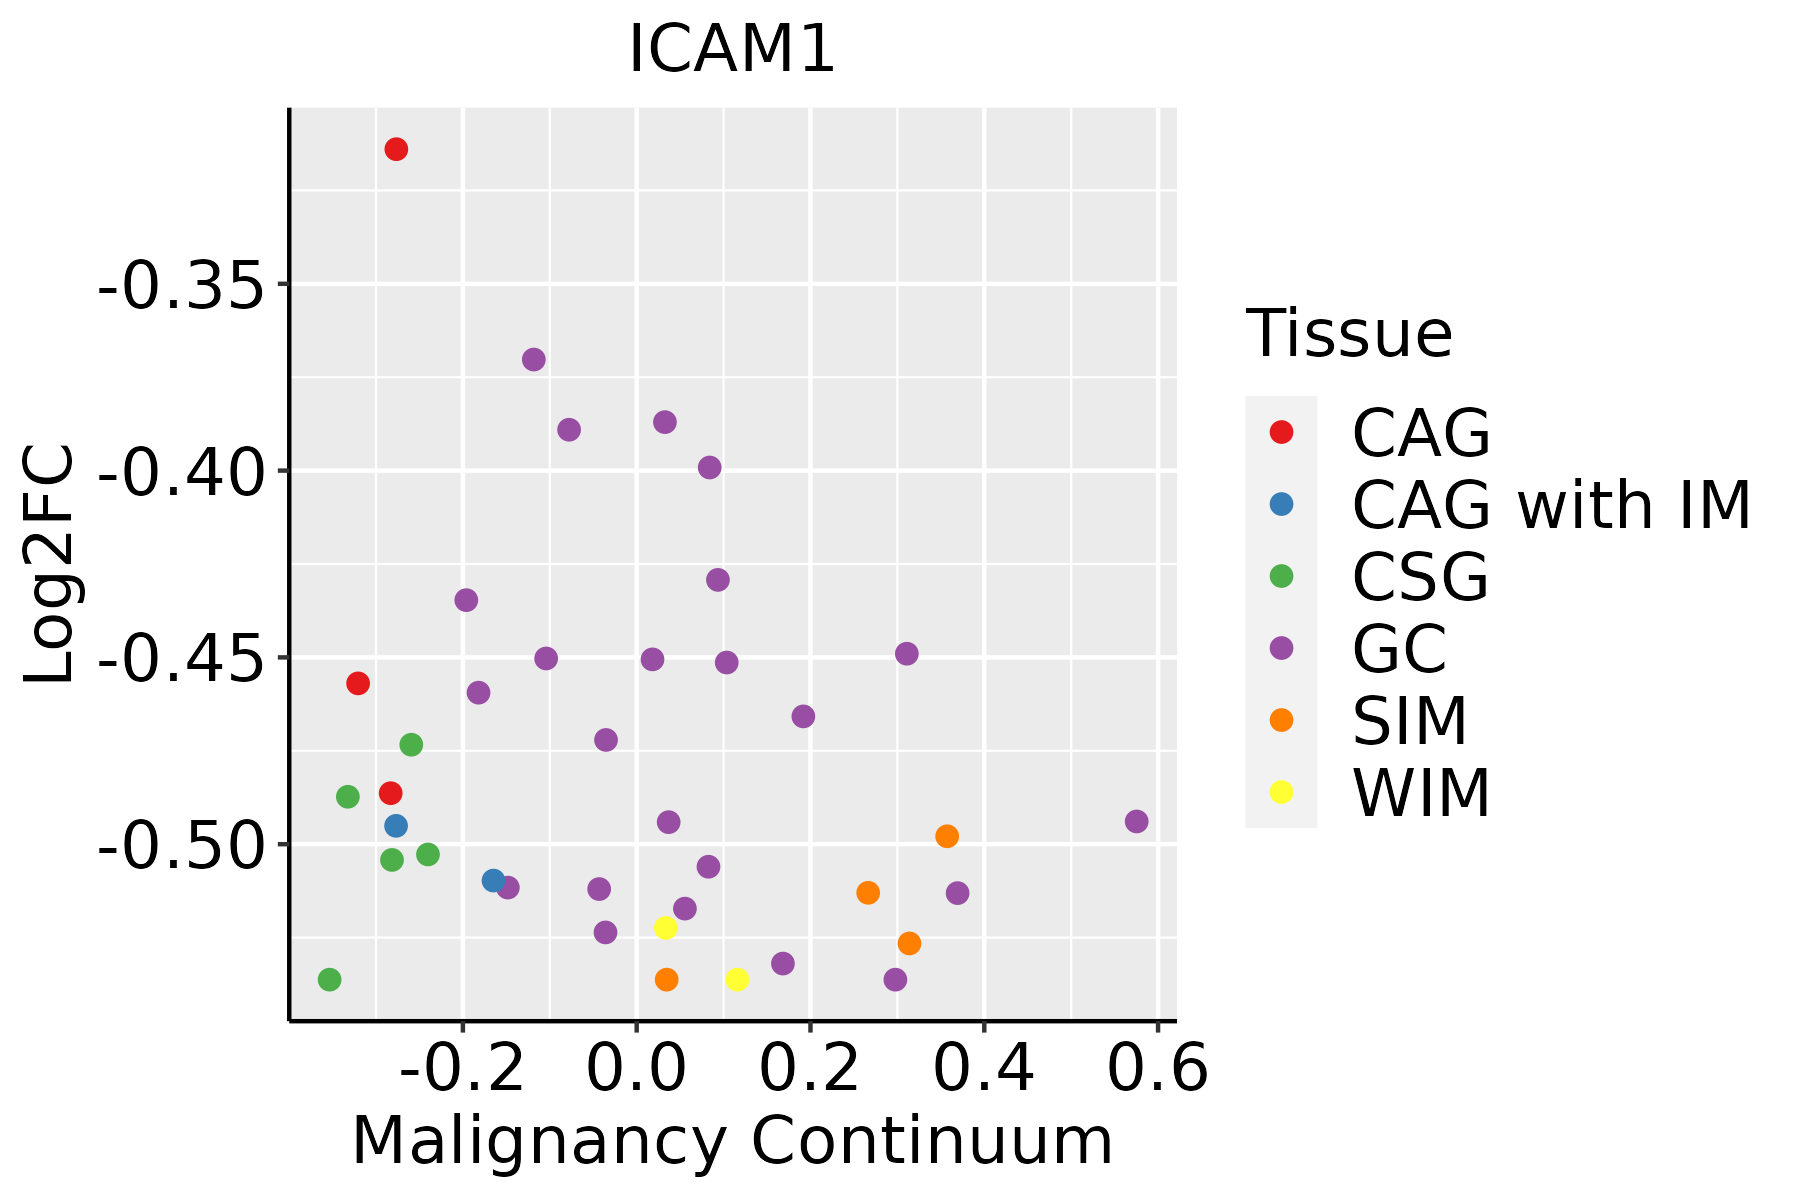 | CAG: Chronic atrophic gastritis |
| CAG with IM: Chronic atrophic gastritis with intestinal metaplasia | ||
| CSG: Chronic superficial gastritis | ||
| GC: Gastric cancer | ||
| SIM: Severe intestinal metaplasia | ||
| WIM: Wild intestinal metaplasia | ||
| Liver |  | HCC: Hepatocellular carcinoma |
| NAFLD: Non-alcoholic fatty liver disease | ||
| Lung | 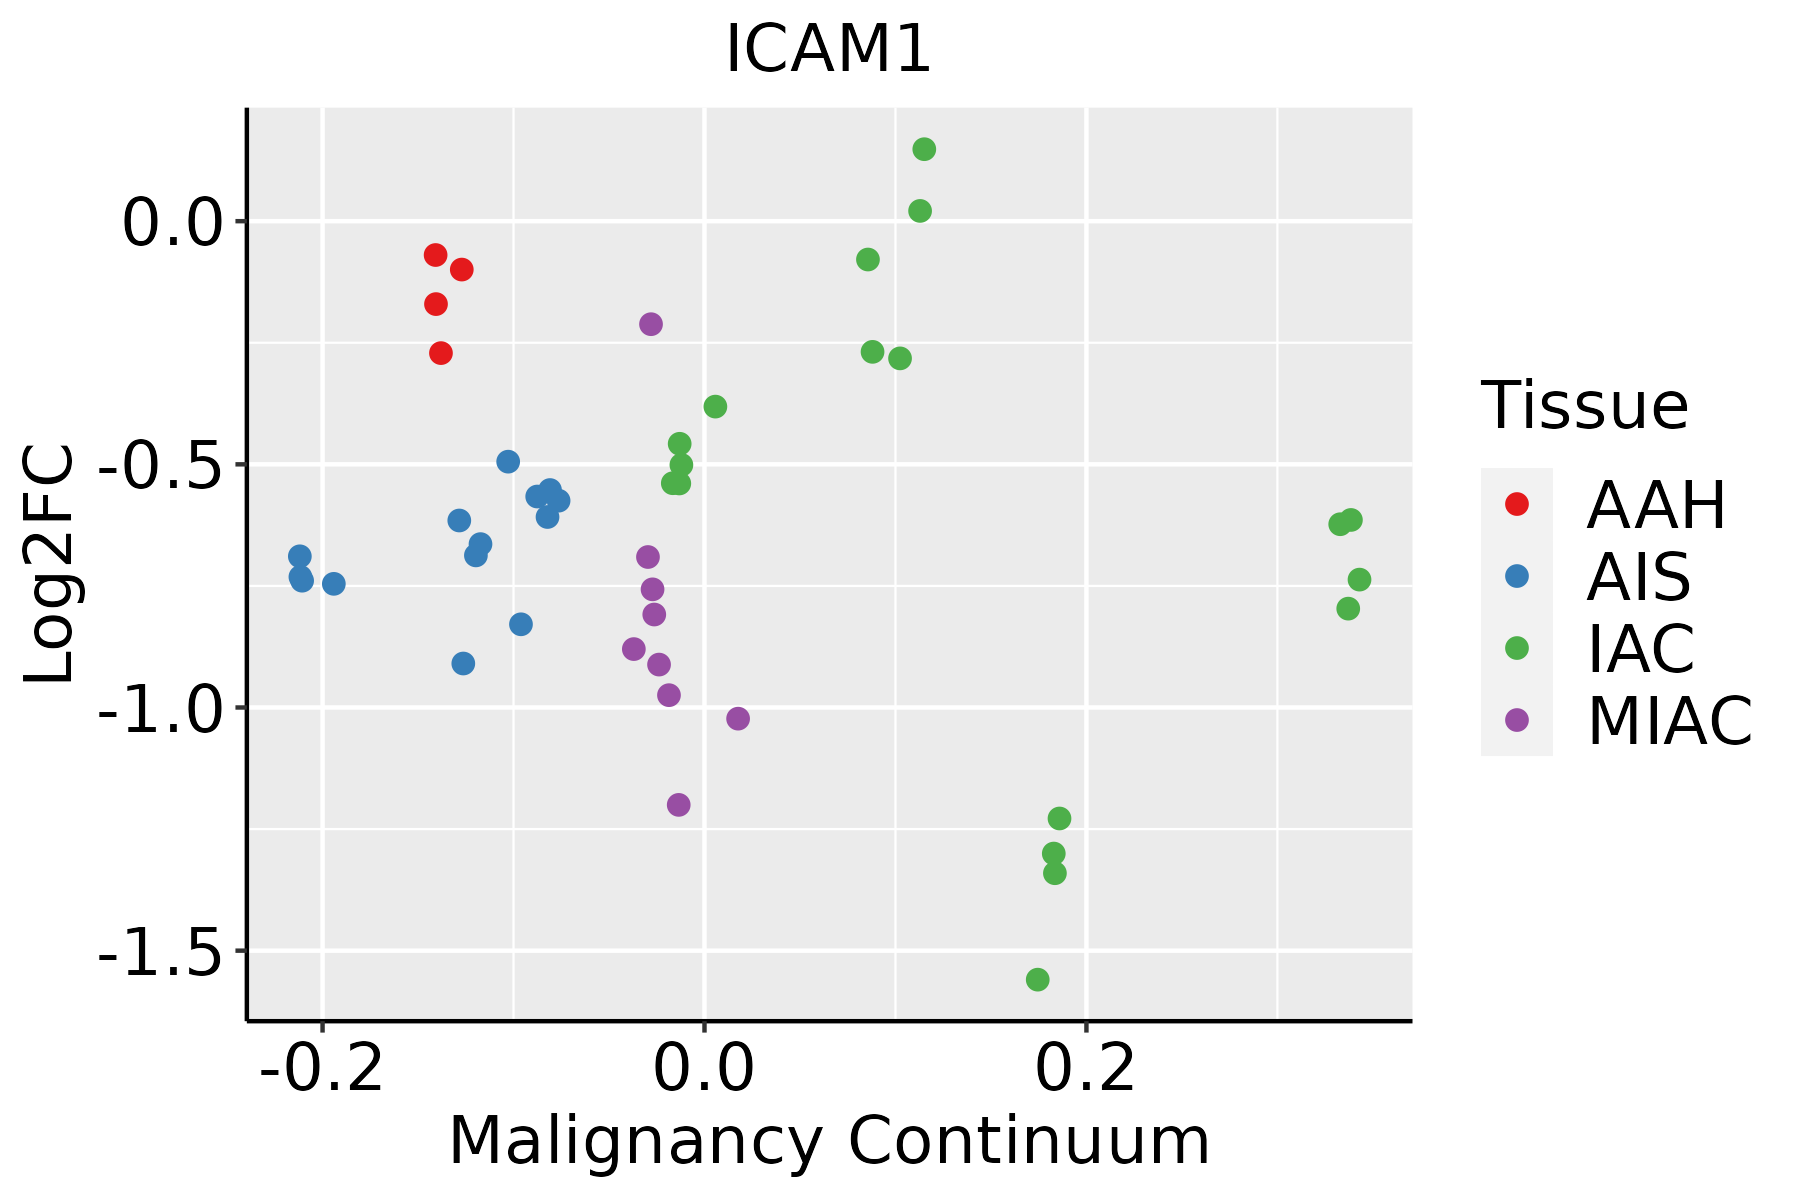 | AAH: Atypical adenomatous hyperplasia |
| AIS: Adenocarcinoma in situ | ||
| IAC: Invasive lung adenocarcinoma | ||
| MIA: Minimally invasive adenocarcinoma | ||
| Oral Cavity | 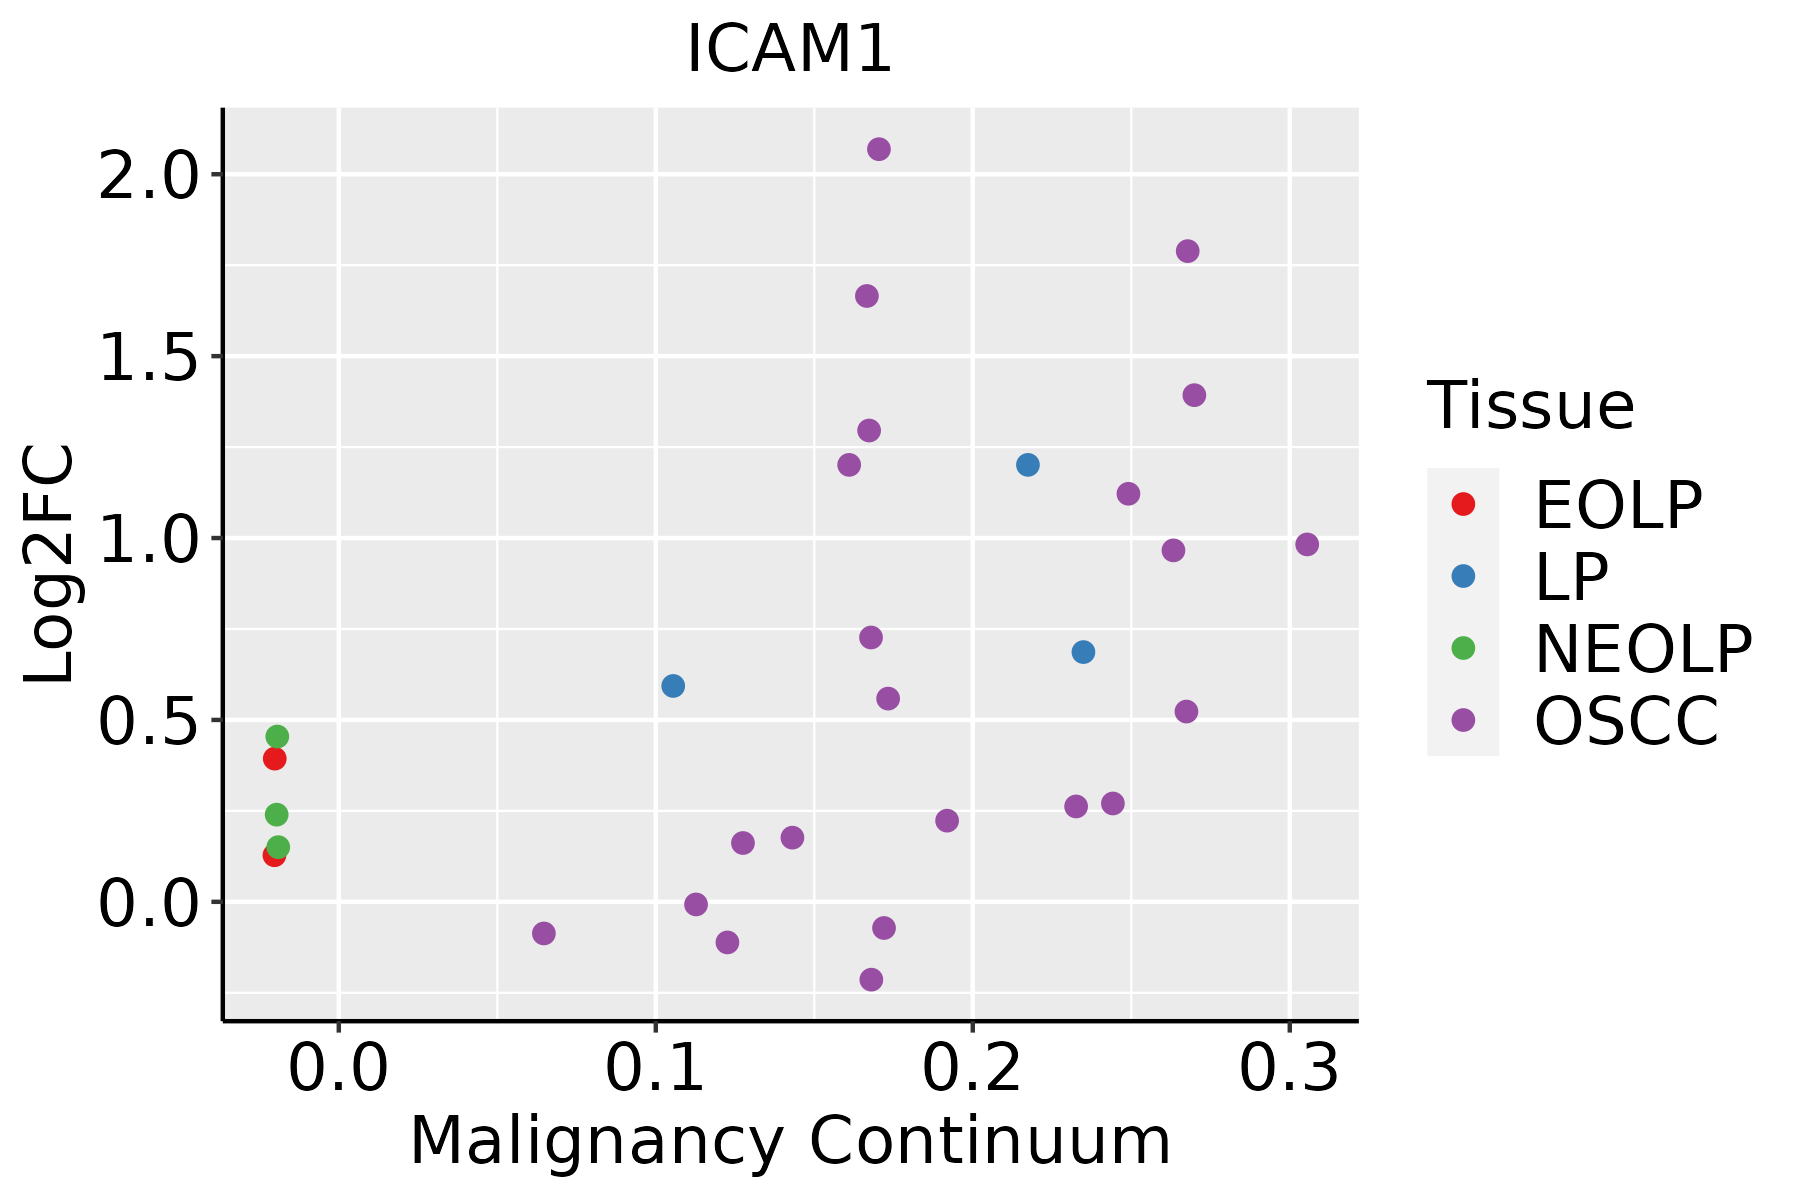 | EOLP: Erosive Oral lichen planus |
| LP: leukoplakia | ||
| NEOLP: Non-erosive oral lichen planus | ||
| OSCC: Oral squamous cell carcinoma | ||
| Prostate |  | BPH: Benign Prostatic Hyperplasia |
| Thyroid |  | ATC: Anaplastic thyroid cancer |
| HT: Hashimoto's thyroiditis | ||
| PTC: Papillary thyroid cancer |
| ∗log2FC in expression of this searched gene in stem-like cells from each diseased tissue sample relative to stem-like cells in normal samples in each tissue plotted against the malignancy continuum. Samples are colored based on if they are from different disease stage. |
Top |
Malignant transformation related pathway analysis |
| Find out the enriched GO biological processes and KEGG pathways involved in transition from healthy to precancer to cancer |
| Tissue | Disease Stage | Enriched GO biological Processes |
| Colorectum | AD |  |
| Colorectum | SER |  |
| Colorectum | MSS |  |
| Colorectum | MSI-H |  |
| Colorectum | FAP |  |
| ∗Top 15 enriched GO BP terms are showed in the bar plot of each disease state in each tissue. Each row represents a significant GO biological process which is colored according to the -log10(p.adjust). |
| Page: 1 2 3 4 5 6 7 8 9 |
| GO ID | Tissue | Disease Stage | Description | Gene Ratio | Bg Ratio | pvalue | p.adjust | Count |
| GO:0009896 | Colorectum | AD | positive regulation of catabolic process | 180/3918 | 492/18723 | 4.33e-16 | 1.94e-13 | 180 |
| GO:0031331 | Colorectum | AD | positive regulation of cellular catabolic process | 156/3918 | 427/18723 | 4.68e-14 | 1.05e-11 | 156 |
| GO:0043254 | Colorectum | AD | regulation of protein-containing complex assembly | 148/3918 | 428/18723 | 2.64e-11 | 3.18e-09 | 148 |
| GO:0051098 | Colorectum | AD | regulation of binding | 126/3918 | 363/18723 | 6.01e-10 | 4.88e-08 | 126 |
| GO:0010506 | Colorectum | AD | regulation of autophagy | 111/3918 | 317/18723 | 3.57e-09 | 2.35e-07 | 111 |
| GO:1903320 | Colorectum | AD | regulation of protein modification by small protein conjugation or removal | 86/3918 | 242/18723 | 9.43e-08 | 4.65e-06 | 86 |
| GO:0051099 | Colorectum | AD | positive regulation of binding | 66/3918 | 173/18723 | 1.47e-07 | 6.64e-06 | 66 |
| GO:0031396 | Colorectum | AD | regulation of protein ubiquitination | 72/3918 | 210/18723 | 4.50e-06 | 1.21e-04 | 72 |
| GO:0043393 | Colorectum | AD | regulation of protein binding | 68/3918 | 196/18723 | 5.17e-06 | 1.34e-04 | 68 |
| GO:0032092 | Colorectum | AD | positive regulation of protein binding | 33/3918 | 85/18723 | 1.22e-04 | 1.78e-03 | 33 |
| GO:0006809 | Colorectum | AD | nitric oxide biosynthetic process | 30/3918 | 76/18723 | 1.72e-04 | 2.33e-03 | 30 |
| GO:0043123 | Colorectum | AD | positive regulation of I-kappaB kinase/NF-kappaB signaling | 60/3918 | 186/18723 | 1.91e-04 | 2.56e-03 | 60 |
| GO:0043122 | Colorectum | AD | regulation of I-kappaB kinase/NF-kappaB signaling | 76/3918 | 249/18723 | 2.17e-04 | 2.85e-03 | 76 |
| GO:0046209 | Colorectum | AD | nitric oxide metabolic process | 31/3918 | 81/18723 | 2.61e-04 | 3.25e-03 | 31 |
| GO:0010508 | Colorectum | AD | positive regulation of autophagy | 43/3918 | 124/18723 | 2.64e-04 | 3.27e-03 | 43 |
| GO:2001057 | Colorectum | AD | reactive nitrogen species metabolic process | 31/3918 | 82/18723 | 3.37e-04 | 3.94e-03 | 31 |
| GO:0007249 | Colorectum | AD | I-kappaB kinase/NF-kappaB signaling | 82/3918 | 281/18723 | 6.09e-04 | 6.40e-03 | 82 |
| GO:0032481 | Colorectum | AD | positive regulation of type I interferon production | 23/3918 | 58/18723 | 8.82e-04 | 8.53e-03 | 23 |
| GO:0045429 | Colorectum | AD | positive regulation of nitric oxide biosynthetic process | 17/3918 | 40/18723 | 1.66e-03 | 1.38e-02 | 17 |
| GO:1904407 | Colorectum | AD | positive regulation of nitric oxide metabolic process | 17/3918 | 41/18723 | 2.29e-03 | 1.79e-02 | 17 |
| Page: 1 2 3 4 5 6 7 8 9 10 11 12 13 14 15 16 17 18 19 20 21 22 23 24 25 26 27 28 29 30 31 32 33 34 35 36 37 38 39 40 41 42 43 44 45 46 47 48 49 50 51 52 53 54 55 56 57 58 59 60 61 62 63 64 65 66 67 68 69 70 71 72 73 74 75 76 77 78 79 80 81 82 83 84 85 86 87 88 89 90 91 92 93 94 95 96 97 98 99 100 101 102 103 104 105 106 107 108 109 110 111 112 113 114 115 116 117 118 119 120 121 122 123 124 125 126 |
| Pathway ID | Tissue | Disease Stage | Description | Gene Ratio | Bg Ratio | pvalue | p.adjust | qvalue | Count |
| hsa0541625 | Endometrium | AEH | Viral myocarditis | 27/1197 | 60/8465 | 6.98e-09 | 1.13e-07 | 8.30e-08 | 27 |
| hsa0541826 | Endometrium | AEH | Fluid shear stress and atherosclerosis | 43/1197 | 139/8465 | 2.47e-07 | 3.49e-06 | 2.55e-06 | 43 |
| hsa0467026 | Endometrium | AEH | Leukocyte transendothelial migration | 37/1197 | 114/8465 | 4.51e-07 | 6.11e-06 | 4.47e-06 | 37 |
| hsa049337 | Endometrium | AEH | AGE-RAGE signaling pathway in diabetic complications | 28/1197 | 100/8465 | 2.11e-04 | 1.80e-03 | 1.32e-03 | 28 |
| hsa0516626 | Endometrium | AEH | Human T-cell leukemia virus 1 infection | 50/1197 | 222/8465 | 4.30e-04 | 3.11e-03 | 2.27e-03 | 50 |
| hsa0516725 | Endometrium | AEH | Kaposi sarcoma-associated herpesvirus infection | 44/1197 | 194/8465 | 7.97e-04 | 5.28e-03 | 3.87e-03 | 44 |
| hsa0541726 | Endometrium | AEH | Lipid and atherosclerosis | 47/1197 | 215/8465 | 1.24e-03 | 7.62e-03 | 5.58e-03 | 47 |
| hsa0532316 | Endometrium | AEH | Rheumatoid arthritis | 23/1197 | 93/8465 | 4.43e-03 | 2.46e-02 | 1.80e-02 | 23 |
| hsa0516924 | Endometrium | AEH | Epstein-Barr virus infection | 42/1197 | 202/8465 | 5.72e-03 | 3.05e-02 | 2.23e-02 | 42 |
| hsa05416111 | Endometrium | AEH | Viral myocarditis | 27/1197 | 60/8465 | 6.98e-09 | 1.13e-07 | 8.30e-08 | 27 |
| hsa05418112 | Endometrium | AEH | Fluid shear stress and atherosclerosis | 43/1197 | 139/8465 | 2.47e-07 | 3.49e-06 | 2.55e-06 | 43 |
| hsa04670111 | Endometrium | AEH | Leukocyte transendothelial migration | 37/1197 | 114/8465 | 4.51e-07 | 6.11e-06 | 4.47e-06 | 37 |
| hsa0493314 | Endometrium | AEH | AGE-RAGE signaling pathway in diabetic complications | 28/1197 | 100/8465 | 2.11e-04 | 1.80e-03 | 1.32e-03 | 28 |
| hsa05166111 | Endometrium | AEH | Human T-cell leukemia virus 1 infection | 50/1197 | 222/8465 | 4.30e-04 | 3.11e-03 | 2.27e-03 | 50 |
| hsa05167111 | Endometrium | AEH | Kaposi sarcoma-associated herpesvirus infection | 44/1197 | 194/8465 | 7.97e-04 | 5.28e-03 | 3.87e-03 | 44 |
| hsa05417111 | Endometrium | AEH | Lipid and atherosclerosis | 47/1197 | 215/8465 | 1.24e-03 | 7.62e-03 | 5.58e-03 | 47 |
| hsa0532317 | Endometrium | AEH | Rheumatoid arthritis | 23/1197 | 93/8465 | 4.43e-03 | 2.46e-02 | 1.80e-02 | 23 |
| hsa05169111 | Endometrium | AEH | Epstein-Barr virus infection | 42/1197 | 202/8465 | 5.72e-03 | 3.05e-02 | 2.23e-02 | 42 |
| hsa0541626 | Endometrium | EEC | Viral myocarditis | 28/1237 | 60/8465 | 2.81e-09 | 5.77e-08 | 4.30e-08 | 28 |
| hsa0516627 | Endometrium | EEC | Human T-cell leukemia virus 1 infection | 52/1237 | 222/8465 | 2.73e-04 | 2.36e-03 | 1.76e-03 | 52 |
| Page: 1 2 3 4 5 6 7 8 9 10 11 12 13 14 15 16 17 18 19 |
Top |
Cell-cell communication analysis |
| Identification of potential cell-cell interactions between two cell types and their ligand-receptor pairs for different disease states |
| Ligand | Receptor | LRpair | Pathway | Tissue | Disease Stage |
| ICAM1 | ITGAL_ITGB2 | ICAM1_ITGAL_ITGB2 | ICAM | Breast | ADJ |
| ICAM1 | ITGAL | ICAM1_ITGAL | ICAM | Breast | ADJ |
| ICAM1 | SPN | ICAM1_SPN | ICAM | Breast | ADJ |
| ITGB2 | ICAM1 | ITGB2_ICAM1 | ITGB2 | Breast | ADJ |
| ITGB2 | ICAM1 | ITGB2_ICAM1 | ITGB2 | Breast | DCIS |
| ICAM1 | ITGAX_ITGB2 | ICAM1_ITGAX_ITGB2 | ICAM | Breast | DCIS |
| ICAM1 | ITGAL_ITGB2 | ICAM1_ITGAL_ITGB2 | ICAM | Breast | DCIS |
| ICAM1 | ITGAM_ITGB2 | ICAM1_ITGAM_ITGB2 | ICAM | Breast | DCIS |
| ICAM1 | ITGAL | ICAM1_ITGAL | ICAM | Breast | DCIS |
| ICAM1 | SPN | ICAM1_SPN | ICAM | Breast | DCIS |
| ITGB2 | ICAM1 | ITGB2_ICAM1 | ITGB2 | Breast | Healthy |
| ICAM1 | ITGAX_ITGB2 | ICAM1_ITGAX_ITGB2 | ICAM | Breast | Healthy |
| ICAM1 | ITGAL_ITGB2 | ICAM1_ITGAL_ITGB2 | ICAM | Breast | Healthy |
| ICAM1 | ITGAM_ITGB2 | ICAM1_ITGAM_ITGB2 | ICAM | Breast | Healthy |
| ICAM1 | ITGAL | ICAM1_ITGAL | ICAM | Breast | Healthy |
| ICAM1 | SPN | ICAM1_SPN | ICAM | Breast | Healthy |
| ITGB2 | ICAM1 | ITGB2_ICAM1 | ITGB2 | Breast | IDC |
| ICAM1 | ITGAX_ITGB2 | ICAM1_ITGAX_ITGB2 | ICAM | Breast | IDC |
| ICAM1 | ITGAL_ITGB2 | ICAM1_ITGAL_ITGB2 | ICAM | Breast | IDC |
| ICAM1 | ITGAM_ITGB2 | ICAM1_ITGAM_ITGB2 | ICAM | Breast | IDC |
| Page: 1 2 3 4 5 6 7 8 |
Top |
Single-cell gene regulatory network inference analysis |
| Find out the significant the regulons (TFs) and the target genes of each regulon across cell types for different disease states |
| TF | Cell Type | Tissue | Disease Stage | Target Gene | RSS | Regulon Activity |
| ∗The dot plots of a searched regulon are shown for all cell subpopulations in each disease state of each tissue based on the regulon specific score inferred using pySCENIC and by calculating the average expression. |
| Page: 1 |
Top |
Somatic mutation of malignant transformation related genes |
| Annotation of somatic variants for genes involved in malignant transformation |
| Hugo Symbol | Variant Class | Variant Classification | dbSNP RS | HGVSc | HGVSp | HGVSp Short | SWISSPROT | BIOTYPE | SIFT | PolyPhen | Tumor Sample Barcode | Tissue | Histology | Sex | Age | Stage | Therapy Types | Drugs | Outcome |
| ICAM1 | SNV | Missense_Mutation | novel | c.652C>T | p.Pro218Ser | p.P218S | P05362 | protein_coding | tolerated(0.78) | benign(0.193) | TCGA-A2-A0CR-01 | Breast | breast invasive carcinoma | Female | <65 | I/II | Chemotherapy | adriamycin | CR |
| ICAM1 | SNV | Missense_Mutation | rs375023616 | c.692N>T | p.Thr231Met | p.T231M | P05362 | protein_coding | deleterious(0.02) | possibly_damaging(0.782) | TCGA-A8-A09Z-01 | Breast | breast invasive carcinoma | Female | >=65 | I/II | Unknown | Unknown | SD |
| ICAM1 | SNV | Missense_Mutation | rs746554151 | c.611N>T | p.Ser204Leu | p.S204L | P05362 | protein_coding | deleterious(0) | probably_damaging(1) | TCGA-AN-A046-01 | Breast | breast invasive carcinoma | Female | >=65 | I/II | Unknown | Unknown | SD |
| ICAM1 | SNV | Missense_Mutation | novel | c.1087G>A | p.Glu363Lys | p.E363K | P05362 | protein_coding | tolerated(0.16) | benign(0.358) | TCGA-AN-A0FS-01 | Breast | breast invasive carcinoma | Female | <65 | I/II | Unknown | Unknown | SD |
| ICAM1 | SNV | Missense_Mutation | c.601N>C | p.Glu201Gln | p.E201Q | P05362 | protein_coding | tolerated(1) | benign(0) | TCGA-EW-A1J5-01 | Breast | breast invasive carcinoma | Female | <65 | I/II | Chemotherapy | adriamycin | SD | |
| ICAM1 | deletion | Frame_Shift_Del | novel | c.457delN | p.Glu154ArgfsTer4 | p.E154Rfs*4 | P05362 | protein_coding | TCGA-EW-A2FV-01 | Breast | breast invasive carcinoma | Female | <65 | III/IV | Chemotherapy | docetaxel | SD | ||
| ICAM1 | SNV | Missense_Mutation | rs775418785 | c.1468N>A | p.Ala490Thr | p.A490T | P05362 | protein_coding | tolerated(0.16) | benign(0.003) | TCGA-2W-A8YY-01 | Cervix | cervical & endocervical cancer | Female | <65 | I/II | Chemotherapy | cisplatin | CR |
| ICAM1 | SNV | Missense_Mutation | rs200230807 | c.1403N>A | p.Arg468His | p.R468H | P05362 | protein_coding | tolerated(0.18) | probably_damaging(0.978) | TCGA-ZJ-AAX8-01 | Cervix | cervical & endocervical cancer | Female | <65 | III/IV | Unknown | Unknown | SD |
| ICAM1 | SNV | Missense_Mutation | rs775418785 | c.1468N>A | p.Ala490Thr | p.A490T | P05362 | protein_coding | tolerated(0.16) | benign(0.003) | TCGA-AA-3502-01 | Colorectum | colon adenocarcinoma | Male | >=65 | I/II | Unknown | Unknown | SD |
| ICAM1 | SNV | Missense_Mutation | rs780437504 | c.1433G>A | p.Arg478Gln | p.R478Q | P05362 | protein_coding | tolerated(1) | benign(0.001) | TCGA-AA-3864-01 | Colorectum | colon adenocarcinoma | Male | >=65 | I/II | Unknown | Unknown | SD |
| Page: 1 2 3 4 |
Top |
Related drugs of malignant transformation related genes |
| Identification of chemicals and drugs interact with genes involved in malignant transfromation |
| (DGIdb 4.0) |
| Entrez ID | Symbol | Category | Interaction Types | Drug Claim Name | Drug Name | PMIDs |
| 3383 | ICAM1 | EXTERNAL SIDE OF PLASMA MEMBRANE, CELL SURFACE, DRUGGABLE GENOME | BI-505 | BI-505 | ||
| 3383 | ICAM1 | EXTERNAL SIDE OF PLASMA MEMBRANE, CELL SURFACE, DRUGGABLE GENOME | COXSACKIEVIRUS TYPE A21 | |||
| 3383 | ICAM1 | EXTERNAL SIDE OF PLASMA MEMBRANE, CELL SURFACE, DRUGGABLE GENOME | BI-505 | BI-505 | ||
| 3383 | ICAM1 | EXTERNAL SIDE OF PLASMA MEMBRANE, CELL SURFACE, DRUGGABLE GENOME | Alicaforsen | ALICAFORSEN | ||
| 3383 | ICAM1 | EXTERNAL SIDE OF PLASMA MEMBRANE, CELL SURFACE, DRUGGABLE GENOME | antagonist | CHEMBL2108401 | ENLIMOMAB PEGOL | |
| 3383 | ICAM1 | EXTERNAL SIDE OF PLASMA MEMBRANE, CELL SURFACE, DRUGGABLE GENOME | lifitegrast | LIFITEGRAST | ||
| 3383 | ICAM1 | EXTERNAL SIDE OF PLASMA MEMBRANE, CELL SURFACE, DRUGGABLE GENOME | antagonist | CHEMBL2109482 | BI-505 | |
| 3383 | ICAM1 | EXTERNAL SIDE OF PLASMA MEMBRANE, CELL SURFACE, DRUGGABLE GENOME | ALICAFORSEN | ALICAFORSEN | ||
| 3383 | ICAM1 | EXTERNAL SIDE OF PLASMA MEMBRANE, CELL SURFACE, DRUGGABLE GENOME | SAR 1118 | |||
| 3383 | ICAM1 | EXTERNAL SIDE OF PLASMA MEMBRANE, CELL SURFACE, DRUGGABLE GENOME | HYALURONAN | HYALURONAN |
| Page: 1 2 |

Copyright 2023-Present -The University of Texas Health Science Center at Houston |