
|
|||||
|
 | |
| |
| |
| |
| |
| |
|
Gene: ICA1L |
Gene summary for ICA1L |
| Gene information | Species | Human | Gene symbol | ICA1L | Gene ID | 130026 |
| Gene name | islet cell autoantigen 1 like | |
| Gene Alias | ALS2CR14 | |
| Cytomap | 2q33.2 | |
| Gene Type | protein-coding | GO ID | GO:0006810 | UniProtAcc | A0A024R3W3 |
Top |
Malignant transformation analysis |
| Identification of the aberrant gene expression in precancerous and cancerous lesions by comparing the gene expression of stem-like cells in diseased tissues with normal stem cells |
| Entrez ID | Symbol | Replicates | Species | Organ | Tissue | Adj P-value | Log2FC | Malignancy |
| 130026 | ICA1L | HTA11_78_2000001011 | Human | Colorectum | AD | 7.08e-04 | 2.28e-01 | -0.1088 |
| 130026 | ICA1L | HTA11_347_2000001011 | Human | Colorectum | AD | 2.94e-18 | 5.55e-01 | -0.1954 |
| 130026 | ICA1L | HTA11_696_2000001011 | Human | Colorectum | AD | 5.97e-05 | 3.01e-01 | -0.1464 |
| 130026 | ICA1L | HTA11_866_2000001011 | Human | Colorectum | AD | 4.28e-02 | 2.09e-01 | -0.1001 |
| 130026 | ICA1L | HTA11_1391_2000001011 | Human | Colorectum | AD | 2.68e-06 | 2.89e-01 | -0.059 |
| 130026 | ICA1L | HTA11_7663_2000001011 | Human | Colorectum | SER | 2.05e-15 | 1.21e+00 | 0.0131 |
| 130026 | ICA1L | HTA11_10711_2000001011 | Human | Colorectum | AD | 3.11e-21 | 6.43e-01 | 0.0338 |
| 130026 | ICA1L | HTA11_6818_2000001011 | Human | Colorectum | AD | 5.73e-32 | 1.10e+00 | 0.0112 |
| 130026 | ICA1L | HTA11_11156_2000001011 | Human | Colorectum | AD | 6.62e-05 | 8.20e-01 | 0.0397 |
| 130026 | ICA1L | HTA11_6818_2000001021 | Human | Colorectum | AD | 1.09e-19 | 7.85e-01 | 0.0588 |
| 130026 | ICA1L | HTA11_99999974143_84620 | Human | Colorectum | MSS | 3.21e-56 | 1.15e+00 | 0.3005 |
| 130026 | ICA1L | HCC1 | Human | Liver | HCC | 1.53e-12 | 1.75e+00 | 0.5336 |
| 130026 | ICA1L | HCC2 | Human | Liver | HCC | 1.35e-29 | 3.46e+00 | 0.5341 |
| 130026 | ICA1L | HCC5 | Human | Liver | HCC | 1.36e-30 | 2.27e+00 | 0.4932 |
| 130026 | ICA1L | HTA12-15-2 | Human | Pancreas | PDAC | 3.40e-10 | 5.57e-01 | 0.2315 |
| 130026 | ICA1L | HTA12-23-1 | Human | Pancreas | PDAC | 1.74e-14 | 9.57e-01 | 0.3405 |
| 130026 | ICA1L | HTA12-25-1 | Human | Pancreas | PDAC | 2.76e-09 | 6.02e-01 | 0.313 |
| 130026 | ICA1L | HTA12-26-1 | Human | Pancreas | PDAC | 4.22e-23 | 9.00e-01 | 0.3728 |
| 130026 | ICA1L | HTA12-29-1 | Human | Pancreas | PDAC | 8.86e-50 | 9.15e-01 | 0.3722 |
| 130026 | ICA1L | HTA12-30-1 | Human | Pancreas | PDAC | 2.27e-04 | 8.81e-01 | 0.3671 |
| Page: 1 2 |
| Tissue | Expression Dynamics | Abbreviation |
| Colorectum (GSE201348) |  | FAP: Familial adenomatous polyposis |
| CRC: Colorectal cancer | ||
| Colorectum (HTA11) |  | AD: Adenomas |
| SER: Sessile serrated lesions | ||
| MSI-H: Microsatellite-high colorectal cancer | ||
| MSS: Microsatellite stable colorectal cancer | ||
| Liver | 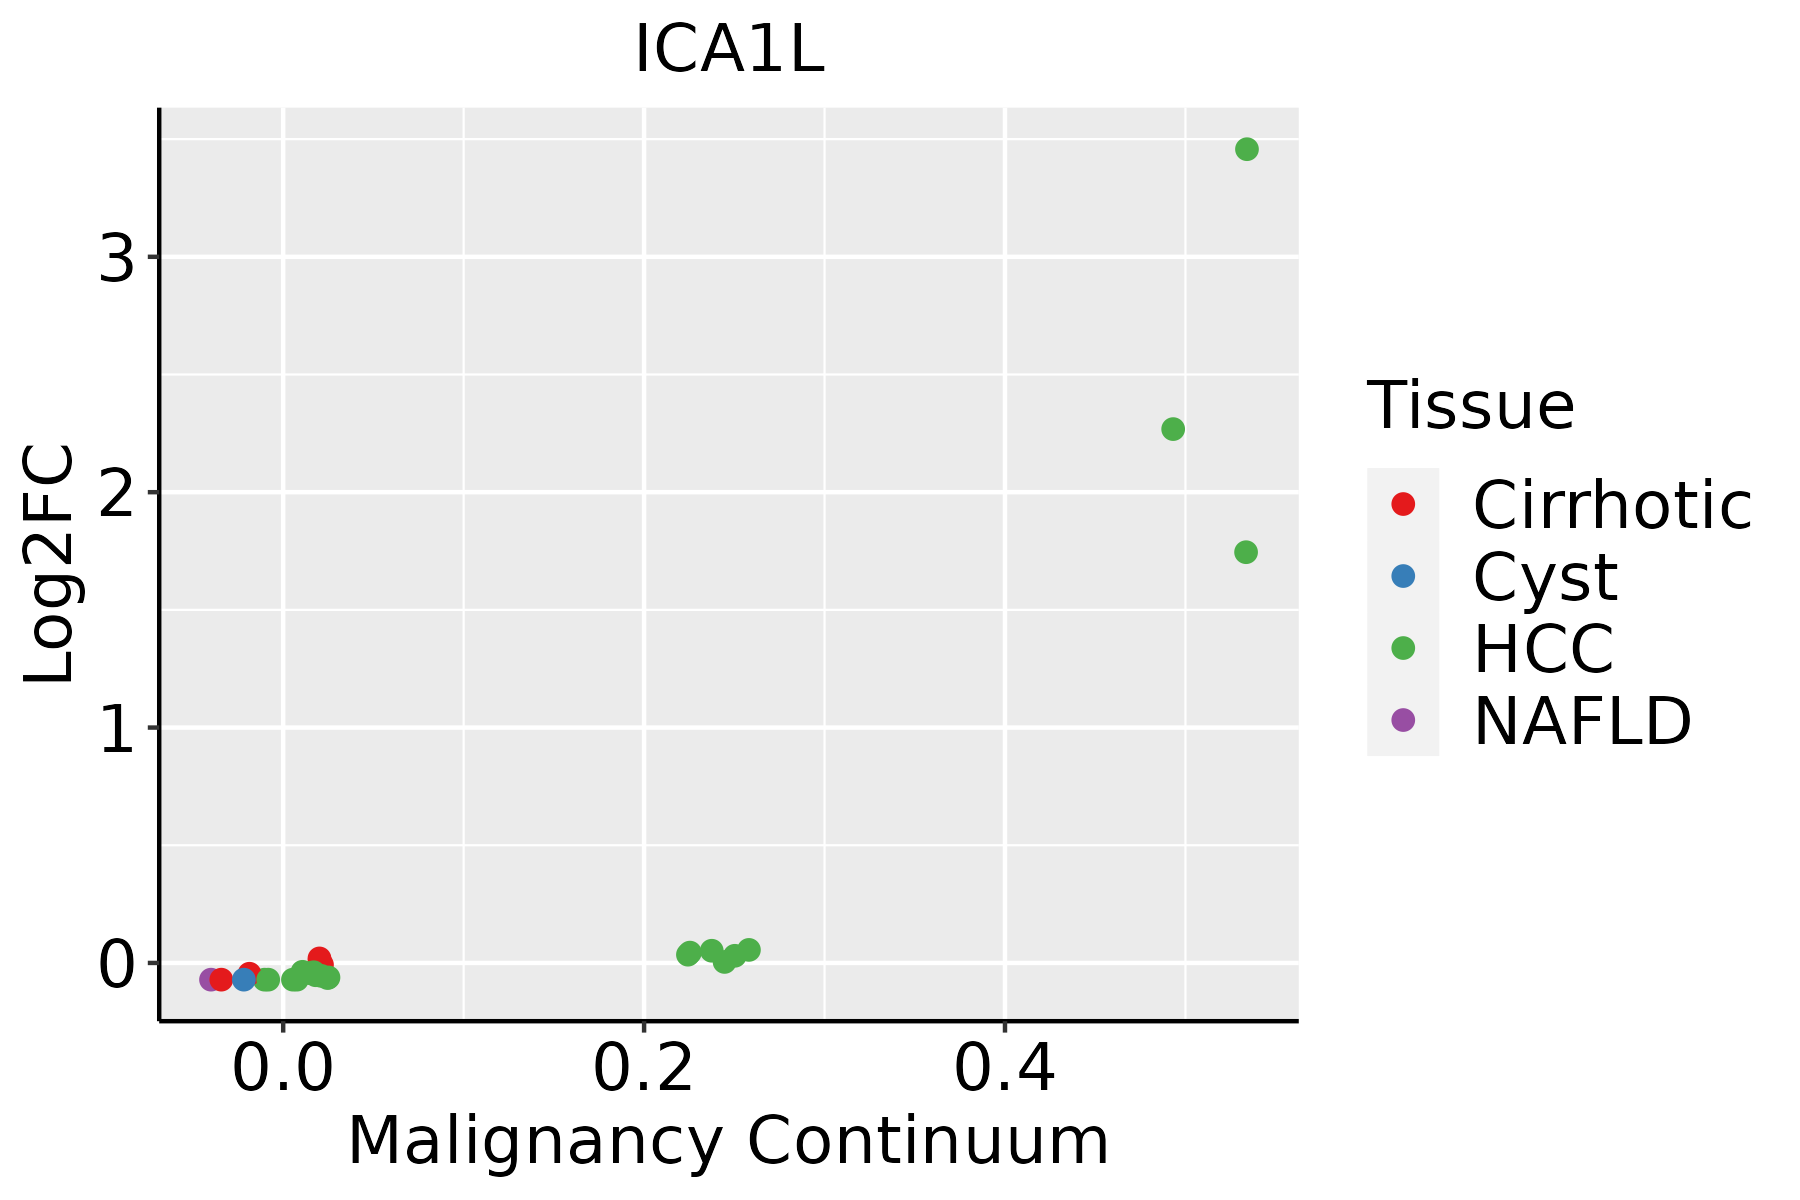 | HCC: Hepatocellular carcinoma |
| NAFLD: Non-alcoholic fatty liver disease | ||
| Thyroid |  | ATC: Anaplastic thyroid cancer |
| HT: Hashimoto's thyroiditis | ||
| PTC: Papillary thyroid cancer |
| ∗log2FC in expression of this searched gene in stem-like cells from each diseased tissue sample relative to stem-like cells in normal samples in each tissue plotted against the malignancy continuum. Samples are colored based on if they are from different disease stage. |
Top |
Malignant transformation related pathway analysis |
| Find out the enriched GO biological processes and KEGG pathways involved in transition from healthy to precancer to cancer |
| Tissue | Disease Stage | Enriched GO biological Processes |
| Colorectum | AD |  |
| Colorectum | SER |  |
| Colorectum | MSS |  |
| Colorectum | MSI-H |  |
| Colorectum | FAP |  |
| ∗Top 15 enriched GO BP terms are showed in the bar plot of each disease state in each tissue. Each row represents a significant GO biological process which is colored according to the -log10(p.adjust). |
| Page: 1 2 3 4 5 6 7 8 9 |
| GO ID | Tissue | Disease Stage | Description | Gene Ratio | Bg Ratio | pvalue | p.adjust | Count |
| Page: 1 |
| Pathway ID | Tissue | Disease Stage | Description | Gene Ratio | Bg Ratio | pvalue | p.adjust | qvalue | Count |
| Page: 1 |
Top |
Cell-cell communication analysis |
| Identification of potential cell-cell interactions between two cell types and their ligand-receptor pairs for different disease states |
| Ligand | Receptor | LRpair | Pathway | Tissue | Disease Stage |
| Page: 1 |
Top |
Single-cell gene regulatory network inference analysis |
| Find out the significant the regulons (TFs) and the target genes of each regulon across cell types for different disease states |
| TF | Cell Type | Tissue | Disease Stage | Target Gene | RSS | Regulon Activity |
| ∗The dot plots of a searched regulon are shown for all cell subpopulations in each disease state of each tissue based on the regulon specific score inferred using pySCENIC and by calculating the average expression. |
| Page: 1 |
Top |
Somatic mutation of malignant transformation related genes |
| Annotation of somatic variants for genes involved in malignant transformation |
| Hugo Symbol | Variant Class | Variant Classification | dbSNP RS | HGVSc | HGVSp | HGVSp Short | SWISSPROT | BIOTYPE | SIFT | PolyPhen | Tumor Sample Barcode | Tissue | Histology | Sex | Age | Stage | Therapy Types | Drugs | Outcome |
| ICA1L | SNV | Missense_Mutation | novel | c.14G>C | p.Gly5Ala | p.G5A | Q8NDH6 | protein_coding | tolerated(0.3) | benign(0.096) | TCGA-A2-A3XZ-01 | Breast | breast invasive carcinoma | Female | <65 | I/II | Chemotherapy | carboplatin | CR |
| ICA1L | SNV | Missense_Mutation | c.549N>C | p.Lys183Asn | p.K183N | Q8NDH6 | protein_coding | deleterious(0) | probably_damaging(0.98) | TCGA-AC-A23C-01 | Breast | breast invasive carcinoma | Female | <65 | I/II | Chemotherapy | chemo | CR | |
| ICA1L | SNV | Missense_Mutation | c.1210G>C | p.Asp404His | p.D404H | Q8NDH6 | protein_coding | deleterious(0.01) | probably_damaging(1) | TCGA-BH-A0B4-01 | Breast | breast invasive carcinoma | Male | >=65 | III/IV | Hormone Therapy | tamoxiphen | SD | |
| ICA1L | SNV | Missense_Mutation | c.979N>C | p.Glu327Gln | p.E327Q | Q8NDH6 | protein_coding | tolerated(0.29) | benign(0.014) | TCGA-C8-A12K-01 | Breast | breast invasive carcinoma | Female | >=65 | I/II | Unknown | Unknown | SD | |
| ICA1L | deletion | Frame_Shift_Del | novel | c.993_1017delNNNNNNNNNNNNNNNNNNNNNNNNN | p.Asp332GlufsTer11 | p.D332Efs*11 | Q8NDH6 | protein_coding | TCGA-E9-A1NC-01 | Breast | breast invasive carcinoma | Female | <65 | I/II | Chemotherapy | doxorubicin | CR | ||
| ICA1L | SNV | Missense_Mutation | rs750934313 | c.1174G>A | p.Ala392Thr | p.A392T | Q8NDH6 | protein_coding | tolerated(0.33) | benign(0.031) | TCGA-2W-A8YY-01 | Cervix | cervical & endocervical cancer | Female | <65 | I/II | Chemotherapy | cisplatin | CR |
| ICA1L | SNV | Missense_Mutation | c.640G>A | p.Ala214Thr | p.A214T | Q8NDH6 | protein_coding | deleterious(0.01) | probably_damaging(1) | TCGA-AA-3663-01 | Colorectum | colon adenocarcinoma | Male | <65 | I/II | Unknown | Unknown | SD | |
| ICA1L | SNV | Missense_Mutation | c.817G>A | p.Asp273Asn | p.D273N | Q8NDH6 | protein_coding | tolerated(0.1) | benign(0.023) | TCGA-AA-3864-01 | Colorectum | colon adenocarcinoma | Male | >=65 | I/II | Unknown | Unknown | SD | |
| ICA1L | SNV | Missense_Mutation | c.1006G>T | p.Asp336Tyr | p.D336Y | Q8NDH6 | protein_coding | deleterious(0) | possibly_damaging(0.879) | TCGA-AA-3977-01 | Colorectum | colon adenocarcinoma | Male | >=65 | I/II | Unknown | Unknown | SD | |
| ICA1L | SNV | Missense_Mutation | novel | c.433N>G | p.Thr145Ala | p.T145A | Q8NDH6 | protein_coding | deleterious(0) | probably_damaging(0.926) | TCGA-CA-6717-01 | Colorectum | colon adenocarcinoma | Male | <65 | I/II | Chemotherapy | oxaliplatin | CR |
| Page: 1 2 3 4 5 |
Top |
Related drugs of malignant transformation related genes |
| Identification of chemicals and drugs interact with genes involved in malignant transfromation |
| (DGIdb 4.0) |
| Entrez ID | Symbol | Category | Interaction Types | Drug Claim Name | Drug Name | PMIDs |
| Page: 1 |

Copyright 2023-Present -The University of Texas Health Science Center at Houston |