
|
|||||
|
 | |
| |
| |
| |
| |
| |
|
Gene: IBA57 |
Gene summary for IBA57 |
| Gene information | Species | Human | Gene symbol | IBA57 | Gene ID | 200205 |
| Gene name | iron-sulfur cluster assembly factor IBA57 | |
| Gene Alias | C1orf69 | |
| Cytomap | 1q42.13 | |
| Gene Type | protein-coding | GO ID | GO:0006725 | UniProtAcc | Q5T440 |
Top |
Malignant transformation analysis |
| Identification of the aberrant gene expression in precancerous and cancerous lesions by comparing the gene expression of stem-like cells in diseased tissues with normal stem cells |
| Entrez ID | Symbol | Replicates | Species | Organ | Tissue | Adj P-value | Log2FC | Malignancy |
| 200205 | IBA57 | HCC1_Meng | Human | Liver | HCC | 3.58e-14 | -2.46e-02 | 0.0246 |
| 200205 | IBA57 | HCC1 | Human | Liver | HCC | 7.09e-27 | 3.11e+00 | 0.5336 |
| 200205 | IBA57 | HCC2 | Human | Liver | HCC | 1.84e-36 | 3.40e+00 | 0.5341 |
| 200205 | IBA57 | HCC5 | Human | Liver | HCC | 2.13e-56 | 2.70e+00 | 0.4932 |
| 200205 | IBA57 | S015 | Human | Liver | HCC | 1.98e-03 | 1.57e-01 | 0.2375 |
| 200205 | IBA57 | S016 | Human | Liver | HCC | 1.78e-02 | 1.89e-01 | 0.2243 |
| 200205 | IBA57 | C04 | Human | Oral cavity | OSCC | 4.61e-09 | 4.14e-01 | 0.2633 |
| 200205 | IBA57 | C21 | Human | Oral cavity | OSCC | 5.54e-17 | 5.02e-01 | 0.2678 |
| 200205 | IBA57 | C30 | Human | Oral cavity | OSCC | 2.85e-15 | 6.52e-01 | 0.3055 |
| 200205 | IBA57 | C38 | Human | Oral cavity | OSCC | 9.34e-03 | 4.04e-01 | 0.172 |
| 200205 | IBA57 | C43 | Human | Oral cavity | OSCC | 2.00e-08 | 1.61e-01 | 0.1704 |
| 200205 | IBA57 | C46 | Human | Oral cavity | OSCC | 1.81e-08 | 2.48e-01 | 0.1673 |
| 200205 | IBA57 | C06 | Human | Oral cavity | OSCC | 1.28e-04 | 4.24e-01 | 0.2699 |
| 200205 | IBA57 | C08 | Human | Oral cavity | OSCC | 9.03e-10 | 1.87e-01 | 0.1919 |
| 200205 | IBA57 | C09 | Human | Oral cavity | OSCC | 2.94e-02 | 9.40e-02 | 0.1431 |
| 200205 | IBA57 | LN46 | Human | Oral cavity | OSCC | 1.40e-03 | 2.42e-01 | 0.1666 |
| 200205 | IBA57 | LP15 | Human | Oral cavity | LP | 1.16e-05 | 5.38e-01 | 0.2174 |
| 200205 | IBA57 | SYSMH2 | Human | Oral cavity | OSCC | 3.73e-03 | 1.40e-01 | 0.2326 |
| 200205 | IBA57 | SYSMH3 | Human | Oral cavity | OSCC | 8.35e-04 | 8.88e-02 | 0.2442 |
| Page: 1 |
| Tissue | Expression Dynamics | Abbreviation |
| Liver | 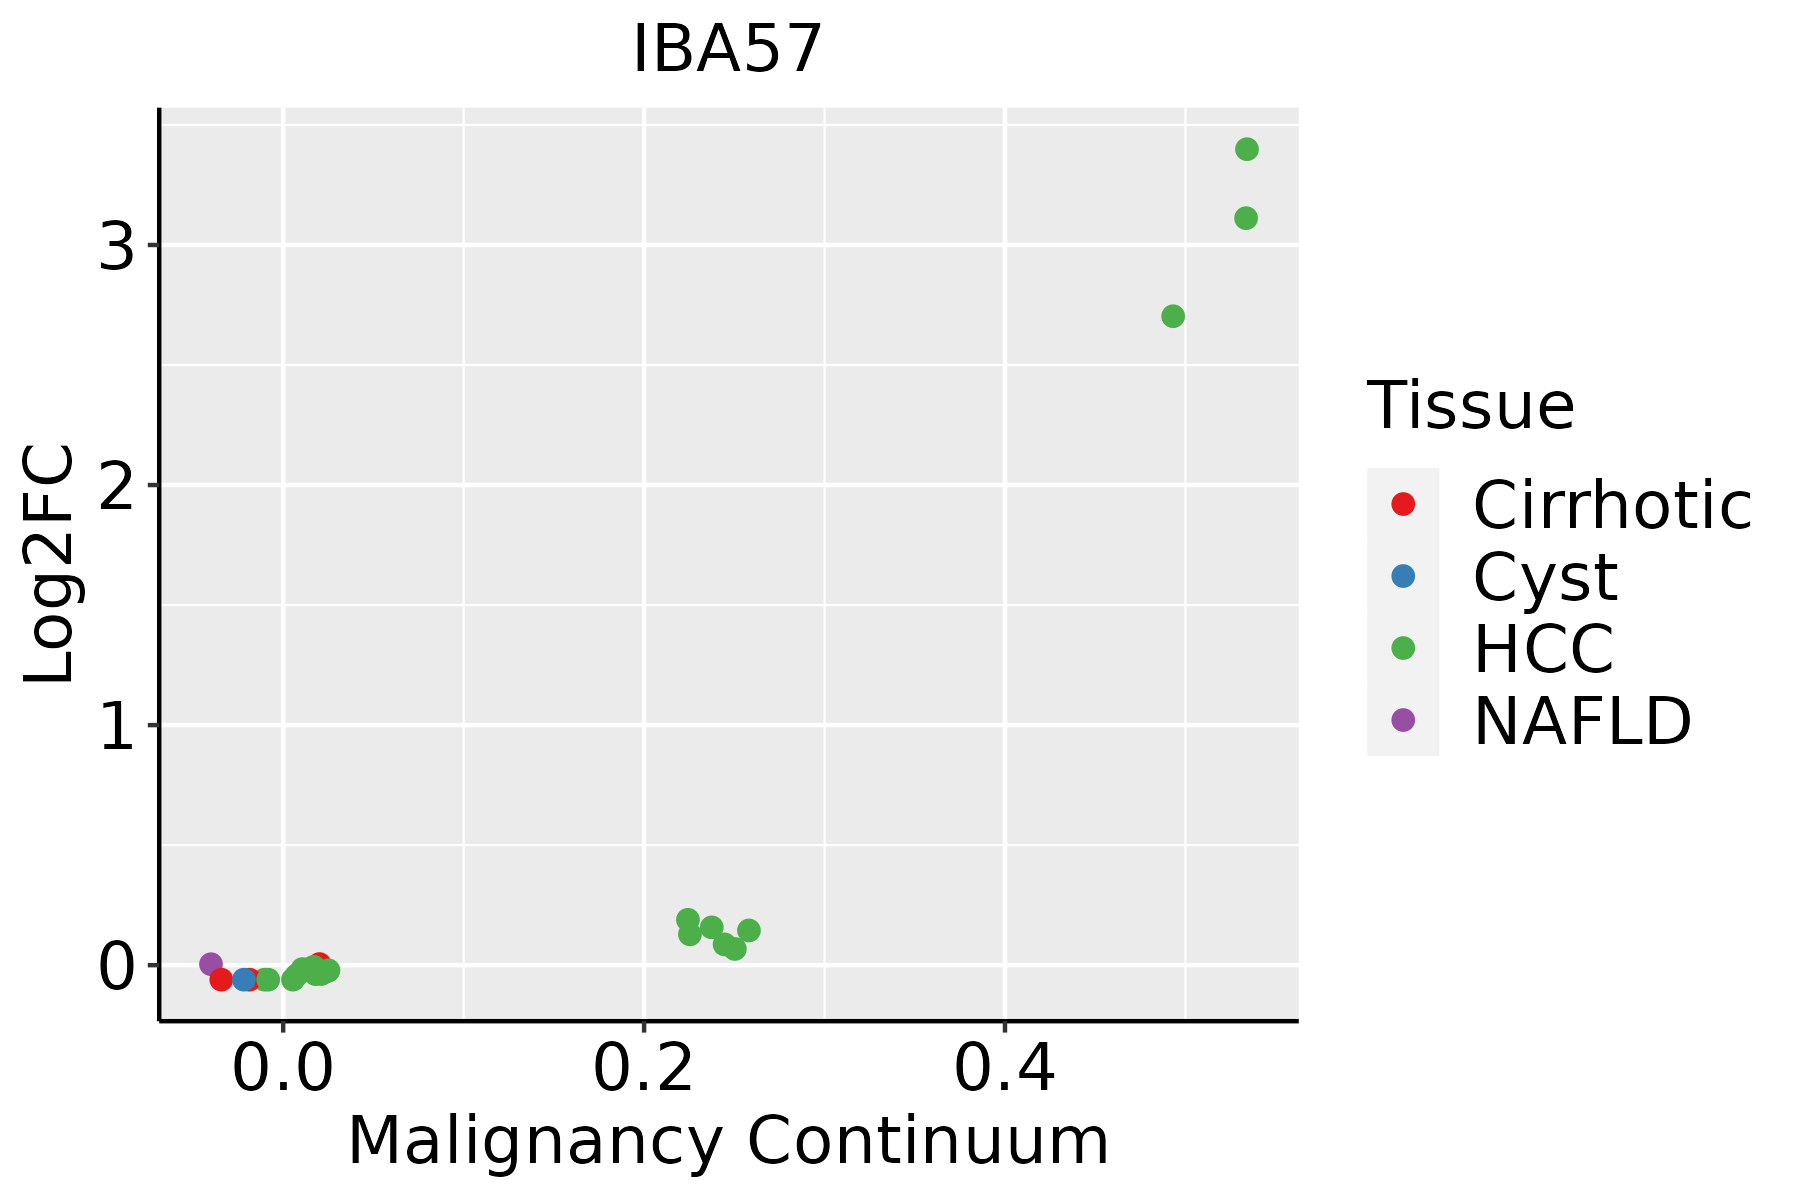 | HCC: Hepatocellular carcinoma |
| NAFLD: Non-alcoholic fatty liver disease | ||
| Oral Cavity | 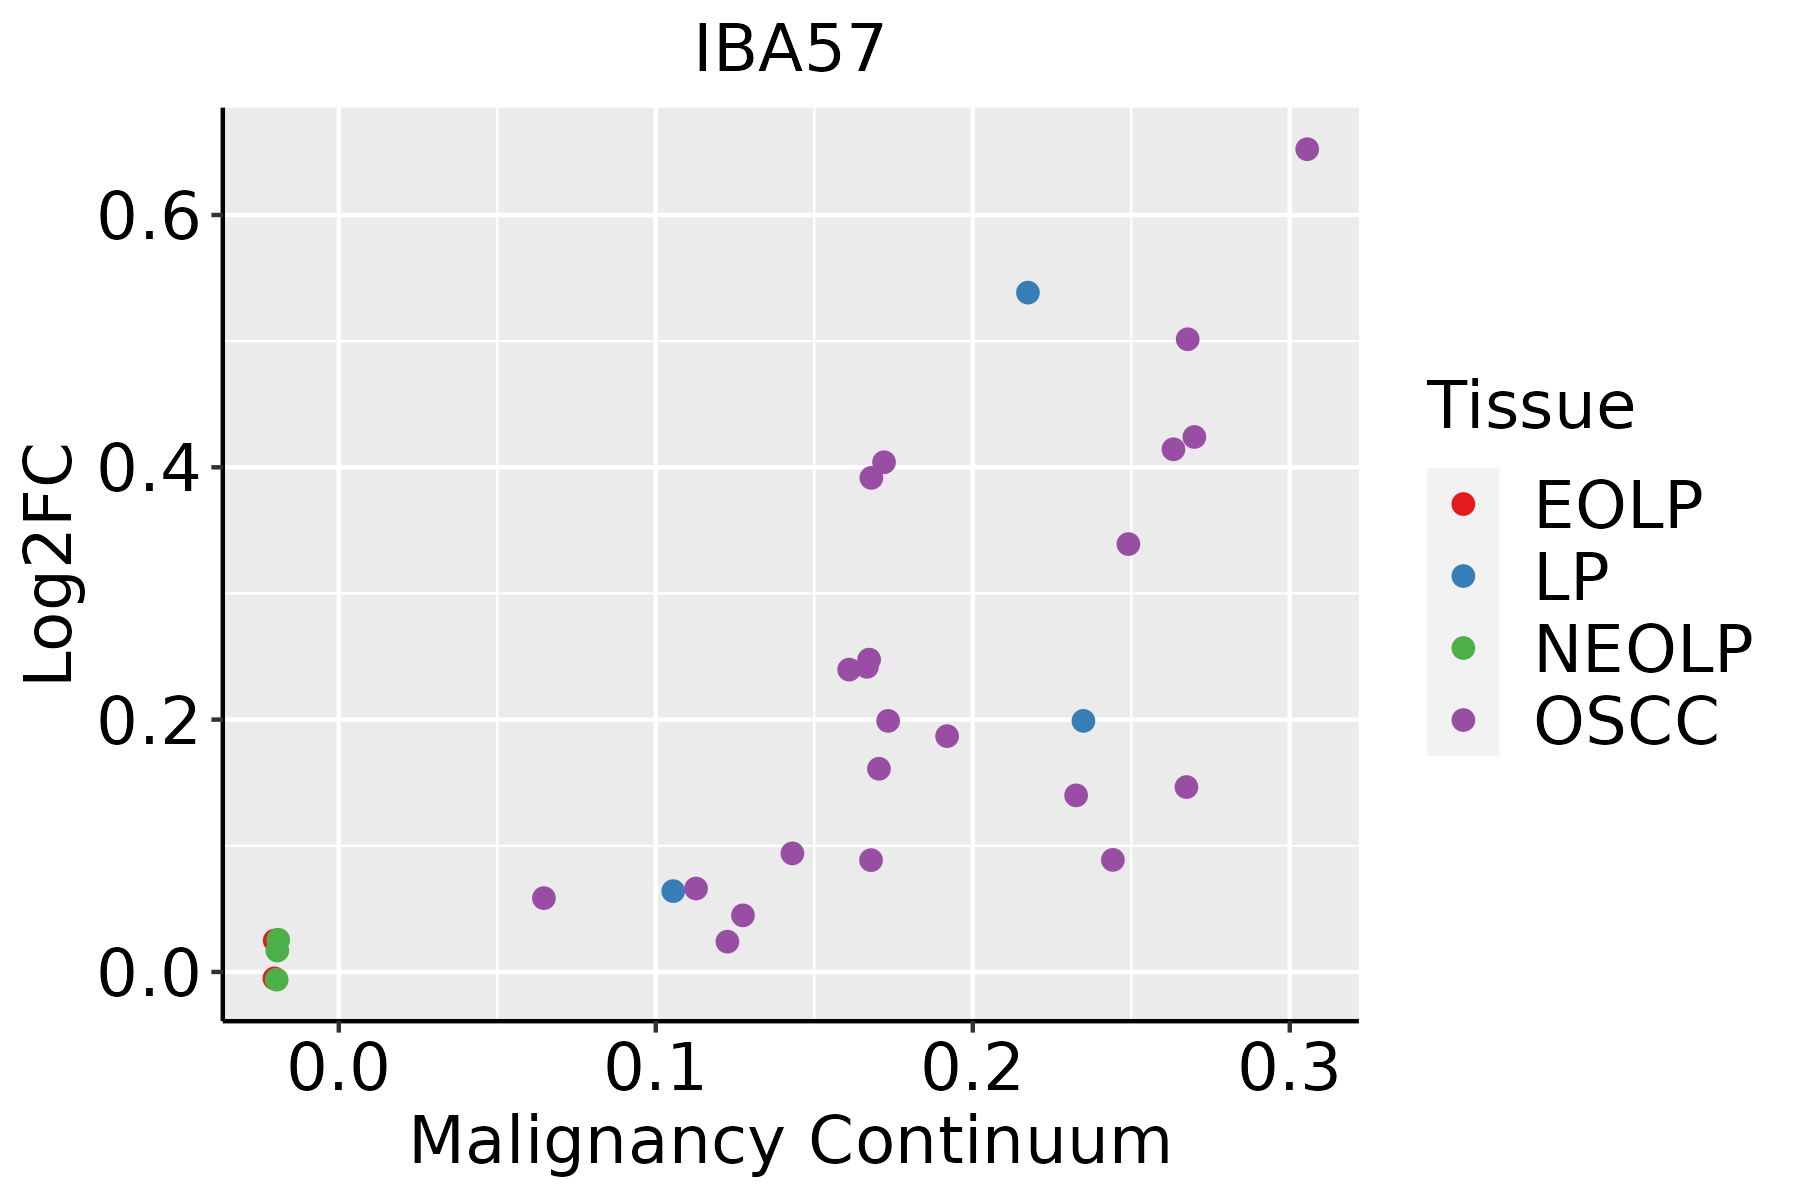 | EOLP: Erosive Oral lichen planus |
| LP: leukoplakia | ||
| NEOLP: Non-erosive oral lichen planus | ||
| OSCC: Oral squamous cell carcinoma |
| ∗log2FC in expression of this searched gene in stem-like cells from each diseased tissue sample relative to stem-like cells in normal samples in each tissue plotted against the malignancy continuum. Samples are colored based on if they are from different disease stage. |
Top |
Malignant transformation related pathway analysis |
| Find out the enriched GO biological processes and KEGG pathways involved in transition from healthy to precancer to cancer |
| Tissue | Disease Stage | Enriched GO biological Processes |
| Colorectum | AD |  |
| Colorectum | SER |  |
| Colorectum | MSS |  |
| Colorectum | MSI-H |  |
| Colorectum | FAP |  |
| ∗Top 15 enriched GO BP terms are showed in the bar plot of each disease state in each tissue. Each row represents a significant GO biological process which is colored according to the -log10(p.adjust). |
| Page: 1 2 3 4 5 6 7 8 9 |
| GO ID | Tissue | Disease Stage | Description | Gene Ratio | Bg Ratio | pvalue | p.adjust | Count |
| GO:000679021 | Liver | HCC | sulfur compound metabolic process | 212/7958 | 339/18723 | 5.60e-14 | 3.39e-12 | 212 |
| GO:0042168 | Liver | HCC | heme metabolic process | 30/7958 | 42/18723 | 1.40e-04 | 1.13e-03 | 30 |
| GO:00330131 | Liver | HCC | tetrapyrrole metabolic process | 39/7958 | 59/18723 | 2.14e-04 | 1.63e-03 | 39 |
| GO:00067781 | Liver | HCC | porphyrin-containing compound metabolic process | 33/7958 | 49/18723 | 3.86e-04 | 2.62e-03 | 33 |
| GO:0042440 | Liver | HCC | pigment metabolic process | 51/7958 | 84/18723 | 5.74e-04 | 3.65e-03 | 51 |
| GO:0006783 | Liver | HCC | heme biosynthetic process | 19/7958 | 27/18723 | 3.18e-03 | 1.47e-02 | 19 |
| GO:0006779 | Liver | HCC | porphyrin-containing compound biosynthetic process | 21/7958 | 31/18723 | 4.01e-03 | 1.76e-02 | 21 |
| GO:0033014 | Liver | HCC | tetrapyrrole biosynthetic process | 21/7958 | 31/18723 | 4.01e-03 | 1.76e-02 | 21 |
| GO:0046148 | Liver | HCC | pigment biosynthetic process | 37/7958 | 62/18723 | 4.73e-03 | 2.02e-02 | 37 |
| GO:0016226 | Liver | HCC | iron-sulfur cluster assembly | 18/7958 | 26/18723 | 5.37e-03 | 2.24e-02 | 18 |
| GO:0031163 | Liver | HCC | metallo-sulfur cluster assembly | 18/7958 | 26/18723 | 5.37e-03 | 2.24e-02 | 18 |
| GO:00067905 | Oral cavity | OSCC | sulfur compound metabolic process | 168/7305 | 339/18723 | 4.50e-05 | 3.84e-04 | 168 |
| GO:00162262 | Oral cavity | OSCC | iron-sulfur cluster assembly | 19/7305 | 26/18723 | 4.46e-04 | 2.70e-03 | 19 |
| GO:00311632 | Oral cavity | OSCC | metallo-sulfur cluster assembly | 19/7305 | 26/18723 | 4.46e-04 | 2.70e-03 | 19 |
| GO:00461481 | Oral cavity | OSCC | pigment biosynthetic process | 36/7305 | 62/18723 | 1.82e-03 | 8.57e-03 | 36 |
| GO:00067831 | Oral cavity | OSCC | heme biosynthetic process | 17/7305 | 27/18723 | 1.01e-02 | 3.49e-02 | 17 |
| GO:00162261 | Oral cavity | LP | iron-sulfur cluster assembly | 15/4623 | 26/18723 | 3.34e-04 | 3.34e-03 | 15 |
| GO:00311631 | Oral cavity | LP | metallo-sulfur cluster assembly | 15/4623 | 26/18723 | 3.34e-04 | 3.34e-03 | 15 |
| GO:000679012 | Oral cavity | LP | sulfur compound metabolic process | 106/4623 | 339/18723 | 3.36e-03 | 2.25e-02 | 106 |
| Page: 1 |
| Pathway ID | Tissue | Disease Stage | Description | Gene Ratio | Bg Ratio | pvalue | p.adjust | qvalue | Count |
| Page: 1 |
Top |
Cell-cell communication analysis |
| Identification of potential cell-cell interactions between two cell types and their ligand-receptor pairs for different disease states |
| Ligand | Receptor | LRpair | Pathway | Tissue | Disease Stage |
| Page: 1 |
Top |
Single-cell gene regulatory network inference analysis |
| Find out the significant the regulons (TFs) and the target genes of each regulon across cell types for different disease states |
| TF | Cell Type | Tissue | Disease Stage | Target Gene | RSS | Regulon Activity |
| ∗The dot plots of a searched regulon are shown for all cell subpopulations in each disease state of each tissue based on the regulon specific score inferred using pySCENIC and by calculating the average expression. |
| Page: 1 |
Top |
Somatic mutation of malignant transformation related genes |
| Annotation of somatic variants for genes involved in malignant transformation |
| Hugo Symbol | Variant Class | Variant Classification | dbSNP RS | HGVSc | HGVSp | HGVSp Short | SWISSPROT | BIOTYPE | SIFT | PolyPhen | Tumor Sample Barcode | Tissue | Histology | Sex | Age | Stage | Therapy Types | Drugs | Outcome |
| IBA57 | SNV | Missense_Mutation | c.908N>T | p.Ser303Leu | p.S303L | Q5T440 | protein_coding | deleterious(0.05) | benign(0.055) | TCGA-UC-A7PD-01 | Cervix | cervical & endocervical cancer | Female | <65 | I/II | Unknown | Unknown | PD | |
| IBA57 | SNV | Missense_Mutation | c.847C>T | p.Arg283Trp | p.R283W | Q5T440 | protein_coding | deleterious(0) | possibly_damaging(0.892) | TCGA-AA-A022-01 | Colorectum | colon adenocarcinoma | Female | >=65 | I/II | Unknown | Unknown | SD | |
| IBA57 | SNV | Missense_Mutation | novel | c.503N>G | p.Glu168Gly | p.E168G | Q5T440 | protein_coding | tolerated(0.25) | benign(0.029) | TCGA-DM-A28A-01 | Colorectum | colon adenocarcinoma | Male | >=65 | III/IV | Unknown | Unknown | SD |
| IBA57 | SNV | Missense_Mutation | rs749840888 | c.848G>A | p.Arg283Gln | p.R283Q | Q5T440 | protein_coding | tolerated(0.54) | benign(0.022) | TCGA-WS-AB45-01 | Colorectum | colon adenocarcinoma | Female | <65 | I/II | Unknown | Unknown | SD |
| IBA57 | SNV | Missense_Mutation | novel | c.1001G>T | p.Arg334Ile | p.R334I | Q5T440 | protein_coding | deleterious(0.01) | benign(0.229) | TCGA-A5-A1OF-01 | Endometrium | uterine corpus endometrioid carcinoma | Female | <65 | I/II | Unknown | Unknown | SD |
| IBA57 | SNV | Missense_Mutation | novel | c.569G>A | p.Arg190Gln | p.R190Q | Q5T440 | protein_coding | deleterious(0) | probably_damaging(0.999) | TCGA-AJ-A3NE-01 | Endometrium | uterine corpus endometrioid carcinoma | Female | <65 | I/II | Unknown | Unknown | SD |
| IBA57 | SNV | Missense_Mutation | novel | c.881N>T | p.Thr294Ile | p.T294I | Q5T440 | protein_coding | tolerated(0.07) | benign(0.018) | TCGA-AP-A1DK-01 | Endometrium | uterine corpus endometrioid carcinoma | Female | <65 | I/II | Unknown | Unknown | SD |
| IBA57 | SNV | Missense_Mutation | rs145655747 | c.491N>T | p.Pro164Leu | p.P164L | Q5T440 | protein_coding | deleterious(0) | probably_damaging(0.954) | TCGA-AX-A2HJ-01 | Endometrium | uterine corpus endometrioid carcinoma | Female | <65 | I/II | Unknown | Unknown | SD |
| IBA57 | SNV | Missense_Mutation | rs753604716 | c.668N>A | p.Arg223Gln | p.R223Q | Q5T440 | protein_coding | deleterious(0) | probably_damaging(1) | TCGA-BG-A221-01 | Endometrium | uterine corpus endometrioid carcinoma | Female | >=65 | I/II | Unknown | Unknown | SD |
| IBA57 | SNV | Missense_Mutation | rs781137419 | c.493A>G | p.Ser165Gly | p.S165G | Q5T440 | protein_coding | tolerated(0.75) | benign(0.003) | TCGA-DF-A2KN-01 | Endometrium | uterine corpus endometrioid carcinoma | Female | Unknown | I/II | Unknown | Unknown | SD |
| Page: 1 2 3 4 |
Top |
Related drugs of malignant transformation related genes |
| Identification of chemicals and drugs interact with genes involved in malignant transfromation |
| (DGIdb 4.0) |
| Entrez ID | Symbol | Category | Interaction Types | Drug Claim Name | Drug Name | PMIDs |
| Page: 1 |

Copyright 2023-Present -The University of Texas Health Science Center at Houston |