
|
|||||
|
 | |
| |
| |
| |
| |
| |
|
Gene: IARS2 |
Gene summary for IARS2 |
| Gene information | Species | Human | Gene symbol | IARS2 | Gene ID | 55699 |
| Gene name | isoleucyl-tRNA synthetase 2, mitochondrial | |
| Gene Alias | CAGSSS | |
| Cytomap | 1q41 | |
| Gene Type | protein-coding | GO ID | GO:0006082 | UniProtAcc | Q9NSE4 |
Top |
Malignant transformation analysis |
| Identification of the aberrant gene expression in precancerous and cancerous lesions by comparing the gene expression of stem-like cells in diseased tissues with normal stem cells |
| Entrez ID | Symbol | Replicates | Species | Organ | Tissue | Adj P-value | Log2FC | Malignancy |
| 55699 | IARS2 | HTA11_347_2000001011 | Human | Colorectum | AD | 2.86e-06 | 3.70e-01 | -0.1954 |
| 55699 | IARS2 | HTA11_99999965104_69814 | Human | Colorectum | MSS | 2.75e-03 | 4.05e-01 | 0.281 |
| 55699 | IARS2 | A015-C-203 | Human | Colorectum | FAP | 2.10e-09 | -1.87e-01 | -0.1294 |
| 55699 | IARS2 | A001-C-108 | Human | Colorectum | FAP | 4.04e-03 | -8.75e-02 | -0.0272 |
| 55699 | IARS2 | A002-C-205 | Human | Colorectum | FAP | 6.82e-03 | -1.23e-01 | -0.1236 |
| 55699 | IARS2 | A015-C-006 | Human | Colorectum | FAP | 5.60e-03 | -2.10e-01 | -0.0994 |
| 55699 | IARS2 | A015-C-106 | Human | Colorectum | FAP | 1.48e-03 | -1.11e-01 | -0.0511 |
| 55699 | IARS2 | A002-C-114 | Human | Colorectum | FAP | 1.35e-02 | -1.51e-01 | -0.1561 |
| 55699 | IARS2 | A015-C-104 | Human | Colorectum | FAP | 5.98e-08 | -1.42e-01 | -0.1899 |
| 55699 | IARS2 | A001-C-014 | Human | Colorectum | FAP | 6.49e-05 | -1.07e-01 | 0.0135 |
| 55699 | IARS2 | A002-C-016 | Human | Colorectum | FAP | 8.71e-03 | -8.71e-02 | 0.0521 |
| 55699 | IARS2 | A001-C-203 | Human | Colorectum | FAP | 5.30e-03 | -8.34e-02 | -0.0481 |
| 55699 | IARS2 | A002-C-116 | Human | Colorectum | FAP | 9.73e-09 | -1.45e-01 | -0.0452 |
| 55699 | IARS2 | A018-E-020 | Human | Colorectum | FAP | 1.08e-03 | -1.71e-01 | -0.2034 |
| 55699 | IARS2 | F034 | Human | Colorectum | FAP | 6.15e-05 | -1.57e-01 | -0.0665 |
| 55699 | IARS2 | CRC-3-11773 | Human | Colorectum | CRC | 4.71e-02 | -9.99e-02 | 0.2564 |
| 55699 | IARS2 | LZE2T | Human | Esophagus | ESCC | 4.43e-13 | 1.64e+00 | 0.082 |
| 55699 | IARS2 | LZE4T | Human | Esophagus | ESCC | 3.85e-12 | 5.37e-01 | 0.0811 |
| 55699 | IARS2 | LZE7T | Human | Esophagus | ESCC | 7.38e-13 | 8.10e-01 | 0.0667 |
| 55699 | IARS2 | LZE20T | Human | Esophagus | ESCC | 8.45e-03 | 1.54e-01 | 0.0662 |
| Page: 1 2 3 4 5 6 7 |
| Tissue | Expression Dynamics | Abbreviation |
| Colorectum (GSE201348) |  | FAP: Familial adenomatous polyposis |
| CRC: Colorectal cancer | ||
| Colorectum (HTA11) |  | AD: Adenomas |
| SER: Sessile serrated lesions | ||
| MSI-H: Microsatellite-high colorectal cancer | ||
| MSS: Microsatellite stable colorectal cancer | ||
| Esophagus |  | ESCC: Esophageal squamous cell carcinoma |
| HGIN: High-grade intraepithelial neoplasias | ||
| LGIN: Low-grade intraepithelial neoplasias | ||
| Liver | 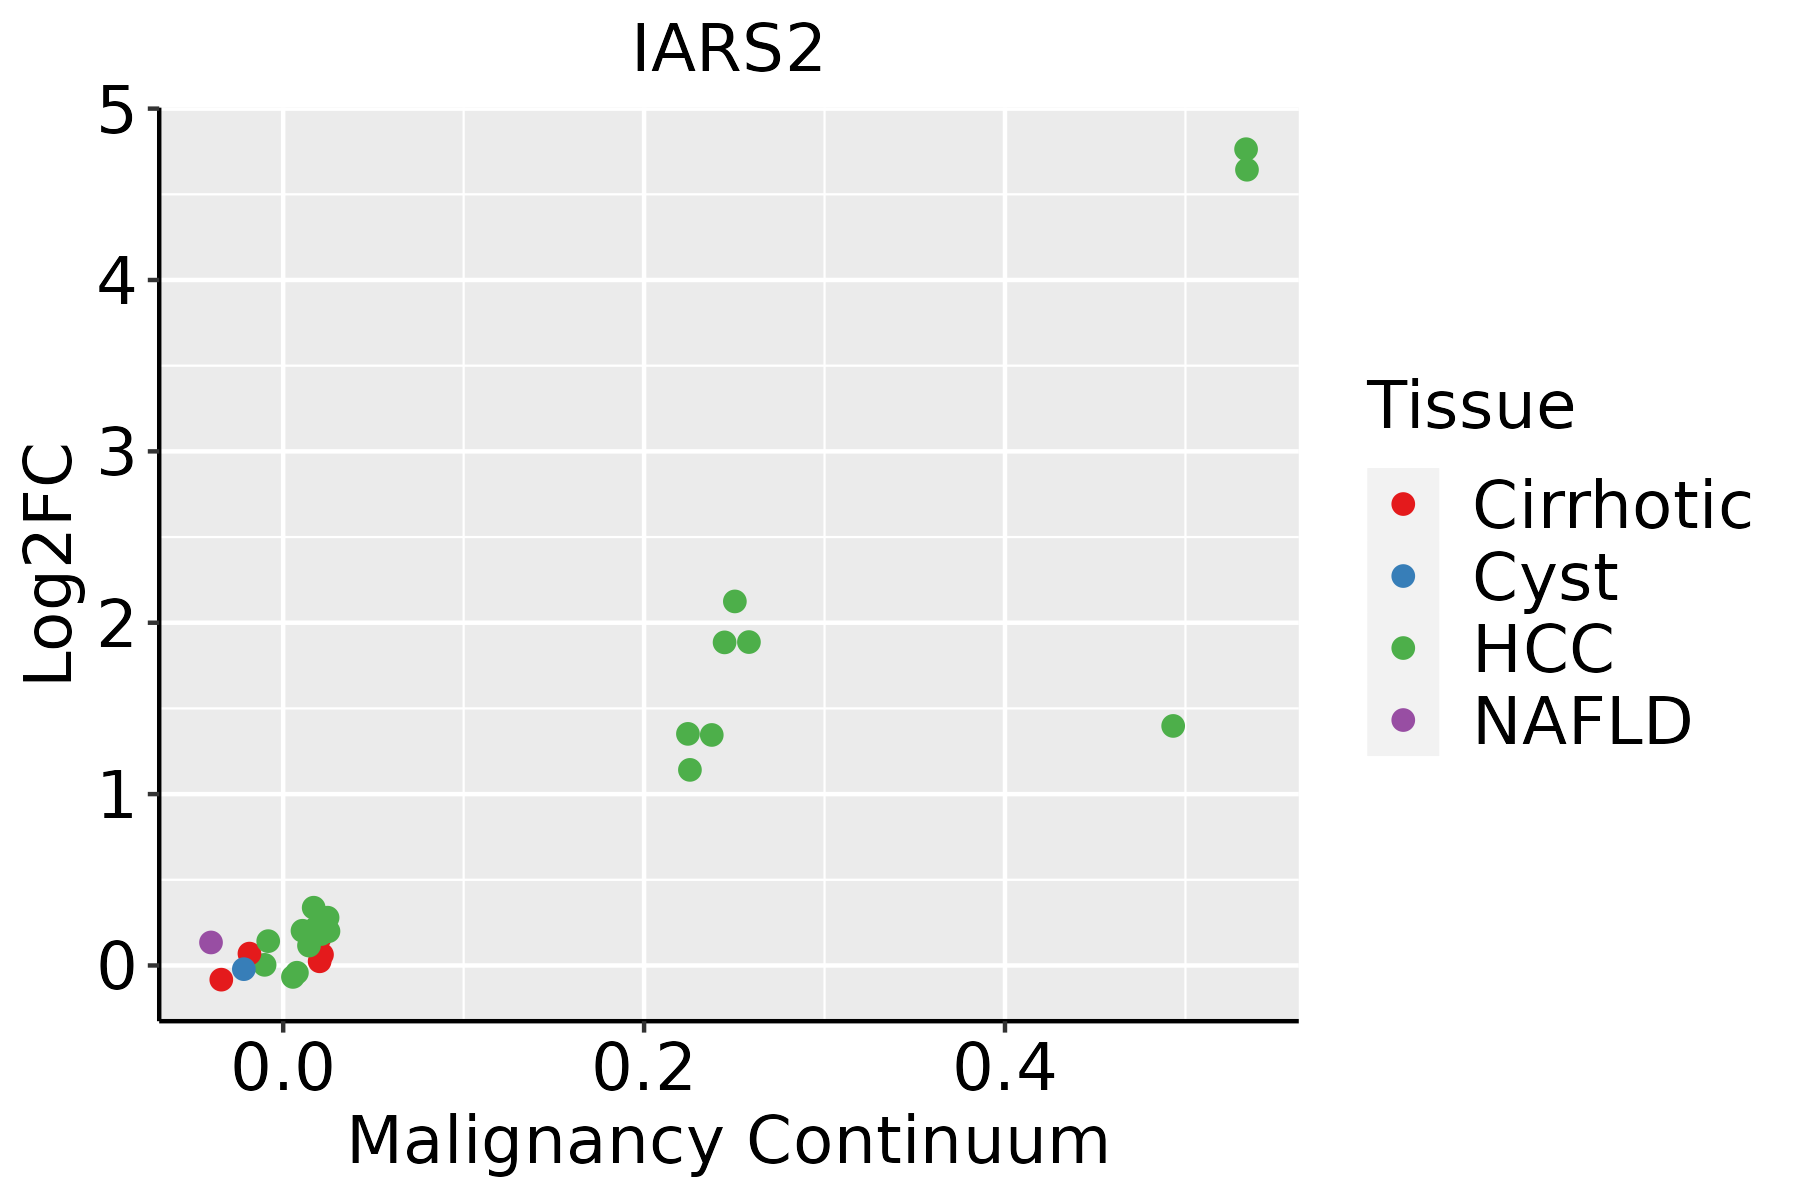 | HCC: Hepatocellular carcinoma |
| NAFLD: Non-alcoholic fatty liver disease | ||
| Oral Cavity |  | EOLP: Erosive Oral lichen planus |
| LP: leukoplakia | ||
| NEOLP: Non-erosive oral lichen planus | ||
| OSCC: Oral squamous cell carcinoma | ||
| Prostate | 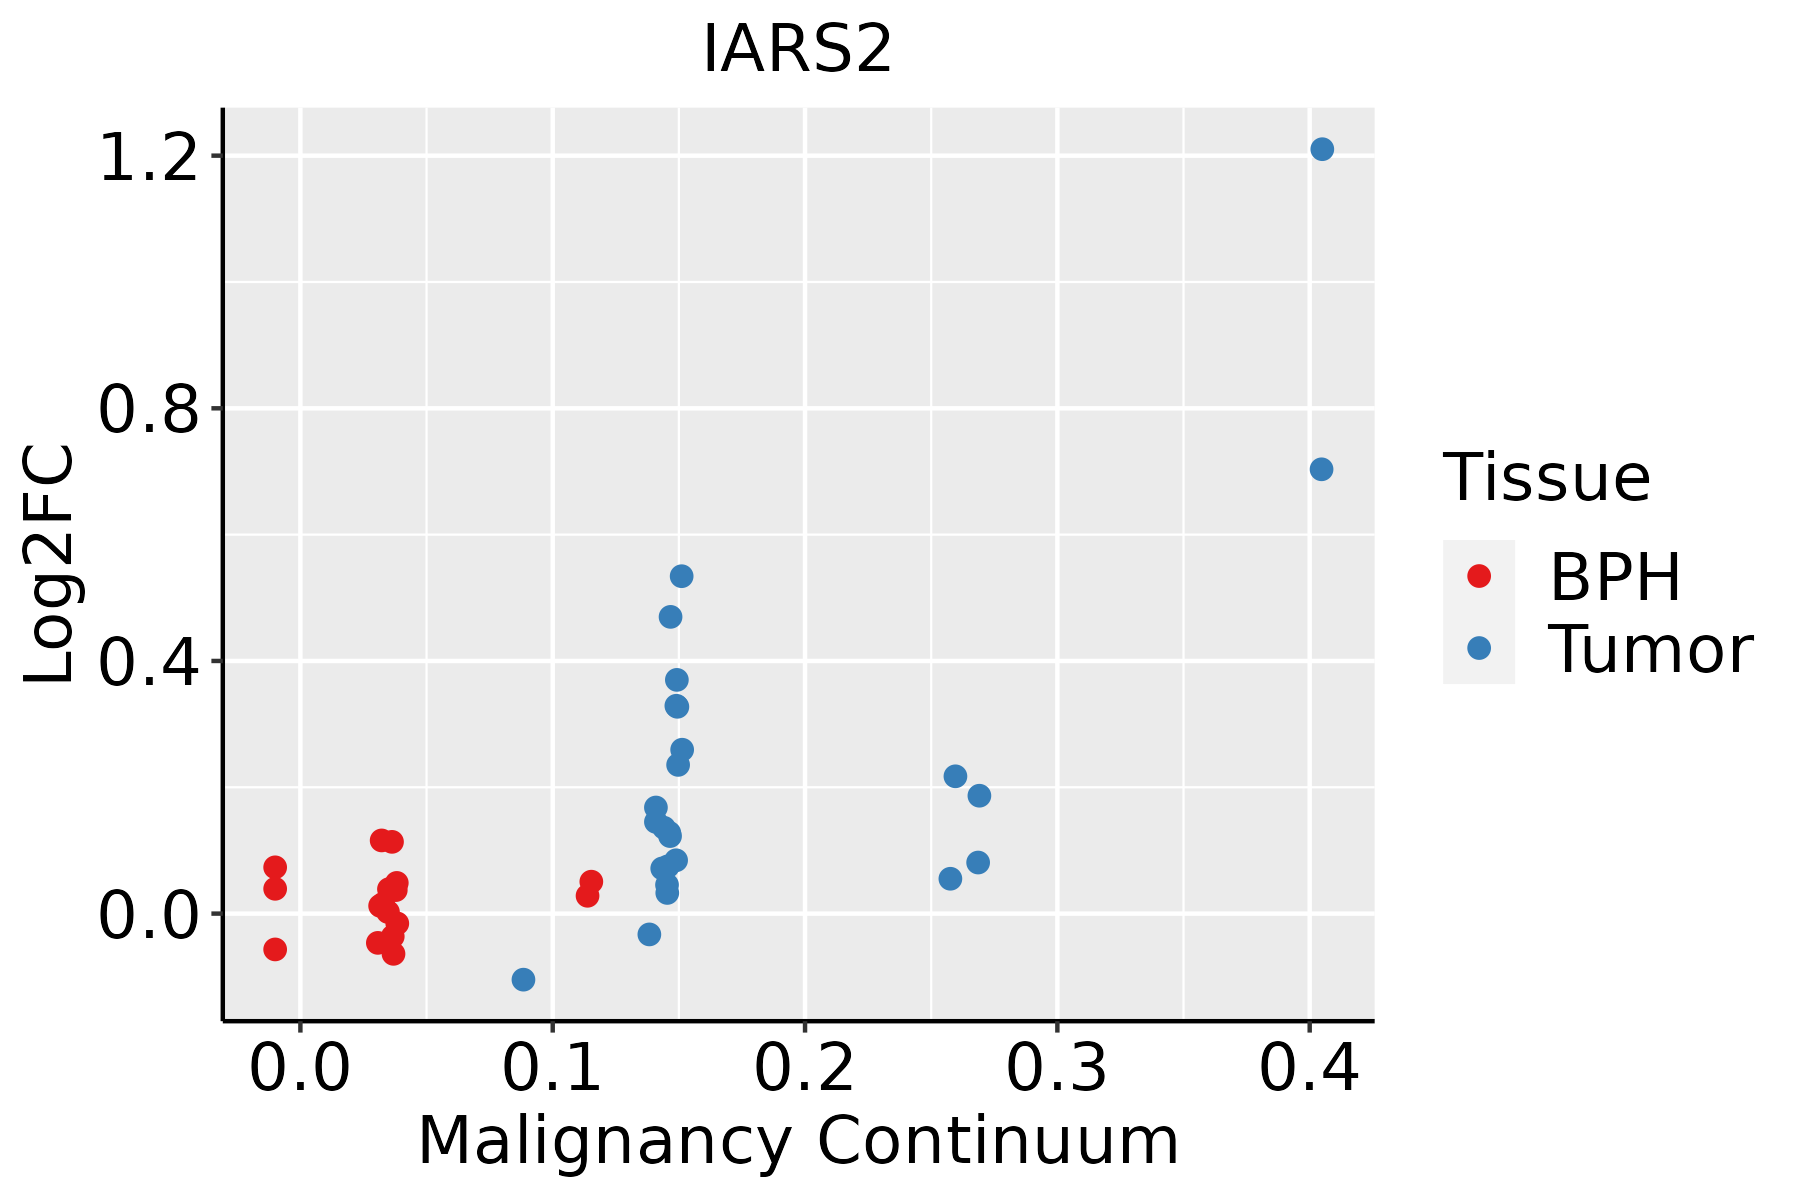 | BPH: Benign Prostatic Hyperplasia |
| Skin |  | AK: Actinic keratosis |
| cSCC: Cutaneous squamous cell carcinoma | ||
| SCCIS:squamous cell carcinoma in situ | ||
| Thyroid | 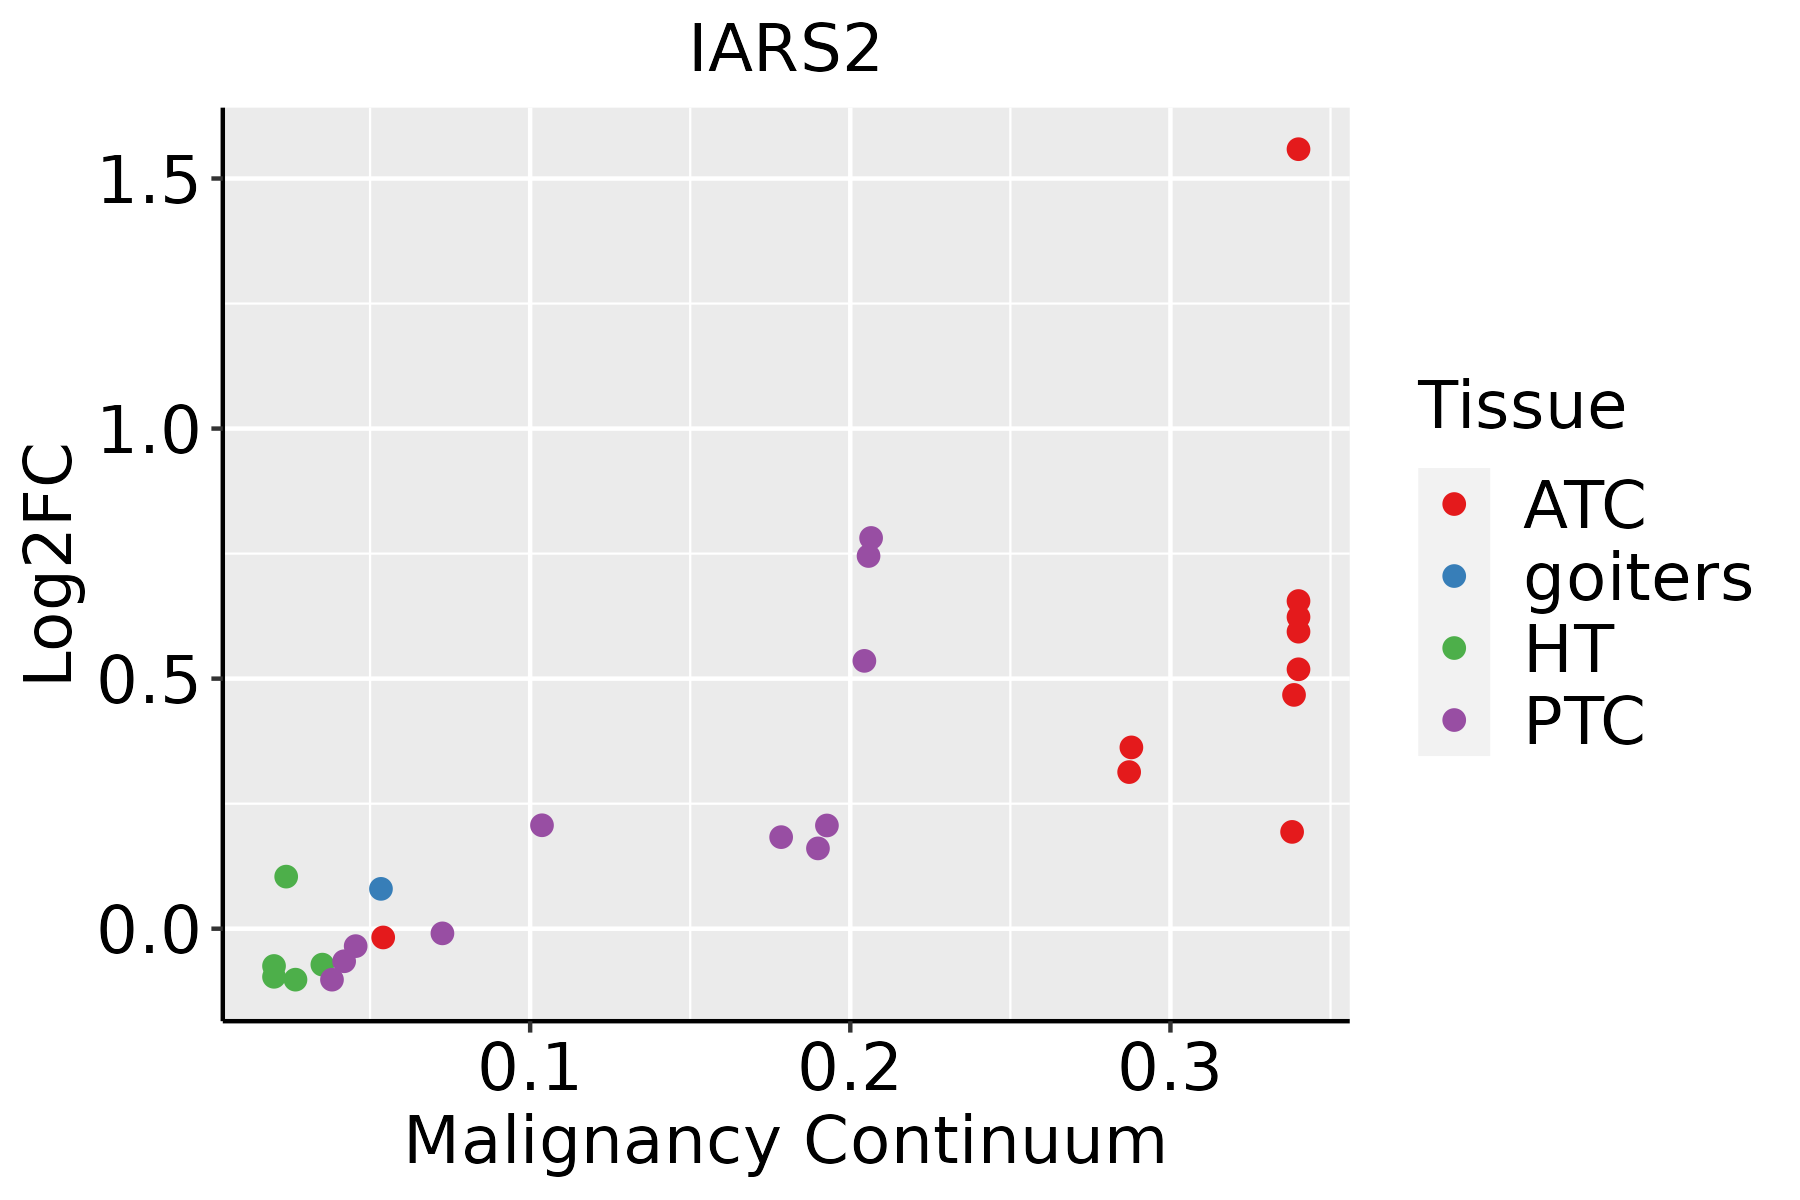 | ATC: Anaplastic thyroid cancer |
| HT: Hashimoto's thyroiditis | ||
| PTC: Papillary thyroid cancer |
| ∗log2FC in expression of this searched gene in stem-like cells from each diseased tissue sample relative to stem-like cells in normal samples in each tissue plotted against the malignancy continuum. Samples are colored based on if they are from different disease stage. |
Top |
Malignant transformation related pathway analysis |
| Find out the enriched GO biological processes and KEGG pathways involved in transition from healthy to precancer to cancer |
| Tissue | Disease Stage | Enriched GO biological Processes |
| Colorectum | AD |  |
| Colorectum | SER |  |
| Colorectum | MSS |  |
| Colorectum | MSI-H |  |
| Colorectum | FAP |  |
| ∗Top 15 enriched GO BP terms are showed in the bar plot of each disease state in each tissue. Each row represents a significant GO biological process which is colored according to the -log10(p.adjust). |
| Page: 1 2 3 4 5 6 7 8 9 |
| GO ID | Tissue | Disease Stage | Description | Gene Ratio | Bg Ratio | pvalue | p.adjust | Count |
| GO:0006418 | Colorectum | AD | tRNA aminoacylation for protein translation | 19/3918 | 41/18723 | 2.37e-04 | 3.03e-03 | 19 |
| GO:0043039 | Colorectum | AD | tRNA aminoacylation | 19/3918 | 44/18723 | 7.13e-04 | 7.21e-03 | 19 |
| GO:0043038 | Colorectum | AD | amino acid activation | 19/3918 | 45/18723 | 9.94e-04 | 9.28e-03 | 19 |
| GO:0006520 | Colorectum | AD | cellular amino acid metabolic process | 81/3918 | 284/18723 | 1.37e-03 | 1.19e-02 | 81 |
| GO:003466012 | Esophagus | ESCC | ncRNA metabolic process | 346/8552 | 485/18723 | 4.35e-31 | 2.51e-28 | 346 |
| GO:014005313 | Esophagus | ESCC | mitochondrial gene expression | 93/8552 | 108/18723 | 1.96e-18 | 2.03e-16 | 93 |
| GO:003254314 | Esophagus | ESCC | mitochondrial translation | 68/8552 | 76/18723 | 1.02e-15 | 6.86e-14 | 68 |
| GO:00063992 | Esophagus | ESCC | tRNA metabolic process | 122/8552 | 179/18723 | 9.03e-10 | 2.19e-08 | 122 |
| GO:00346603 | Liver | Cirrhotic | ncRNA metabolic process | 173/4634 | 485/18723 | 3.64e-08 | 1.21e-06 | 173 |
| GO:0032543 | Liver | Cirrhotic | mitochondrial translation | 40/4634 | 76/18723 | 1.61e-07 | 4.29e-06 | 40 |
| GO:0140053 | Liver | Cirrhotic | mitochondrial gene expression | 49/4634 | 108/18723 | 2.35e-06 | 4.31e-05 | 49 |
| GO:000652011 | Liver | Cirrhotic | cellular amino acid metabolic process | 103/4634 | 284/18723 | 8.88e-06 | 1.30e-04 | 103 |
| GO:00346601 | Liver | HCC | ncRNA metabolic process | 332/7958 | 485/18723 | 1.48e-31 | 7.80e-29 | 332 |
| GO:01400531 | Liver | HCC | mitochondrial gene expression | 82/7958 | 108/18723 | 1.49e-12 | 7.20e-11 | 82 |
| GO:00325431 | Liver | HCC | mitochondrial translation | 62/7958 | 76/18723 | 2.95e-12 | 1.34e-10 | 62 |
| GO:00065202 | Liver | HCC | cellular amino acid metabolic process | 167/7958 | 284/18723 | 1.91e-08 | 4.56e-07 | 167 |
| GO:0006399 | Liver | HCC | tRNA metabolic process | 108/7958 | 179/18723 | 1.07e-06 | 1.59e-05 | 108 |
| GO:00346605 | Oral cavity | OSCC | ncRNA metabolic process | 296/7305 | 485/18723 | 2.94e-23 | 6.65e-21 | 296 |
| GO:01400533 | Oral cavity | OSCC | mitochondrial gene expression | 78/7305 | 108/18723 | 2.37e-12 | 9.86e-11 | 78 |
| GO:00325434 | Oral cavity | OSCC | mitochondrial translation | 59/7305 | 76/18723 | 7.21e-12 | 2.70e-10 | 59 |
| Page: 1 2 |
| Pathway ID | Tissue | Disease Stage | Description | Gene Ratio | Bg Ratio | pvalue | p.adjust | qvalue | Count |
| Page: 1 |
Top |
Cell-cell communication analysis |
| Identification of potential cell-cell interactions between two cell types and their ligand-receptor pairs for different disease states |
| Ligand | Receptor | LRpair | Pathway | Tissue | Disease Stage |
| Page: 1 |
Top |
Single-cell gene regulatory network inference analysis |
| Find out the significant the regulons (TFs) and the target genes of each regulon across cell types for different disease states |
| TF | Cell Type | Tissue | Disease Stage | Target Gene | RSS | Regulon Activity |
| ∗The dot plots of a searched regulon are shown for all cell subpopulations in each disease state of each tissue based on the regulon specific score inferred using pySCENIC and by calculating the average expression. |
| Page: 1 |
Top |
Somatic mutation of malignant transformation related genes |
| Annotation of somatic variants for genes involved in malignant transformation |
| Hugo Symbol | Variant Class | Variant Classification | dbSNP RS | HGVSc | HGVSp | HGVSp Short | SWISSPROT | BIOTYPE | SIFT | PolyPhen | Tumor Sample Barcode | Tissue | Histology | Sex | Age | Stage | Therapy Types | Drugs | Outcome |
| IARS2 | SNV | Missense_Mutation | rs539149720 | c.2350C>T | p.Arg784Trp | p.R784W | Q9NSE4 | protein_coding | deleterious(0) | probably_damaging(0.993) | TCGA-AN-A046-01 | Breast | breast invasive carcinoma | Female | >=65 | I/II | Unknown | Unknown | SD |
| IARS2 | SNV | Missense_Mutation | c.2498C>A | p.Ser833Tyr | p.S833Y | Q9NSE4 | protein_coding | deleterious(0) | probably_damaging(0.961) | TCGA-AN-A046-01 | Breast | breast invasive carcinoma | Female | >=65 | I/II | Unknown | Unknown | SD | |
| IARS2 | SNV | Missense_Mutation | c.2714N>A | p.Thr905Asn | p.T905N | Q9NSE4 | protein_coding | deleterious(0) | benign(0.01) | TCGA-AO-A0J2-01 | Breast | breast invasive carcinoma | Female | <65 | I/II | Chemotherapy | cyclophosphamide | SD | |
| IARS2 | SNV | Missense_Mutation | rs146618526 | c.2450G>A | p.Arg817His | p.R817H | Q9NSE4 | protein_coding | deleterious(0) | probably_damaging(1) | TCGA-OL-A5S0-01 | Breast | breast invasive carcinoma | Female | >=65 | I/II | Chemotherapy | taxol | CR |
| IARS2 | SNV | Missense_Mutation | novel | c.2950A>G | p.Lys984Glu | p.K984E | Q9NSE4 | protein_coding | tolerated(0.25) | benign(0.138) | TCGA-2W-A8YY-01 | Cervix | cervical & endocervical cancer | Female | <65 | I/II | Chemotherapy | cisplatin | CR |
| IARS2 | SNV | Missense_Mutation | c.674N>C | p.Arg225Thr | p.R225T | Q9NSE4 | protein_coding | tolerated(0.46) | benign(0.396) | TCGA-EK-A2RJ-01 | Cervix | cervical & endocervical cancer | Female | <65 | I/II | Unknown | Unknown | SD | |
| IARS2 | SNV | Missense_Mutation | c.1705N>A | p.Pro569Thr | p.P569T | Q9NSE4 | protein_coding | deleterious(0.05) | probably_damaging(0.974) | TCGA-A6-2677-01 | Colorectum | colon adenocarcinoma | Female | >=65 | III/IV | Ancillary | leucovorin | SD | |
| IARS2 | SNV | Missense_Mutation | rs759787338 | c.1549N>T | p.Arg517Trp | p.R517W | Q9NSE4 | protein_coding | deleterious(0) | probably_damaging(1) | TCGA-A6-5656-01 | Colorectum | colon adenocarcinoma | Male | >=65 | I/II | Unknown | Unknown | SD |
| IARS2 | SNV | Missense_Mutation | c.1513T>G | p.Ser505Ala | p.S505A | Q9NSE4 | protein_coding | tolerated(0.26) | benign(0.02) | TCGA-A6-5665-01 | Colorectum | colon adenocarcinoma | Female | >=65 | I/II | Unknown | Unknown | PD | |
| IARS2 | SNV | Missense_Mutation | c.560N>C | p.Phe187Ser | p.F187S | Q9NSE4 | protein_coding | deleterious(0) | probably_damaging(1) | TCGA-AA-3663-01 | Colorectum | colon adenocarcinoma | Male | <65 | I/II | Unknown | Unknown | SD |
| Page: 1 2 3 4 5 6 7 8 9 10 11 12 |
Top |
Related drugs of malignant transformation related genes |
| Identification of chemicals and drugs interact with genes involved in malignant transfromation |
| (DGIdb 4.0) |
| Entrez ID | Symbol | Category | Interaction Types | Drug Claim Name | Drug Name | PMIDs |
| Page: 1 |

Copyright 2023-Present -The University of Texas Health Science Center at Houston |