Schematic overview of the cellular and molecular mechanisms involved in the cancer progression, including the proposed cellular and molecular mechanisms in cancer cells trajectory. AT1: alveolar type 1 cells; AT2: alveolar type 2 cells; AAH: atypical adenomatous hyperplasia; AIS: adenocarcinoma in situ; MIA: minimally invasive adenocarcinoma; IA: invasive adenocarcinoma; EMT: epithelial-mesenchymal transition

Home

Download

Statistics

Help

Contact

Center for Computational Systems Medicine
leaf

Gene summary

leaf

Malignant transformation analysis

leaf

Malignant transformation related pathway analysis

leaf

Cell-cell communication analysis

leaf

Single-cell gene regulatory network inference analysis

leaf

Somatic mutation of malignant transformation related genes

leaf

Related drugs of malignant transformation related genes

Gene: IAH1

Gene summary for IAH1

check button Gene summary.

Gene informationSpeciesHuman
Gene symbol

IAH1

Gene ID

285148

Gene nameisoamyl acetate hydrolyzing esterase 1 (putative)
Gene AliasIAH1
Cytomap2p25.1
Gene Typeprotein-coding
GO ID

GO:0006629

UniProtAcc

A0A140VJL6


Top

Malignant transformation analysis

check button Identification of the aberrant gene expression in precancerous and cancerous lesions by comparing the gene expression of stem-like cells in diseased tissues with normal stem cells
check button Malignant transformation involving gene list.
Entrez IDSymbolReplicatesSpeciesOrganTissueAdj P-valueLog2FCMalignancy
285148IAH1LZE2DHumanEsophagusHGIN3.88e-022.73e-010.0642
285148IAH1LZE2THumanEsophagusESCC4.58e-047.12e-010.082
285148IAH1LZE4THumanEsophagusESCC1.17e-205.76e-010.0811
285148IAH1LZE7THumanEsophagusESCC6.82e-137.63e-010.0667
285148IAH1LZE8THumanEsophagusESCC5.52e-063.38e-010.067
285148IAH1LZE20THumanEsophagusESCC4.15e-021.35e-010.0662
285148IAH1LZE24THumanEsophagusESCC6.17e-206.08e-010.0596
285148IAH1LZE6THumanEsophagusESCC1.16e-189.13e-010.0845
285148IAH1P1T-EHumanEsophagusESCC1.67e-074.80e-010.0875
285148IAH1P2T-EHumanEsophagusESCC6.44e-438.78e-010.1177
285148IAH1P4T-EHumanEsophagusESCC8.57e-551.14e+000.1323
285148IAH1P5T-EHumanEsophagusESCC6.20e-451.04e+000.1327
285148IAH1P8T-EHumanEsophagusESCC3.71e-235.04e-010.0889
285148IAH1P9T-EHumanEsophagusESCC5.37e-307.82e-010.1131
285148IAH1P10T-EHumanEsophagusESCC5.56e-761.39e+000.116
285148IAH1P11T-EHumanEsophagusESCC8.04e-281.28e+000.1426
285148IAH1P12T-EHumanEsophagusESCC2.25e-731.30e+000.1122
285148IAH1P15T-EHumanEsophagusESCC8.32e-206.24e-010.1149
285148IAH1P16T-EHumanEsophagusESCC2.44e-406.52e-010.1153
285148IAH1P17T-EHumanEsophagusESCC3.97e-115.52e-010.1278
Page: 1 2 3 4 5 6 7 

check button Transcriptomic changes along malignancy continuum.
TissueExpression DynamicsAbbreviation
EsophagusThe image shows the transcriptomic changes along malignancy continuum.log2FC in expression of this searched gene in stem-like cells from each diseased tissue sample relative to stem-like cells in normal samples in each tissue plotted against the malignancy continuum. Samples are colored based on if they are from different disease stage.
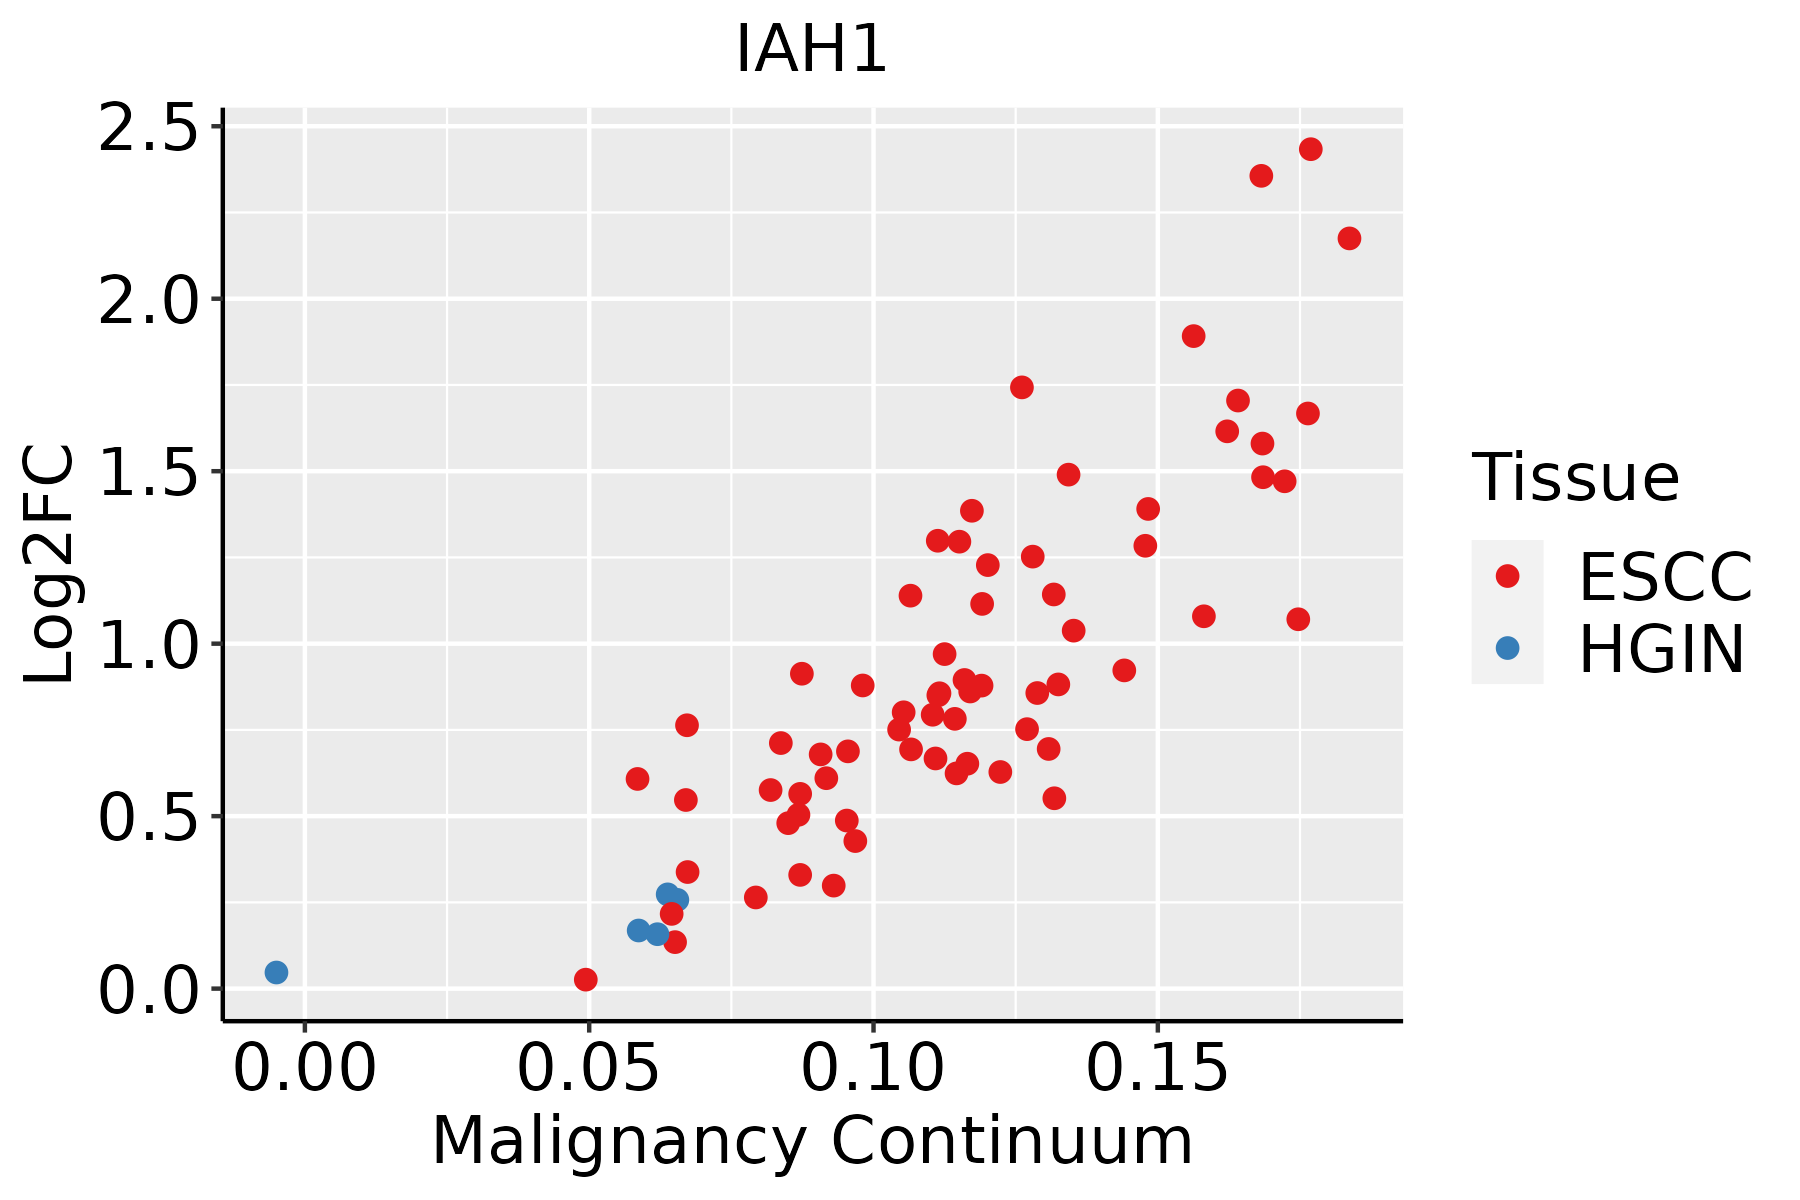
ESCC: Esophageal squamous cell carcinoma
HGIN: High-grade intraepithelial neoplasias
LGIN: Low-grade intraepithelial neoplasias
LiverThe image shows the transcriptomic changes along malignancy continuum.log2FC in expression of this searched gene in stem-like cells from each diseased tissue sample relative to stem-like cells in normal samples in each tissue plotted against the malignancy continuum. Samples are colored based on if they are from different disease stage.HCC: Hepatocellular carcinoma
NAFLD: Non-alcoholic fatty liver disease
Oral CavityThe image shows the transcriptomic changes along malignancy continuum.log2FC in expression of this searched gene in stem-like cells from each diseased tissue sample relative to stem-like cells in normal samples in each tissue plotted against the malignancy continuum. Samples are colored based on if they are from different disease stage.
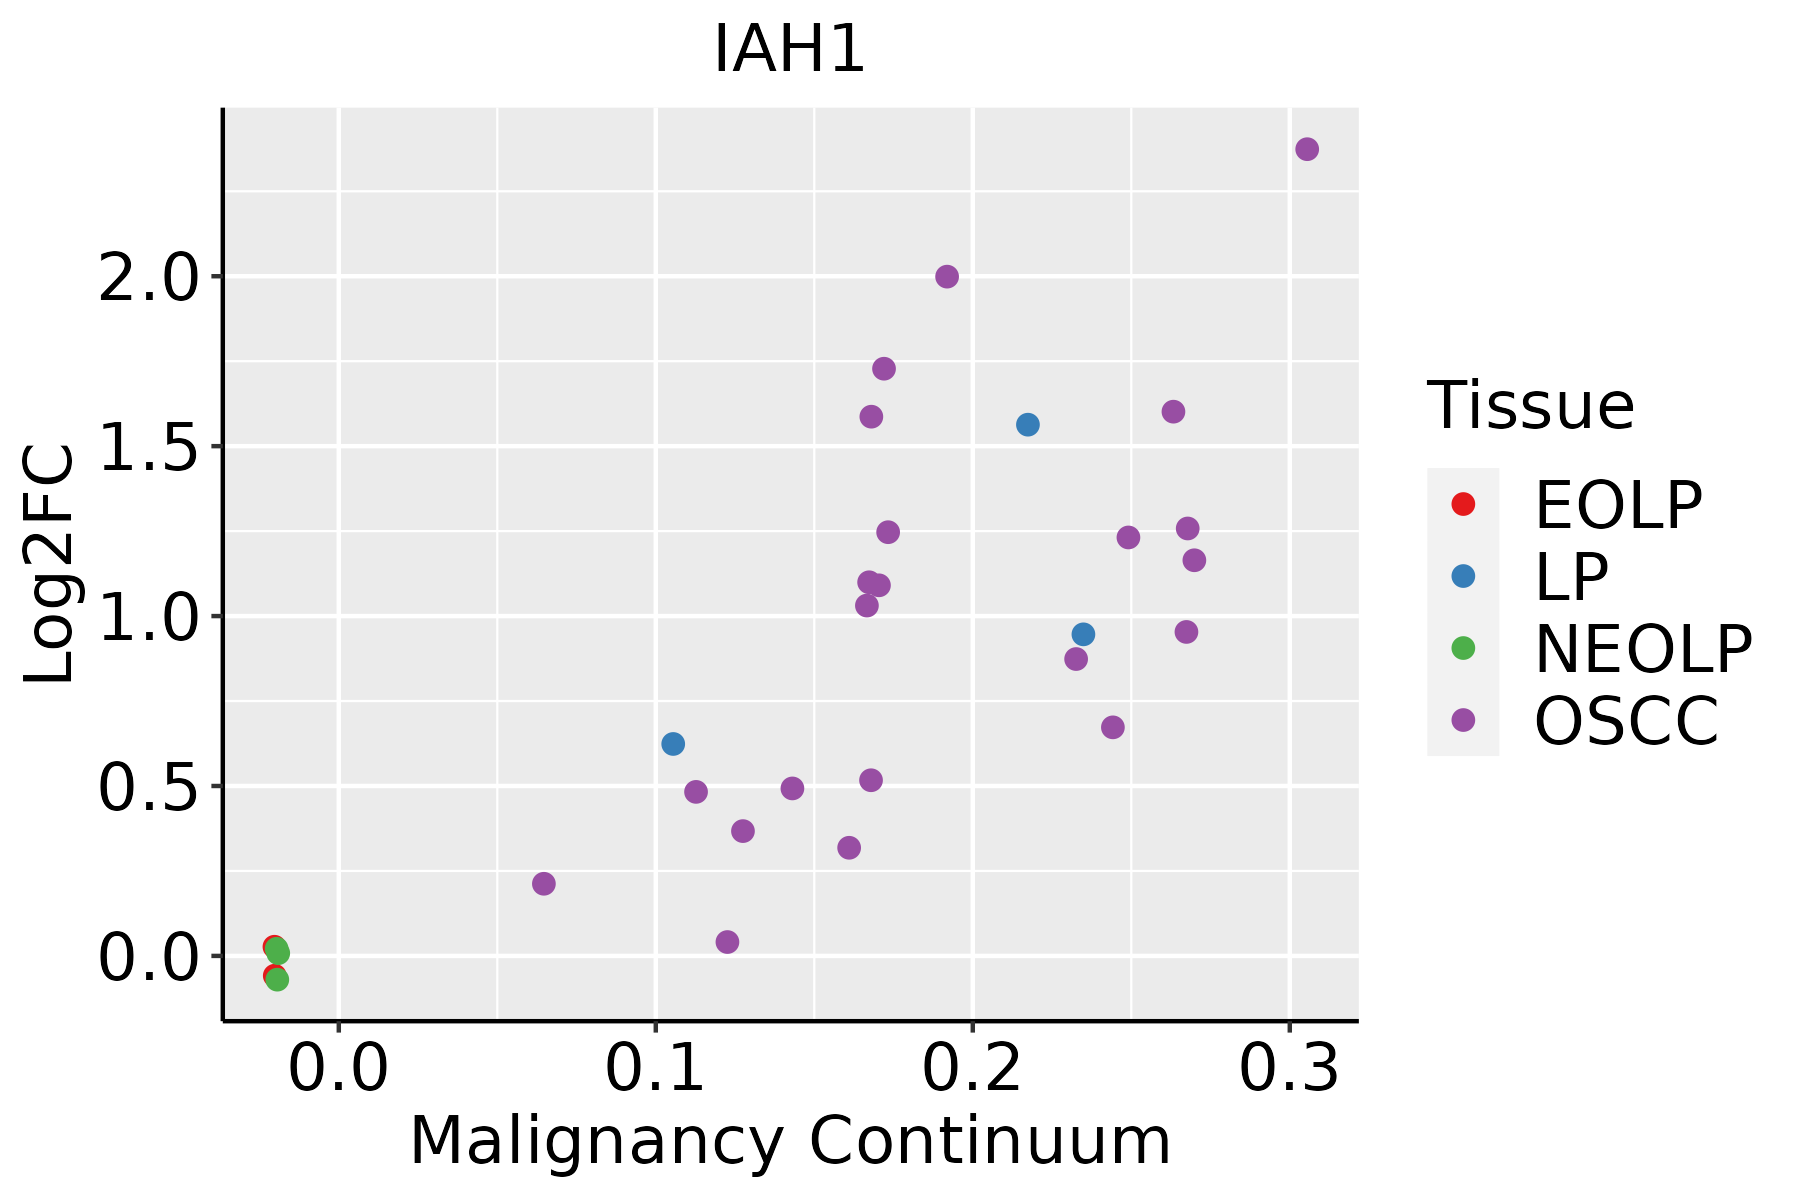
EOLP: Erosive Oral lichen planus
LP: leukoplakia
NEOLP: Non-erosive oral lichen planus
OSCC: Oral squamous cell carcinoma
SkinThe image shows the transcriptomic changes along malignancy continuum.log2FC in expression of this searched gene in stem-like cells from each diseased tissue sample relative to stem-like cells in normal samples in each tissue plotted against the malignancy continuum. Samples are colored based on if they are from different disease stage.
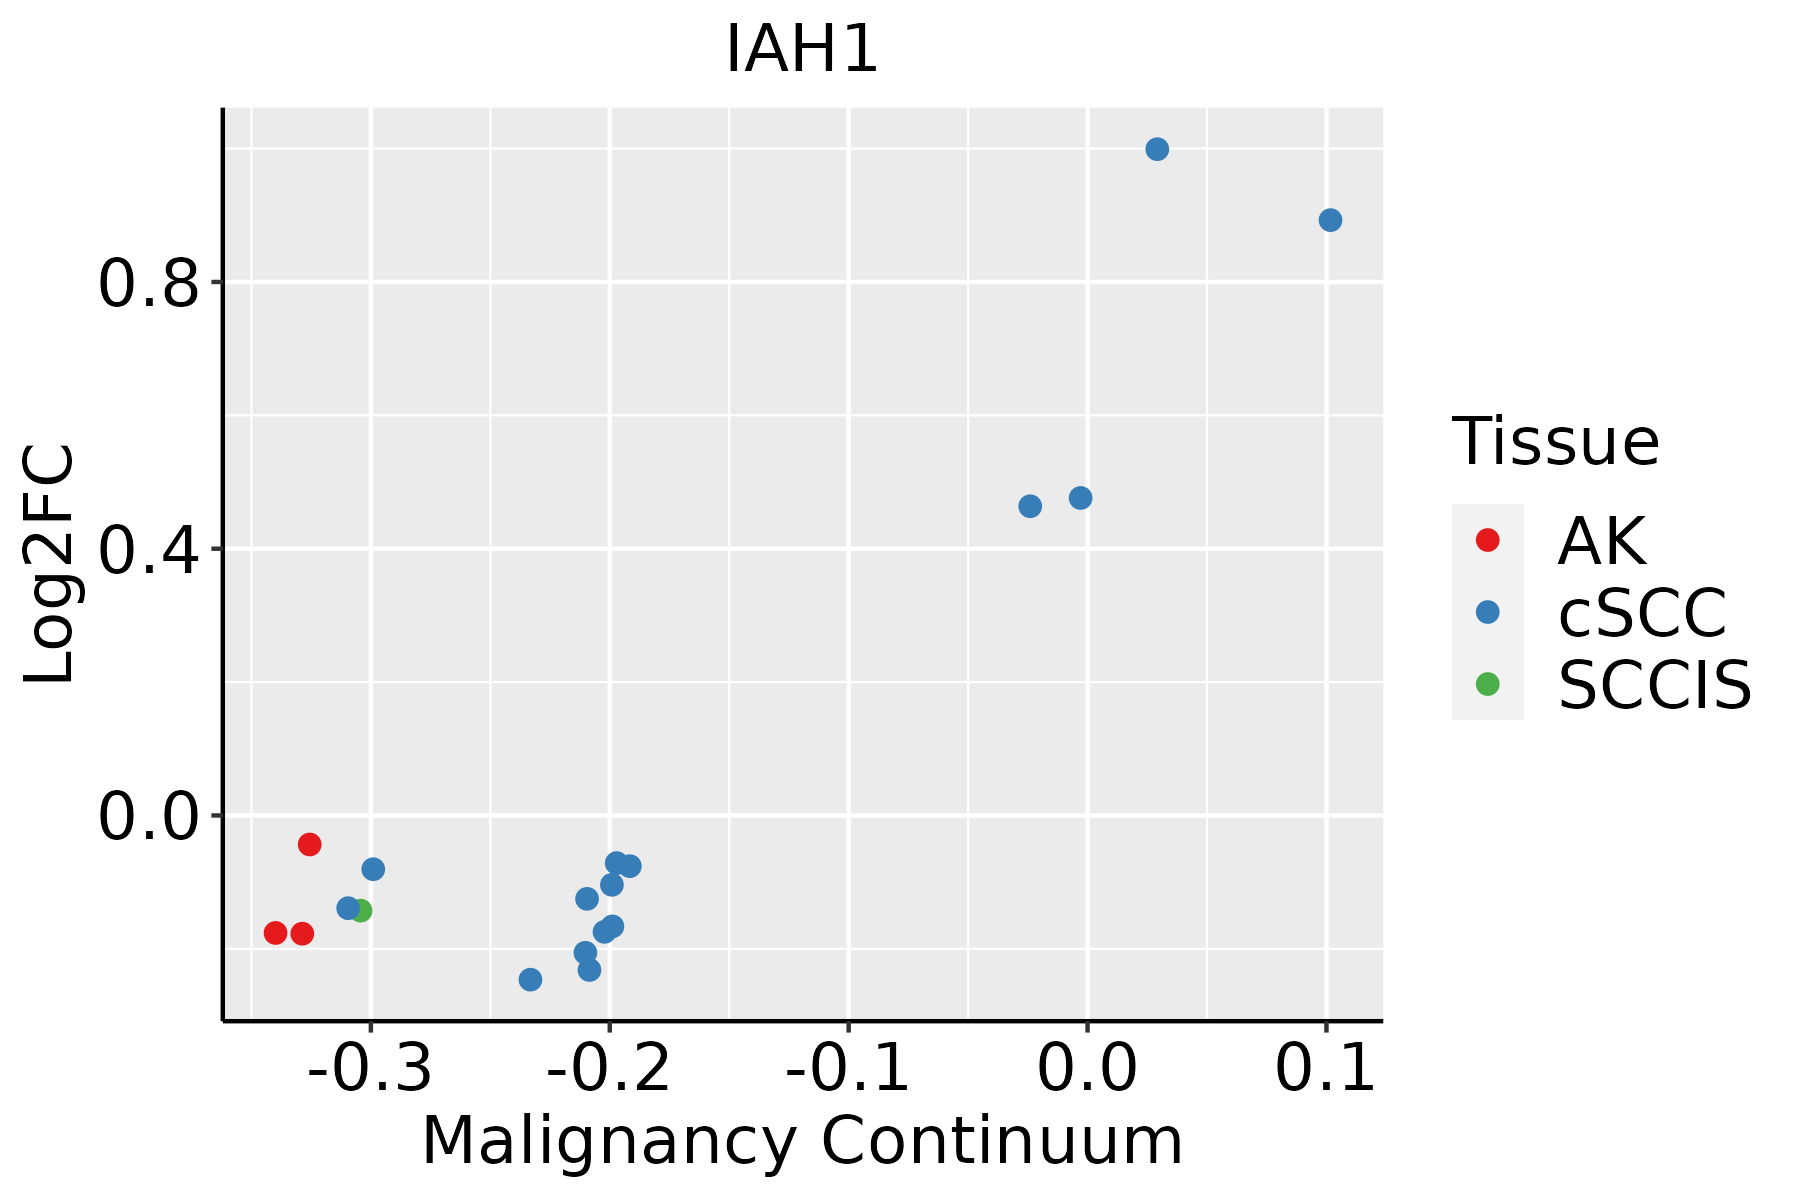
AK: Actinic keratosis
cSCC: Cutaneous squamous cell carcinoma
SCCIS:squamous cell carcinoma in situ
ThyroidThe image shows the transcriptomic changes along malignancy continuum.log2FC in expression of this searched gene in stem-like cells from each diseased tissue sample relative to stem-like cells in normal samples in each tissue plotted against the malignancy continuum. Samples are colored based on if they are from different disease stage.
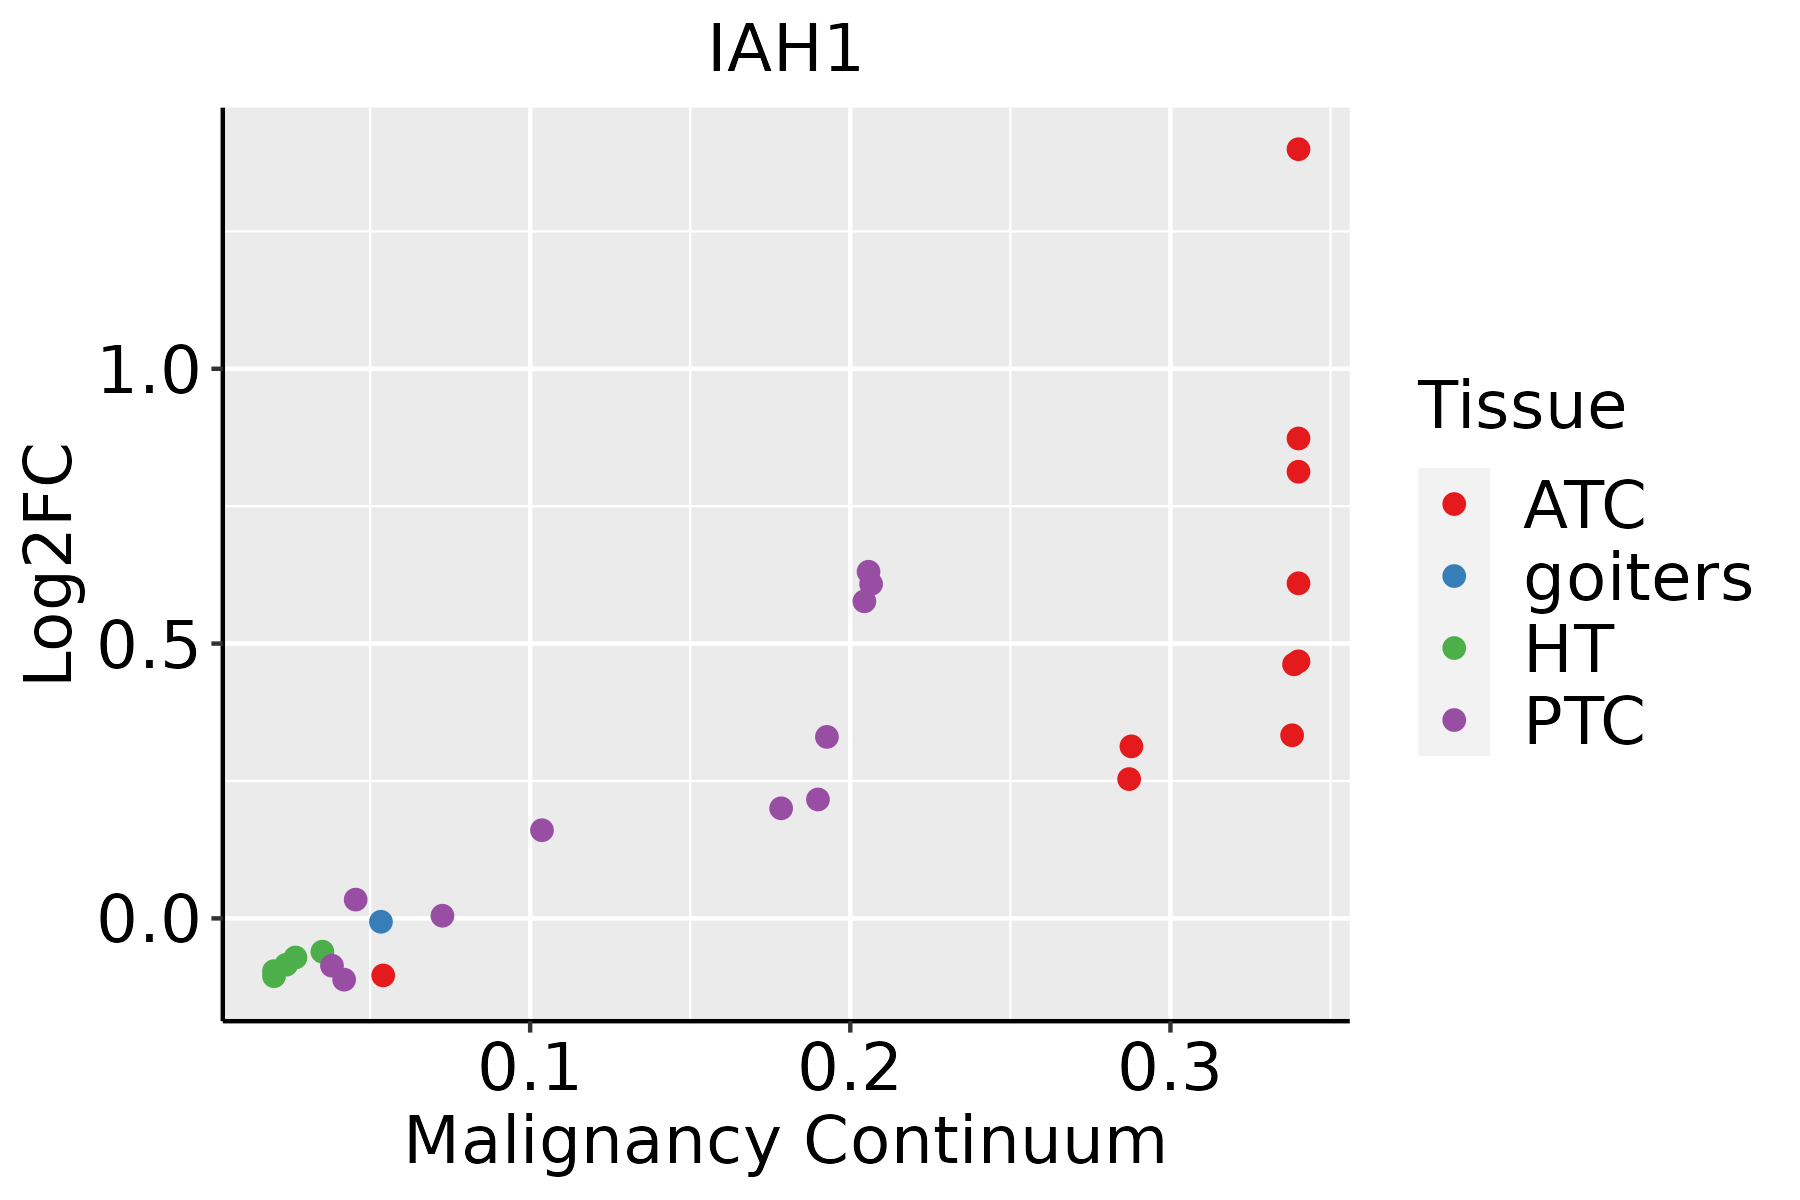
ATC: Anaplastic thyroid cancer
HT: Hashimoto's thyroiditis
PTC: Papillary thyroid cancer
∗log2FC in expression of this searched gene in stem-like cells from each diseased tissue sample relative to stem-like cells in normal samples in each tissue plotted against the malignancy continuum. Samples are colored based on if they are from different disease stage.

Top

Malignant transformation related pathway analysis

check buttonFind out the enriched GO biological processes and KEGG pathways involved in transition from healthy to precancer to cancer
check button Figure of enriched GO biological processes.
TissueDisease StageEnriched GO biological Processes
ColorectumADGO analysis - Figure of enriched GO biological processes: Top 15 enriched GO BP terms are showed in the bar plot of each disease state in each tissue. Each row represents a significant GO biological process which is colored according to the -log10(p.adjust).
ColorectumSERGO analysis - Figure of enriched GO biological processes: Top 15 enriched GO BP terms are showed in the bar plot of each disease state in each tissue. Each row represents a significant GO biological process which is colored according to the -log10(p.adjust).
ColorectumMSSGO analysis - Figure of enriched GO biological processes: Top 15 enriched GO BP terms are showed in the bar plot of each disease state in each tissue. Each row represents a significant GO biological process which is colored according to the -log10(p.adjust).
ColorectumMSI-HGO analysis - Figure of enriched GO biological processes: Top 15 enriched GO BP terms are showed in the bar plot of each disease state in each tissue. Each row represents a significant GO biological process which is colored according to the -log10(p.adjust).
ColorectumFAPGO analysis - Figure of enriched GO biological processes: Top 15 enriched GO BP terms are showed in the bar plot of each disease state in each tissue. Each row represents a significant GO biological process which is colored according to the -log10(p.adjust).
∗Top 15 enriched GO BP terms are showed in the bar plot of each disease state in each tissue. Each row represents a significant GO biological process which is colored according to the -log10(p.adjust).
Page: 1 2 3 4 5 6 7 8 9 

check button Enriched GO biological processes.
GO IDTissueDisease StageDescriptionGene RatioBg Ratiopvaluep.adjustCount
GO:001049826EsophagusHGINproteasomal protein catabolic process139/2587490/187231.20e-173.41e-15139
GO:003164727EsophagusHGINregulation of protein stability96/2587298/187232.21e-165.76e-1496
GO:009719327EsophagusHGINintrinsic apoptotic signaling pathway90/2587288/187231.50e-142.80e-1290
GO:004316126EsophagusHGINproteasome-mediated ubiquitin-dependent protein catabolic process114/2587412/187237.00e-141.20e-11114
GO:200124227EsophagusHGINregulation of intrinsic apoptotic signaling pathway58/2587164/187232.57e-123.58e-1058
GO:200123327EsophagusHGINregulation of apoptotic signaling pathway97/2587356/187231.36e-111.57e-0997
GO:200124410EsophagusHGINpositive regulation of intrinsic apoptotic signaling pathway25/258758/187234.91e-082.75e-0625
GO:200123519EsophagusHGINpositive regulation of apoptotic signaling pathway41/2587126/187236.06e-083.22e-0641
GO:007099727EsophagusHGINneuron death81/2587361/187235.01e-061.61e-0481
GO:199000010EsophagusHGINamyloid fibril formation13/258734/187233.51e-045.65e-0313
GO:005140219EsophagusHGINneuron apoptotic process52/2587246/187231.01e-031.26e-0252
GO:0010498111EsophagusESCCproteasomal protein catabolic process369/8552490/187231.13e-411.80e-38369
GO:0043161111EsophagusESCCproteasome-mediated ubiquitin-dependent protein catabolic process312/8552412/187233.53e-364.48e-33312
GO:0097193111EsophagusESCCintrinsic apoptotic signaling pathway222/8552288/187235.87e-282.02e-25222
GO:0031647111EsophagusESCCregulation of protein stability223/8552298/187235.76e-251.52e-22223
GO:2001233111EsophagusESCCregulation of apoptotic signaling pathway256/8552356/187234.11e-241.04e-21256
GO:2001242111EsophagusESCCregulation of intrinsic apoptotic signaling pathway128/8552164/187231.75e-171.50e-15128
GO:2001235110EsophagusESCCpositive regulation of apoptotic signaling pathway92/8552126/187233.91e-101.05e-0892
GO:0070997111EsophagusESCCneuron death216/8552361/187233.49e-086.45e-07216
GO:0051402110EsophagusESCCneuron apoptotic process148/8552246/187233.08e-063.47e-05148
Page: 1 2 3 4 5 

check button Enriched KEGG pathways.
Pathway IDTissueDisease StageDescriptionGene RatioBg Ratiopvaluep.adjustqvalueCount
Page: 1 

Top

Cell-cell communication analysis

check buttonIdentification of potential cell-cell interactions between two cell types and their ligand-receptor pairs for different disease states
LigandReceptorLRpairPathwayTissueDisease Stage
Page: 1 

Top

Single-cell gene regulatory network inference analysis

check buttonFind out the significant the regulons (TFs) and the target genes of each regulon across cell types for different disease states
TFCell TypeTissueDisease StageTarget GeneRSSRegulon Activity
∗The dot plots of a searched regulon are shown for all cell subpopulations in each disease state of each tissue based on the regulon specific score inferred using pySCENIC and by calculating the average expression.
Page: 1 

Top

Somatic mutation of malignant transformation related genes

check buttonAnnotation of somatic variants for genes involved in malignant transformation
Hugo SymbolVariant ClassVariant ClassificationdbSNP RSHGVScHGVSpHGVSp ShortSWISSPROTBIOTYPESIFTPolyPhenTumor Sample BarcodeTissueHistologySexAgeStageTherapy TypesDrugsOutcome
IAH1SNVMissense_Mutationc.737N>Cp.Gly246Alap.G246AQ2TAA2protein_codingtolerated_low_confidence(0.08)possibly_damaging(0.714)TCGA-A8-A09I-01Breastbreast invasive carcinomaFemale>=65I/IIHormone TherapyanastrozoleSD
IAH1SNVMissense_Mutationc.199N>Tp.Pro67Serp.P67SQ2TAA2protein_codingdeleterious(0.01)probably_damaging(0.914)TCGA-EK-A2PM-01Cervixcervical & endocervical cancerFemale>=65I/IIUnknownUnknownSD
IAH1SNVMissense_Mutationc.255N>Ap.Phe85Leup.F85LQ2TAA2protein_codingdeleterious(0.03)possibly_damaging(0.863)TCGA-AA-A010-01Colorectumcolon adenocarcinomaFemale<65I/IIChemotherapyfolinicCR
IAH1SNVMissense_Mutationnovelc.523N>Gp.Thr175Alap.T175AQ2TAA2protein_codingtolerated(0.2)benign(0.009)TCGA-CA-6717-01Colorectumcolon adenocarcinomaMale<65I/IIChemotherapyoxaliplatinCR
IAH1SNVMissense_Mutationnovelc.691N>Tp.Arg231Trpp.R231WQ2TAA2protein_codingdeleterious(0.01)possibly_damaging(0.65)TCGA-A5-A0G2-01Endometriumuterine corpus endometrioid carcinomaFemale<65III/IVUnknownUnknownSD
IAH1SNVMissense_Mutationnovelc.645N>Tp.Leu215Phep.L215FQ2TAA2protein_codingtolerated(0.1)benign(0.066)TCGA-AJ-A3QS-01Endometriumuterine corpus endometrioid carcinomaFemale<65III/IVChemotherapycisplatinCR
IAH1SNVMissense_Mutationc.437N>Gp.Ile146Serp.I146SQ2TAA2protein_codingtolerated(0.49)benign(0.109)TCGA-AP-A056-01Endometriumuterine corpus endometrioid carcinomaFemale<65I/IIUnknownUnknownSD
IAH1SNVMissense_Mutationnovelc.634N>Ap.Leu212Ilep.L212IQ2TAA2protein_codingdeleterious(0.03)probably_damaging(0.936)TCGA-AP-A056-01Endometriumuterine corpus endometrioid carcinomaFemale<65I/IIUnknownUnknownSD
IAH1SNVMissense_Mutationnovelc.382G>Tp.Val128Phep.V128FQ2TAA2protein_codingdeleterious(0.02)possibly_damaging(0.701)TCGA-AP-A059-01Endometriumuterine corpus endometrioid carcinomaFemale>=65I/IIUnknownUnknownSD
IAH1SNVMissense_Mutationc.455N>Gp.Leu152Argp.L152RQ2TAA2protein_codingdeleterious(0.02)benign(0.056)TCGA-AX-A05Z-01Endometriumuterine corpus endometrioid carcinomaFemale<65III/IVChemotherapyadriamycinSD
Page: 1 2 

Top

Related drugs of malignant transformation related genes

check buttonIdentification of chemicals and drugs interact with genes involved in malignant transfromation
(DGIdb 4.0)
Entrez IDSymbolCategoryInteraction TypesDrug Claim NameDrug NamePMIDs
Page: 1