
|
|||||
|
 | |
| |
| |
| |
| |
| |
|
Gene: HYI |
Gene summary for HYI |
| Gene information | Species | Human | Gene symbol | HYI | Gene ID | 81888 |
| Gene name | hydroxypyruvate isomerase (putative) | |
| Gene Alias | HT036 | |
| Cytomap | 1p34.2 | |
| Gene Type | protein-coding | GO ID | GO:0006081 | UniProtAcc | Q5T013 |
Top |
Malignant transformation analysis |
| Identification of the aberrant gene expression in precancerous and cancerous lesions by comparing the gene expression of stem-like cells in diseased tissues with normal stem cells |
| Entrez ID | Symbol | Replicates | Species | Organ | Tissue | Adj P-value | Log2FC | Malignancy |
| 81888 | HYI | LZE4T | Human | Esophagus | ESCC | 4.05e-07 | 5.46e-02 | 0.0811 |
| 81888 | HYI | LZE5T | Human | Esophagus | ESCC | 9.38e-07 | 2.21e-01 | 0.0514 |
| 81888 | HYI | LZE20T | Human | Esophagus | ESCC | 1.49e-04 | 9.31e-02 | 0.0662 |
| 81888 | HYI | LZE22T | Human | Esophagus | ESCC | 2.95e-03 | 2.21e-01 | 0.068 |
| 81888 | HYI | LZE24T | Human | Esophagus | ESCC | 2.36e-12 | 3.33e-01 | 0.0596 |
| 81888 | HYI | LZE21T | Human | Esophagus | ESCC | 3.53e-08 | 1.54e-01 | 0.0655 |
| 81888 | HYI | P1T-E | Human | Esophagus | ESCC | 1.64e-07 | 4.74e-01 | 0.0875 |
| 81888 | HYI | P2T-E | Human | Esophagus | ESCC | 1.43e-33 | 6.33e-01 | 0.1177 |
| 81888 | HYI | P4T-E | Human | Esophagus | ESCC | 8.67e-25 | 4.32e-01 | 0.1323 |
| 81888 | HYI | P5T-E | Human | Esophagus | ESCC | 2.74e-22 | 1.46e-01 | 0.1327 |
| 81888 | HYI | P8T-E | Human | Esophagus | ESCC | 2.93e-26 | 5.18e-01 | 0.0889 |
| 81888 | HYI | P9T-E | Human | Esophagus | ESCC | 4.24e-19 | 2.40e-01 | 0.1131 |
| 81888 | HYI | P10T-E | Human | Esophagus | ESCC | 8.21e-45 | 9.27e-01 | 0.116 |
| 81888 | HYI | P11T-E | Human | Esophagus | ESCC | 5.67e-10 | 6.88e-01 | 0.1426 |
| 81888 | HYI | P12T-E | Human | Esophagus | ESCC | 3.08e-31 | 7.81e-01 | 0.1122 |
| 81888 | HYI | P15T-E | Human | Esophagus | ESCC | 1.53e-17 | 3.13e-01 | 0.1149 |
| 81888 | HYI | P16T-E | Human | Esophagus | ESCC | 4.29e-32 | 5.69e-01 | 0.1153 |
| 81888 | HYI | P17T-E | Human | Esophagus | ESCC | 2.48e-21 | 1.12e+00 | 0.1278 |
| 81888 | HYI | P19T-E | Human | Esophagus | ESCC | 1.80e-12 | 1.58e+00 | 0.1662 |
| 81888 | HYI | P20T-E | Human | Esophagus | ESCC | 4.04e-19 | 3.36e-01 | 0.1124 |
| Page: 1 2 3 4 5 6 |
| Tissue | Expression Dynamics | Abbreviation |
| Esophagus | 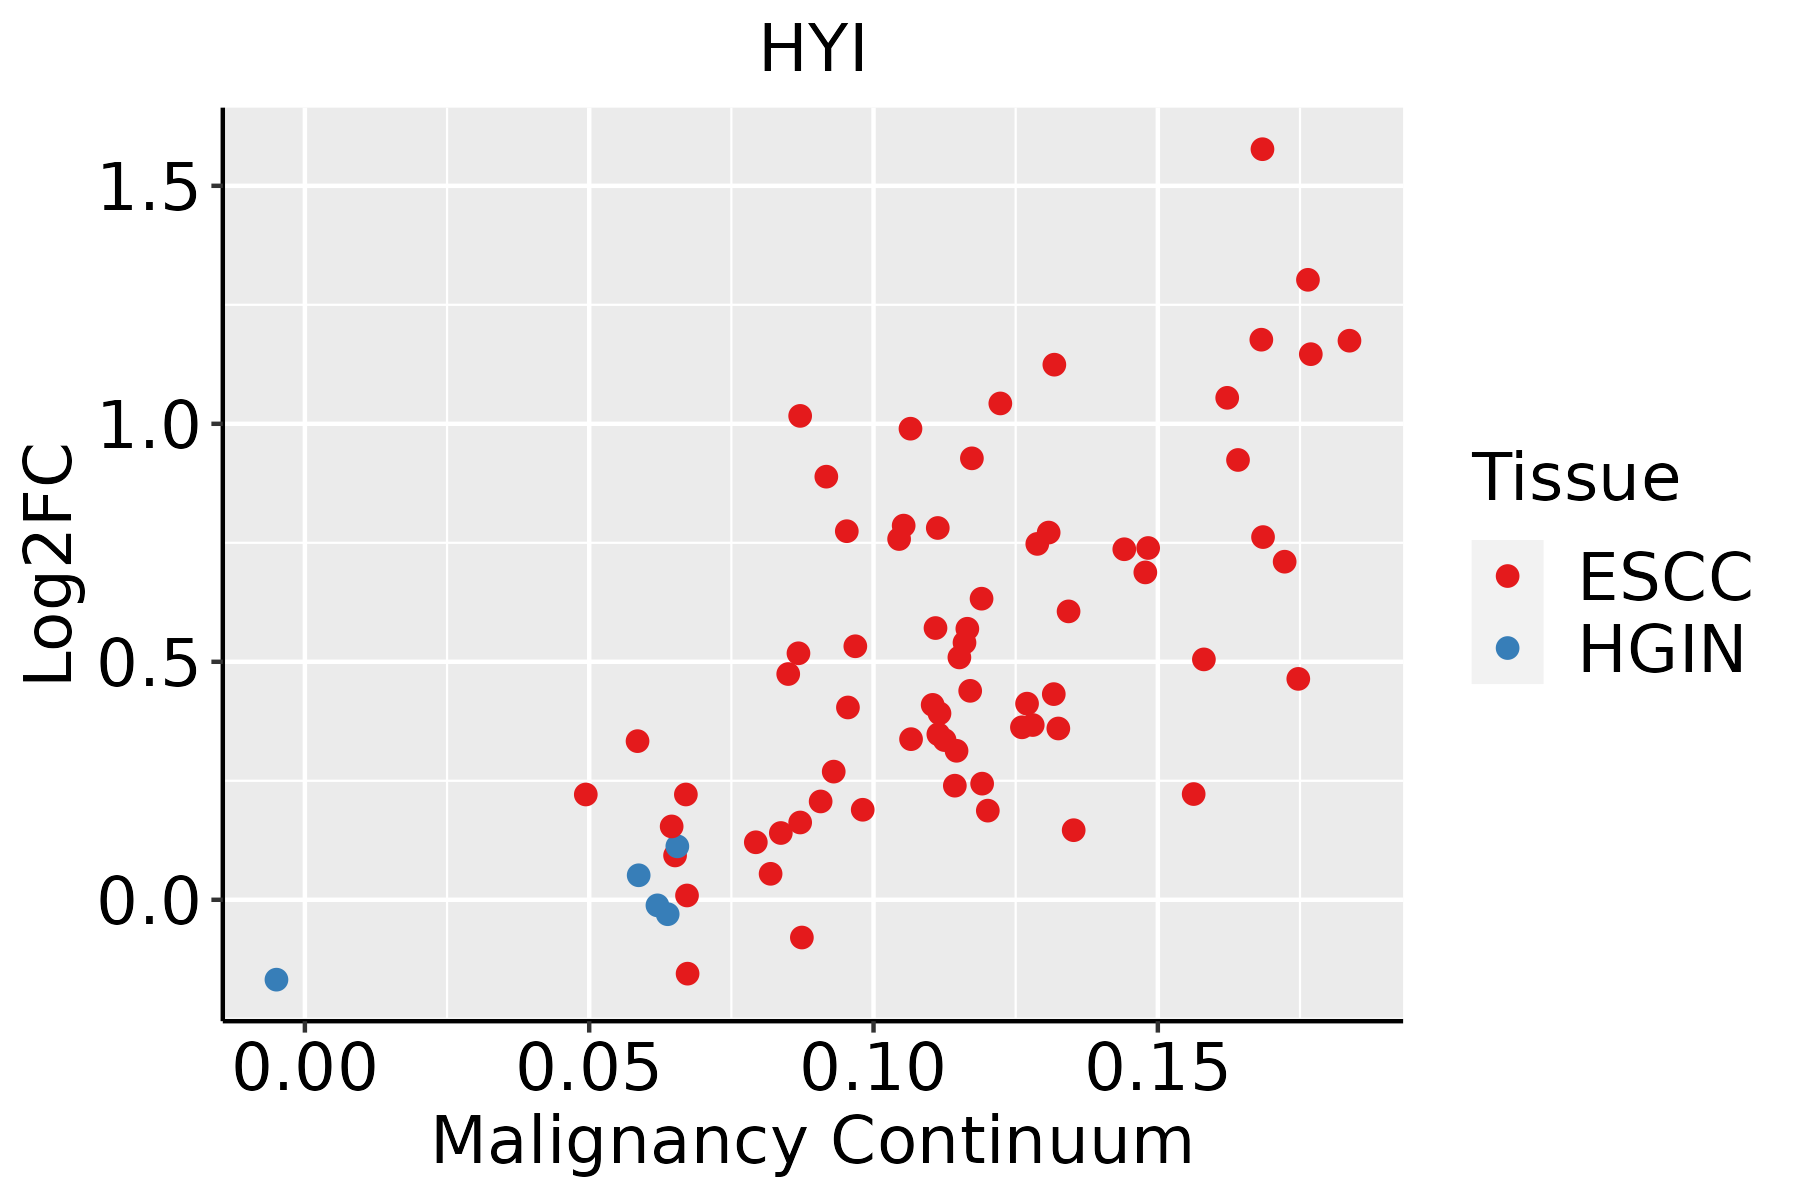 | ESCC: Esophageal squamous cell carcinoma |
| HGIN: High-grade intraepithelial neoplasias | ||
| LGIN: Low-grade intraepithelial neoplasias | ||
| Liver |  | HCC: Hepatocellular carcinoma |
| NAFLD: Non-alcoholic fatty liver disease | ||
| Oral Cavity | 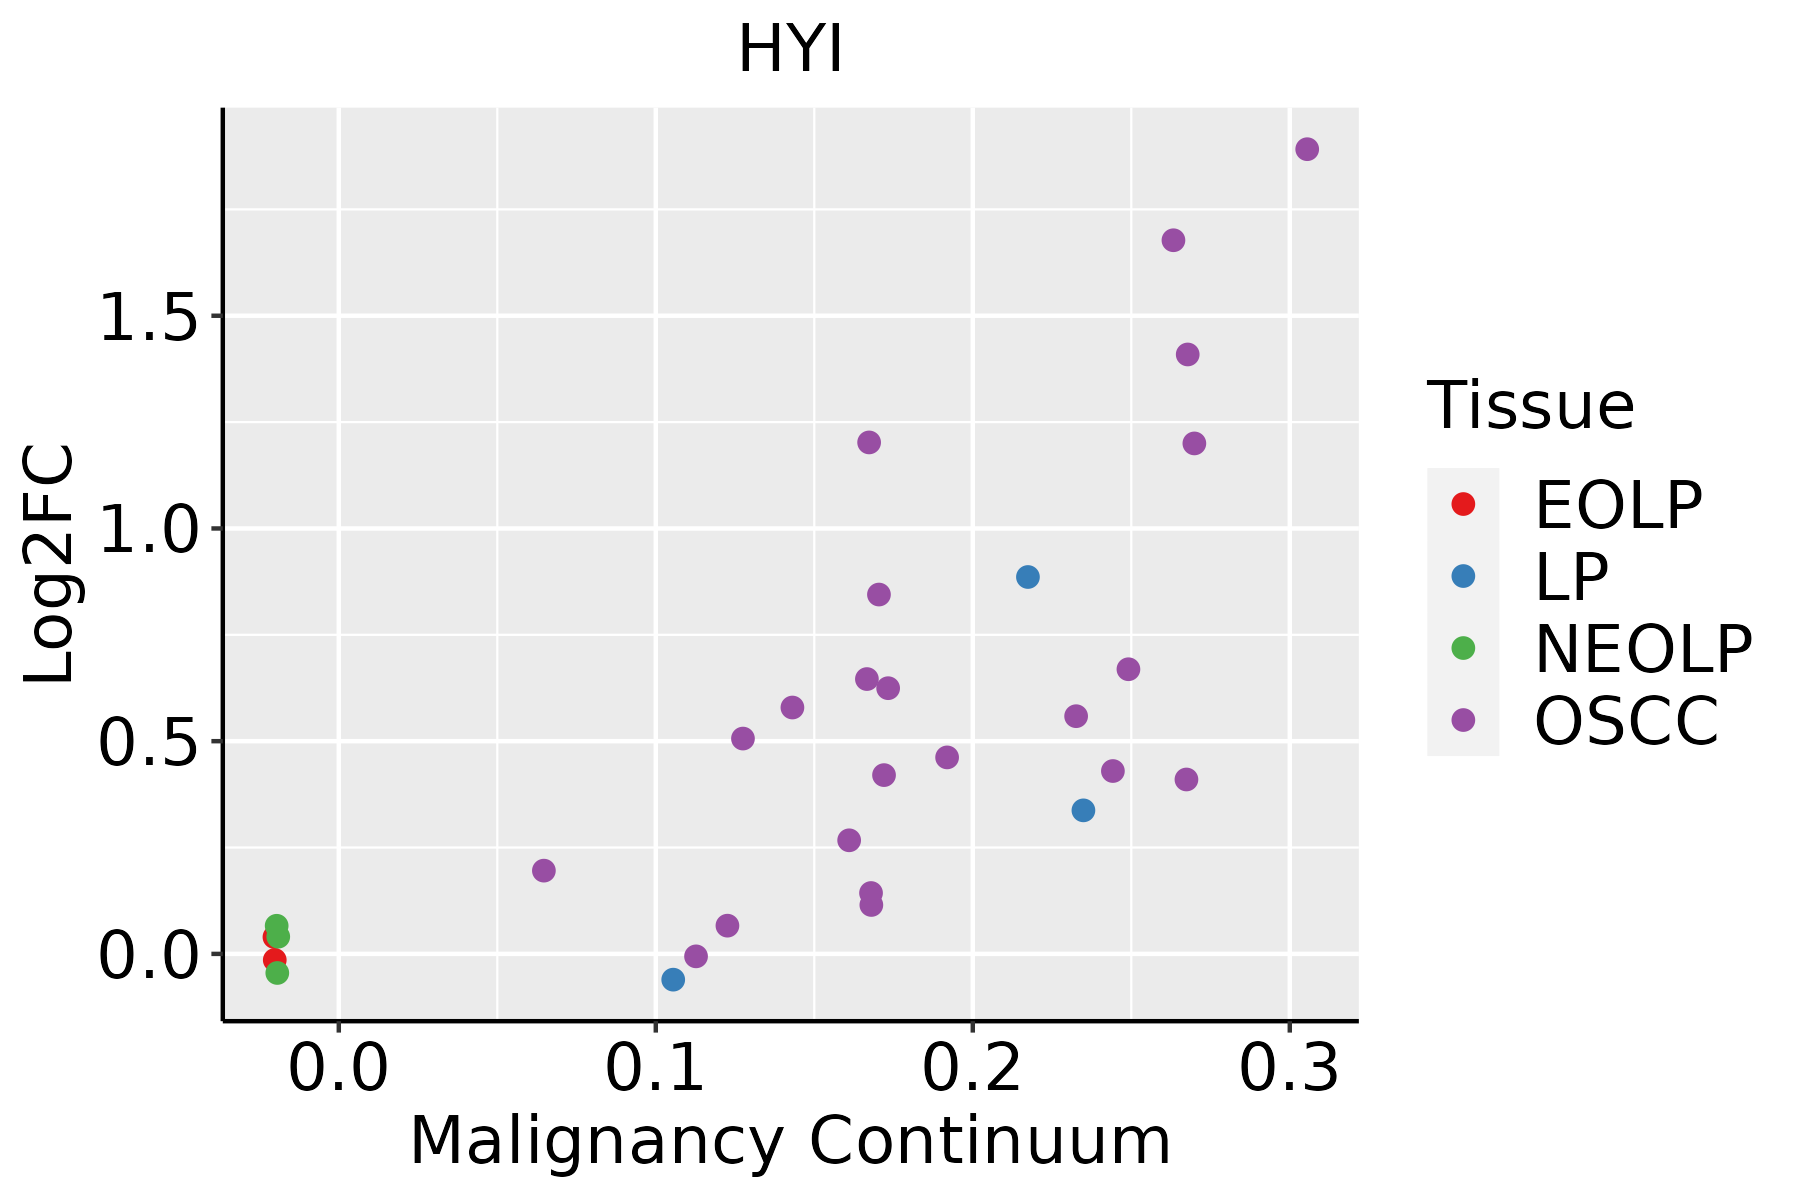 | EOLP: Erosive Oral lichen planus |
| LP: leukoplakia | ||
| NEOLP: Non-erosive oral lichen planus | ||
| OSCC: Oral squamous cell carcinoma | ||
| Prostate | 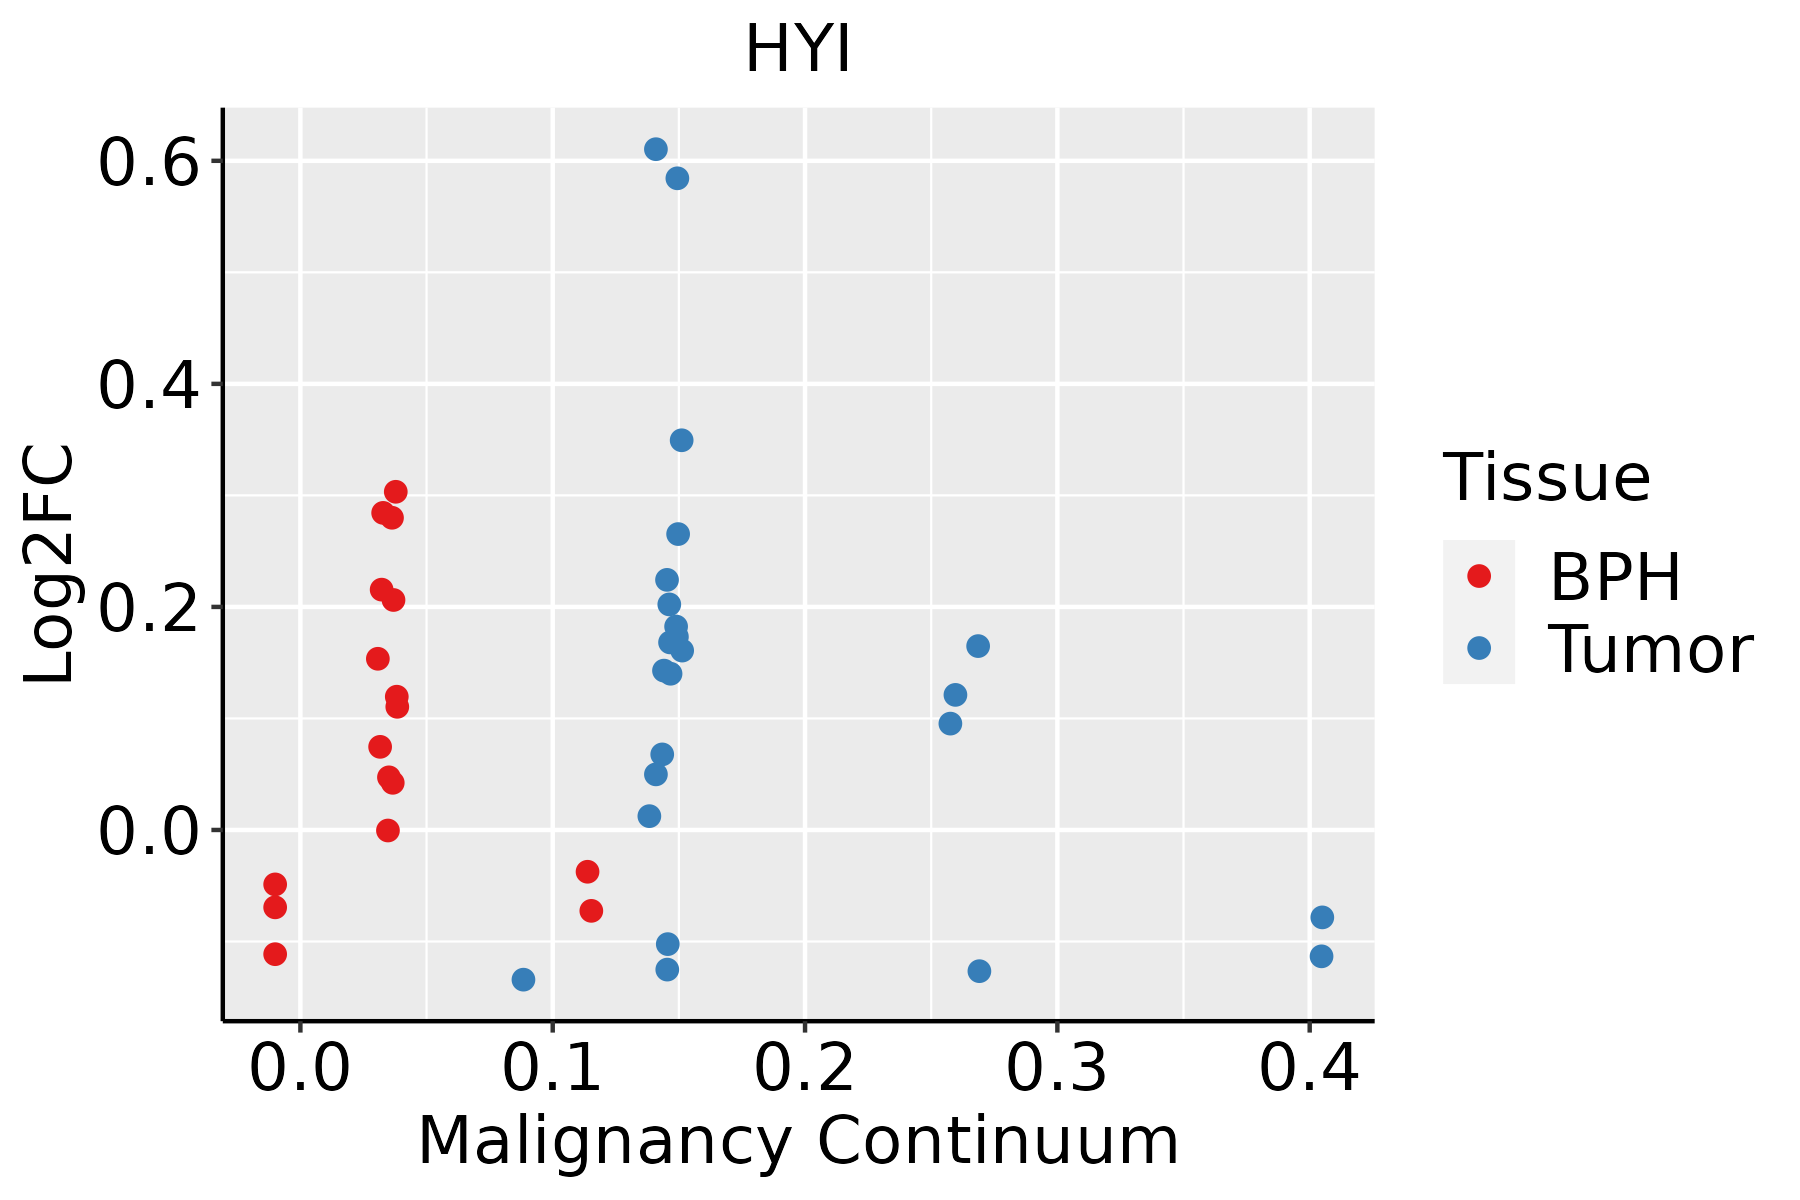 | BPH: Benign Prostatic Hyperplasia |
| Skin | 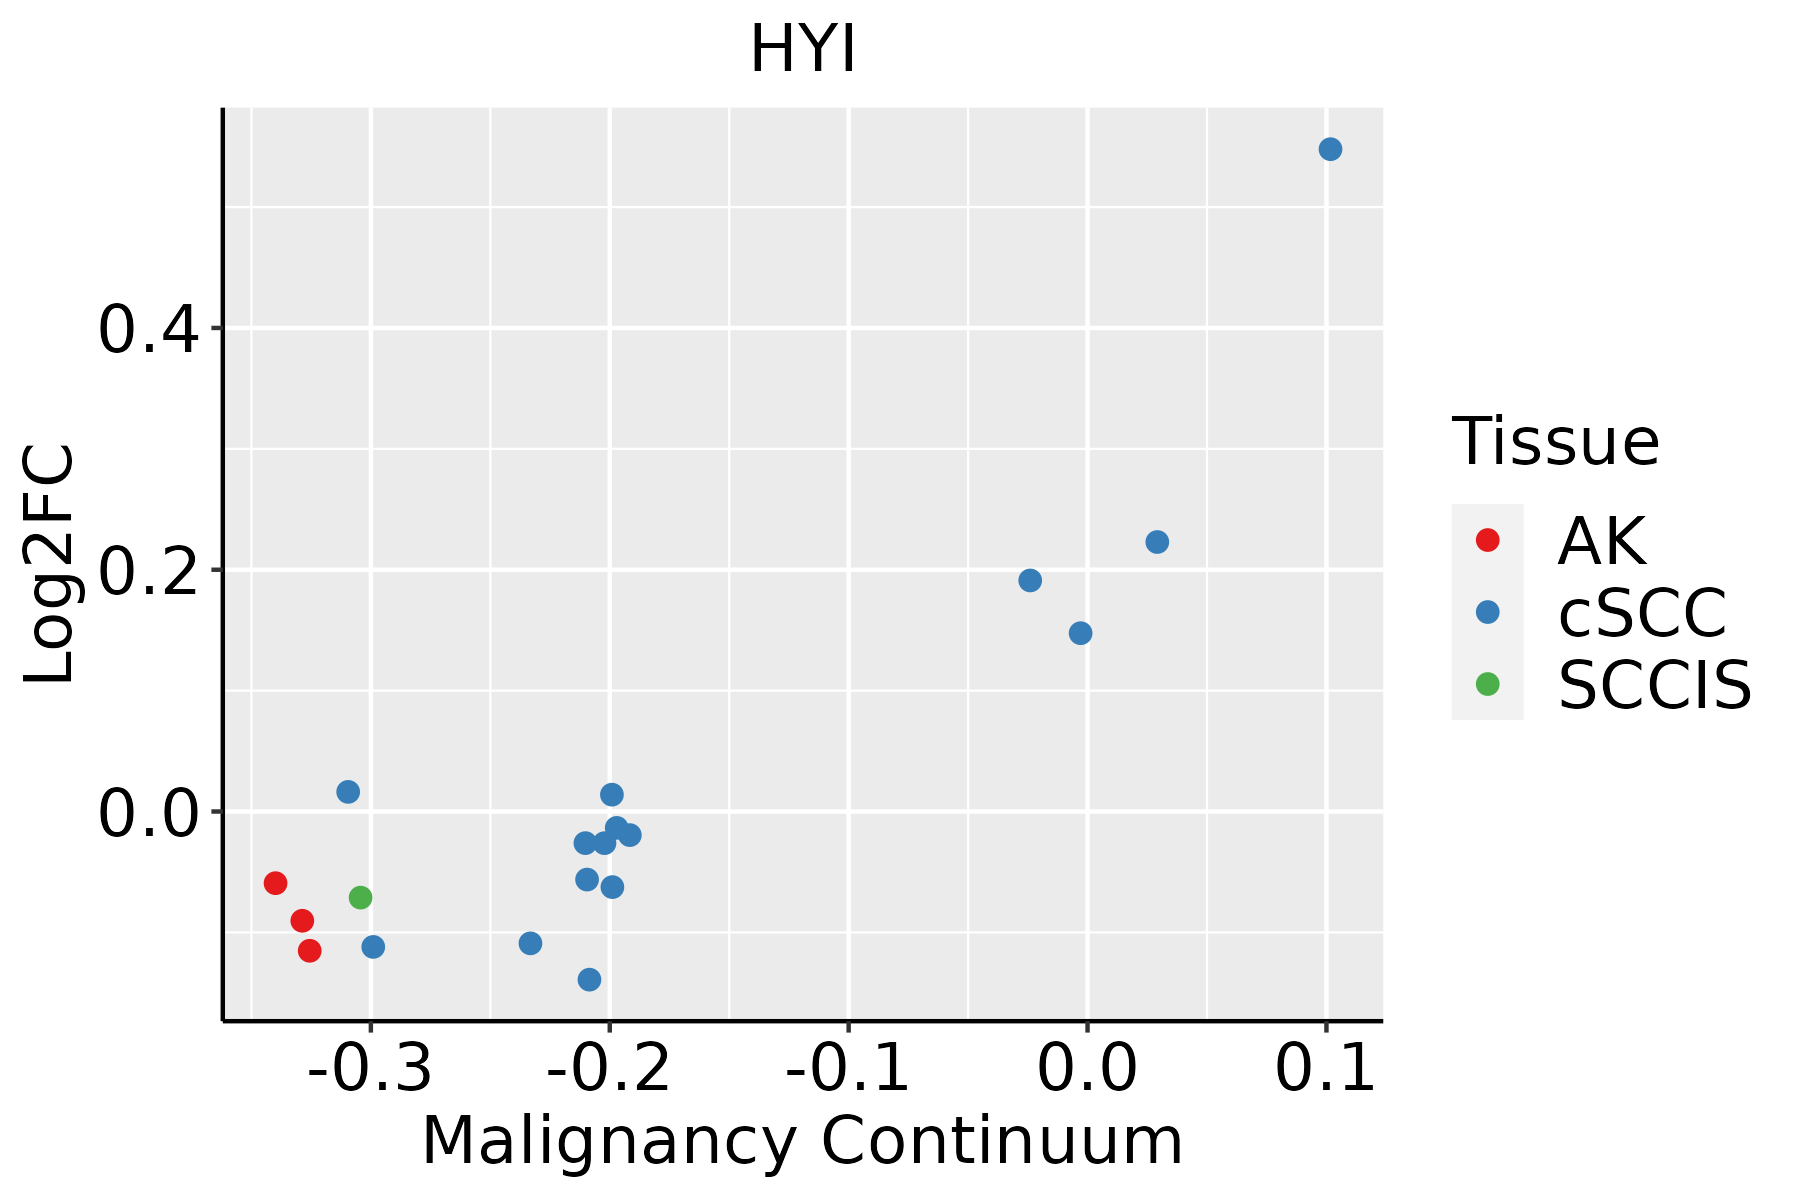 | AK: Actinic keratosis |
| cSCC: Cutaneous squamous cell carcinoma | ||
| SCCIS:squamous cell carcinoma in situ | ||
| Thyroid | 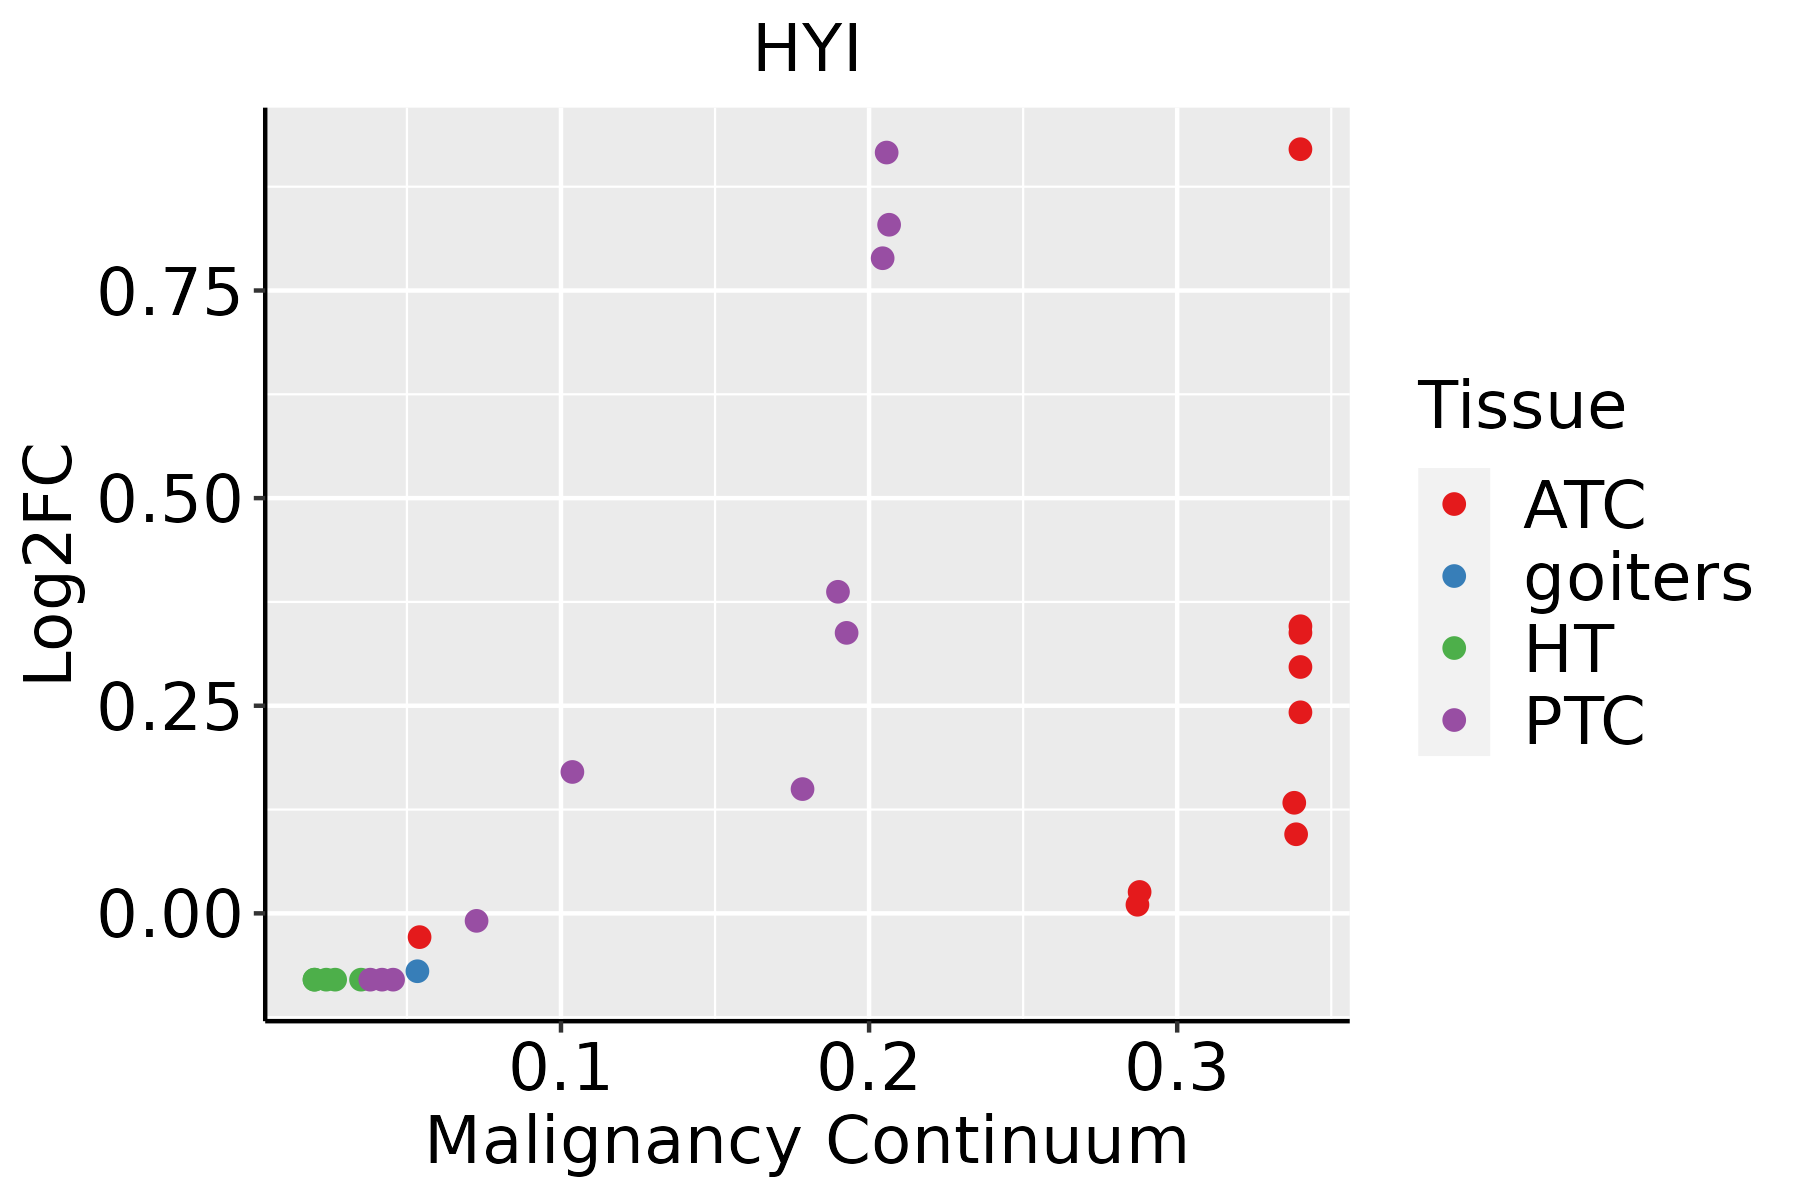 | ATC: Anaplastic thyroid cancer |
| HT: Hashimoto's thyroiditis | ||
| PTC: Papillary thyroid cancer |
| ∗log2FC in expression of this searched gene in stem-like cells from each diseased tissue sample relative to stem-like cells in normal samples in each tissue plotted against the malignancy continuum. Samples are colored based on if they are from different disease stage. |
Top |
Malignant transformation related pathway analysis |
| Find out the enriched GO biological processes and KEGG pathways involved in transition from healthy to precancer to cancer |
| Tissue | Disease Stage | Enriched GO biological Processes |
| Colorectum | AD |  |
| Colorectum | SER |  |
| Colorectum | MSS |  |
| Colorectum | MSI-H |  |
| Colorectum | FAP |  |
| ∗Top 15 enriched GO BP terms are showed in the bar plot of each disease state in each tissue. Each row represents a significant GO biological process which is colored according to the -log10(p.adjust). |
| Page: 1 2 3 4 5 6 7 8 9 |
| GO ID | Tissue | Disease Stage | Description | Gene Ratio | Bg Ratio | pvalue | p.adjust | Count |
| GO:00060818 | Esophagus | ESCC | cellular aldehyde metabolic process | 40/8552 | 60/18723 | 8.30e-04 | 4.28e-03 | 40 |
| GO:00060815 | Liver | Cirrhotic | cellular aldehyde metabolic process | 28/4634 | 60/18723 | 1.83e-04 | 1.71e-03 | 28 |
| GO:000608112 | Liver | HCC | cellular aldehyde metabolic process | 39/7958 | 60/18723 | 3.61e-04 | 2.50e-03 | 39 |
| GO:00060817 | Oral cavity | OSCC | cellular aldehyde metabolic process | 36/7305 | 60/18723 | 7.94e-04 | 4.27e-03 | 36 |
| GO:00060816 | Prostate | BPH | cellular aldehyde metabolic process | 20/3107 | 60/18723 | 1.14e-03 | 7.10e-03 | 20 |
| GO:000608113 | Prostate | Tumor | cellular aldehyde metabolic process | 21/3246 | 60/18723 | 7.59e-04 | 5.20e-03 | 21 |
| GO:00060819 | Skin | cSCC | cellular aldehyde metabolic process | 28/4864 | 60/18723 | 4.35e-04 | 3.36e-03 | 28 |
| Page: 1 |
| Pathway ID | Tissue | Disease Stage | Description | Gene Ratio | Bg Ratio | pvalue | p.adjust | qvalue | Count |
| hsa006306 | Esophagus | ESCC | Glyoxylate and dicarboxylate metabolism | 21/4205 | 30/8465 | 1.95e-02 | 4.35e-02 | 2.23e-02 | 21 |
| hsa0063013 | Esophagus | ESCC | Glyoxylate and dicarboxylate metabolism | 21/4205 | 30/8465 | 1.95e-02 | 4.35e-02 | 2.23e-02 | 21 |
| hsa006304 | Liver | Cirrhotic | Glyoxylate and dicarboxylate metabolism | 20/2530 | 30/8465 | 3.36e-05 | 2.54e-04 | 1.57e-04 | 20 |
| hsa0063011 | Liver | Cirrhotic | Glyoxylate and dicarboxylate metabolism | 20/2530 | 30/8465 | 3.36e-05 | 2.54e-04 | 1.57e-04 | 20 |
| hsa0063021 | Liver | HCC | Glyoxylate and dicarboxylate metabolism | 24/4020 | 30/8465 | 2.66e-04 | 1.24e-03 | 6.88e-04 | 24 |
| hsa0063031 | Liver | HCC | Glyoxylate and dicarboxylate metabolism | 24/4020 | 30/8465 | 2.66e-04 | 1.24e-03 | 6.88e-04 | 24 |
| Page: 1 |
Top |
Cell-cell communication analysis |
| Identification of potential cell-cell interactions between two cell types and their ligand-receptor pairs for different disease states |
| Ligand | Receptor | LRpair | Pathway | Tissue | Disease Stage |
| Page: 1 |
Top |
Single-cell gene regulatory network inference analysis |
| Find out the significant the regulons (TFs) and the target genes of each regulon across cell types for different disease states |
| TF | Cell Type | Tissue | Disease Stage | Target Gene | RSS | Regulon Activity |
| ∗The dot plots of a searched regulon are shown for all cell subpopulations in each disease state of each tissue based on the regulon specific score inferred using pySCENIC and by calculating the average expression. |
| Page: 1 |
Top |
Somatic mutation of malignant transformation related genes |
| Annotation of somatic variants for genes involved in malignant transformation |
| Hugo Symbol | Variant Class | Variant Classification | dbSNP RS | HGVSc | HGVSp | HGVSp Short | SWISSPROT | BIOTYPE | SIFT | PolyPhen | Tumor Sample Barcode | Tissue | Histology | Sex | Age | Stage | Therapy Types | Drugs | Outcome |
| HYI | SNV | Missense_Mutation | novel | c.500N>G | p.Gln167Arg | p.Q167R | protein_coding | tolerated(0.2) | benign(0.007) | TCGA-AA-3811-01 | Colorectum | colon adenocarcinoma | Female | >=65 | III/IV | Unknown | Unknown | PD | |
| HYI | SNV | Missense_Mutation | rs746723799 | c.320N>C | p.Val107Ala | p.V107A | protein_coding | deleterious(0.04) | benign(0) | TCGA-AA-3984-01 | Colorectum | colon adenocarcinoma | Female | <65 | I/II | Unknown | Unknown | SD | |
| HYI | SNV | Missense_Mutation | c.839N>T | p.Asp280Val | p.D280V | protein_coding | deleterious(0.04) | possibly_damaging(0.877) | TCGA-AZ-6598-01 | Colorectum | colon adenocarcinoma | Female | >=65 | I/II | Unknown | Unknown | SD | ||
| HYI | SNV | Missense_Mutation | novel | c.661A>G | p.Asn221Asp | p.N221D | protein_coding | tolerated(0.43) | benign(0.421) | TCGA-F5-6814-01 | Colorectum | rectum adenocarcinoma | Male | <65 | I/II | Unknown | Unknown | SD | |
| HYI | SNV | Missense_Mutation | c.210G>T | p.Glu70Asp | p.E70D | protein_coding | tolerated(0.48) | benign(0.019) | TCGA-B5-A0JY-01 | Endometrium | uterine corpus endometrioid carcinoma | Female | <65 | III/IV | Chemotherapy | doxorubicin | SD | ||
| HYI | SNV | Missense_Mutation | rs201885225 | c.569N>T | p.Thr190Met | p.T190M | protein_coding | tolerated(0.06) | benign(0.26) | TCGA-BK-A13C-01 | Endometrium | uterine corpus endometrioid carcinoma | Female | <65 | I/II | Unknown | Unknown | SD | |
| HYI | SNV | Missense_Mutation | novel | c.749C>A | p.Pro250His | p.P250H | protein_coding | deleterious(0.04) | probably_damaging(0.914) | TCGA-DF-A2KN-01 | Endometrium | uterine corpus endometrioid carcinoma | Female | Unknown | I/II | Unknown | Unknown | SD | |
| HYI | SNV | Missense_Mutation | novel | c.824N>G | p.Tyr275Cys | p.Y275C | protein_coding | deleterious(0) | probably_damaging(1) | TCGA-DI-A1BU-01 | Endometrium | uterine corpus endometrioid carcinoma | Female | <65 | I/II | Chemotherapy | paclitaxel | SD | |
| HYI | SNV | Missense_Mutation | novel | c.452A>T | p.Glu151Val | p.E151V | protein_coding | deleterious(0.05) | benign(0.248) | TCGA-G3-A7M6-01 | Liver | liver hepatocellular carcinoma | Female | <65 | I/II | Unknown | Unknown | PD | |
| HYI | SNV | Missense_Mutation | novel | c.586N>A | p.Ala196Thr | p.A196T | protein_coding | tolerated(0.06) | benign(0.139) | TCGA-CV-A6JZ-01 | Oral cavity | head & neck squamous cell carcinoma | Male | >=65 | I/II | Unknown | Unknown | PD |
| Page: 1 2 |
Top |
Related drugs of malignant transformation related genes |
| Identification of chemicals and drugs interact with genes involved in malignant transfromation |
| (DGIdb 4.0) |
| Entrez ID | Symbol | Category | Interaction Types | Drug Claim Name | Drug Name | PMIDs |
| Page: 1 |

Copyright 2023-Present -The University of Texas Health Science Center at Houston |