
|
|||||
|
 | |
| |
| |
| |
| |
| |
|
Gene: HUS1 |
Gene summary for HUS1 |
| Gene information | Species | Human | Gene symbol | HUS1 | Gene ID | 3364 |
| Gene name | HUS1 checkpoint clamp component | |
| Gene Alias | hHUS1 | |
| Cytomap | 7p12.3 | |
| Gene Type | protein-coding | GO ID | GO:0000003 | UniProtAcc | A4D2F2 |
Top |
Malignant transformation analysis |
| Identification of the aberrant gene expression in precancerous and cancerous lesions by comparing the gene expression of stem-like cells in diseased tissues with normal stem cells |
| Entrez ID | Symbol | Replicates | Species | Organ | Tissue | Adj P-value | Log2FC | Malignancy |
| 3364 | HUS1 | LZE4T | Human | Esophagus | ESCC | 3.17e-13 | 4.38e-01 | 0.0811 |
| 3364 | HUS1 | LZE5T | Human | Esophagus | ESCC | 4.01e-03 | 2.48e-01 | 0.0514 |
| 3364 | HUS1 | LZE7T | Human | Esophagus | ESCC | 4.11e-06 | 2.58e-01 | 0.0667 |
| 3364 | HUS1 | LZE24T | Human | Esophagus | ESCC | 6.44e-08 | 2.25e-01 | 0.0596 |
| 3364 | HUS1 | LZE6T | Human | Esophagus | ESCC | 4.42e-04 | 3.23e-01 | 0.0845 |
| 3364 | HUS1 | P1T-E | Human | Esophagus | ESCC | 1.09e-04 | 2.35e-01 | 0.0875 |
| 3364 | HUS1 | P2T-E | Human | Esophagus | ESCC | 1.65e-23 | 3.18e-01 | 0.1177 |
| 3364 | HUS1 | P4T-E | Human | Esophagus | ESCC | 1.91e-17 | 5.00e-01 | 0.1323 |
| 3364 | HUS1 | P5T-E | Human | Esophagus | ESCC | 3.76e-16 | 2.36e-01 | 0.1327 |
| 3364 | HUS1 | P8T-E | Human | Esophagus | ESCC | 2.64e-05 | 1.19e-01 | 0.0889 |
| 3364 | HUS1 | P9T-E | Human | Esophagus | ESCC | 3.13e-13 | 4.13e-01 | 0.1131 |
| 3364 | HUS1 | P10T-E | Human | Esophagus | ESCC | 4.15e-25 | 4.10e-01 | 0.116 |
| 3364 | HUS1 | P11T-E | Human | Esophagus | ESCC | 6.30e-14 | 5.92e-01 | 0.1426 |
| 3364 | HUS1 | P12T-E | Human | Esophagus | ESCC | 6.33e-19 | 2.56e-01 | 0.1122 |
| 3364 | HUS1 | P15T-E | Human | Esophagus | ESCC | 1.88e-26 | 6.26e-01 | 0.1149 |
| 3364 | HUS1 | P16T-E | Human | Esophagus | ESCC | 1.83e-16 | 3.41e-01 | 0.1153 |
| 3364 | HUS1 | P17T-E | Human | Esophagus | ESCC | 1.13e-03 | 3.69e-01 | 0.1278 |
| 3364 | HUS1 | P20T-E | Human | Esophagus | ESCC | 1.97e-17 | 2.36e-01 | 0.1124 |
| 3364 | HUS1 | P21T-E | Human | Esophagus | ESCC | 6.84e-22 | 4.02e-01 | 0.1617 |
| 3364 | HUS1 | P22T-E | Human | Esophagus | ESCC | 3.17e-19 | 2.86e-01 | 0.1236 |
| Page: 1 2 3 4 5 |
| Tissue | Expression Dynamics | Abbreviation |
| Esophagus | 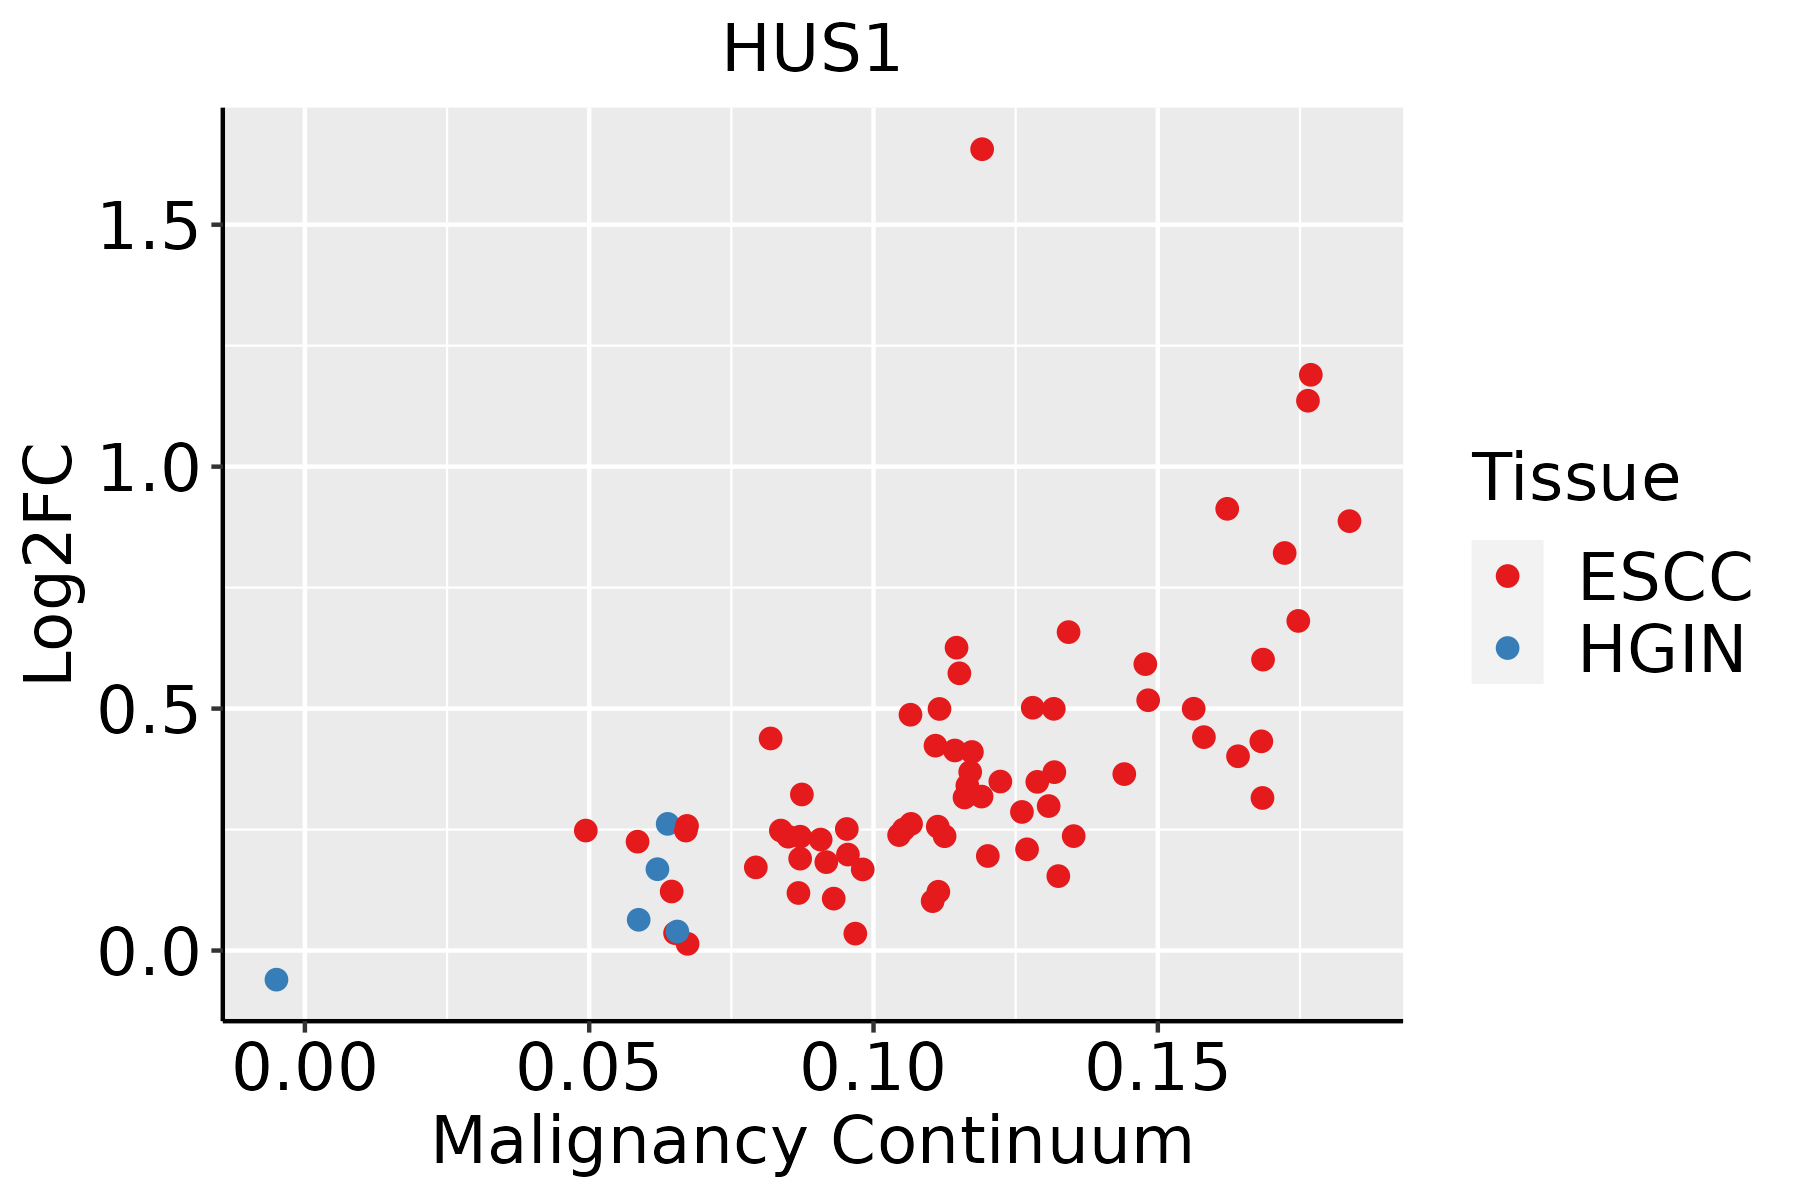 | ESCC: Esophageal squamous cell carcinoma |
| HGIN: High-grade intraepithelial neoplasias | ||
| LGIN: Low-grade intraepithelial neoplasias | ||
| Liver |  | HCC: Hepatocellular carcinoma |
| NAFLD: Non-alcoholic fatty liver disease | ||
| Oral Cavity |  | EOLP: Erosive Oral lichen planus |
| LP: leukoplakia | ||
| NEOLP: Non-erosive oral lichen planus | ||
| OSCC: Oral squamous cell carcinoma |
| ∗log2FC in expression of this searched gene in stem-like cells from each diseased tissue sample relative to stem-like cells in normal samples in each tissue plotted against the malignancy continuum. Samples are colored based on if they are from different disease stage. |
Top |
Malignant transformation related pathway analysis |
| Find out the enriched GO biological processes and KEGG pathways involved in transition from healthy to precancer to cancer |
| Tissue | Disease Stage | Enriched GO biological Processes |
| Colorectum | AD |  |
| Colorectum | SER |  |
| Colorectum | MSS |  |
| Colorectum | MSI-H |  |
| Colorectum | FAP |  |
| ∗Top 15 enriched GO BP terms are showed in the bar plot of each disease state in each tissue. Each row represents a significant GO biological process which is colored according to the -log10(p.adjust). |
| Page: 1 2 3 4 5 6 7 8 9 |
| GO ID | Tissue | Disease Stage | Description | Gene Ratio | Bg Ratio | pvalue | p.adjust | Count |
| GO:004477216 | Esophagus | ESCC | mitotic cell cycle phase transition | 281/8552 | 424/18723 | 4.63e-18 | 4.45e-16 | 281 |
| GO:000734615 | Esophagus | ESCC | regulation of mitotic cell cycle | 293/8552 | 457/18723 | 8.00e-16 | 5.64e-14 | 293 |
| GO:000941113 | Esophagus | ESCC | response to UV | 115/8552 | 149/18723 | 3.29e-15 | 1.93e-13 | 115 |
| GO:001021217 | Esophagus | ESCC | response to ionizing radiation | 110/8552 | 148/18723 | 1.11e-12 | 4.78e-11 | 110 |
| GO:000072319 | Esophagus | ESCC | telomere maintenance | 99/8552 | 131/18723 | 2.68e-12 | 1.08e-10 | 99 |
| GO:190198713 | Esophagus | ESCC | regulation of cell cycle phase transition | 242/8552 | 390/18723 | 3.86e-11 | 1.26e-09 | 242 |
| GO:000931419 | Esophagus | ESCC | response to radiation | 277/8552 | 456/18723 | 4.42e-11 | 1.43e-09 | 277 |
| GO:190199013 | Esophagus | ESCC | regulation of mitotic cell cycle phase transition | 191/8552 | 299/18723 | 1.35e-10 | 3.94e-09 | 191 |
| GO:00457865 | Esophagus | ESCC | negative regulation of cell cycle | 236/8552 | 385/18723 | 3.62e-10 | 9.93e-09 | 236 |
| GO:00000754 | Esophagus | ESCC | cell cycle checkpoint | 117/8552 | 169/18723 | 4.47e-10 | 1.17e-08 | 117 |
| GO:007121419 | Esophagus | ESCC | cellular response to abiotic stimulus | 206/8552 | 331/18723 | 7.52e-10 | 1.88e-08 | 206 |
| GO:010400419 | Esophagus | ESCC | cellular response to environmental stimulus | 206/8552 | 331/18723 | 7.52e-10 | 1.88e-08 | 206 |
| GO:004277014 | Esophagus | ESCC | signal transduction in response to DNA damage | 117/8552 | 172/18723 | 2.38e-09 | 5.32e-08 | 117 |
| GO:00448394 | Esophagus | ESCC | cell cycle G2/M phase transition | 103/8552 | 148/18723 | 3.09e-09 | 6.67e-08 | 103 |
| GO:00000864 | Esophagus | ESCC | G2/M transition of mitotic cell cycle | 96/8552 | 137/18723 | 6.00e-09 | 1.23e-07 | 96 |
| GO:00070934 | Esophagus | ESCC | mitotic cell cycle checkpoint | 90/8552 | 129/18723 | 2.49e-08 | 4.69e-07 | 90 |
| GO:007147816 | Esophagus | ESCC | cellular response to radiation | 122/8552 | 186/18723 | 3.07e-08 | 5.73e-07 | 122 |
| GO:00109484 | Esophagus | ESCC | negative regulation of cell cycle process | 177/8552 | 294/18723 | 3.26e-07 | 4.59e-06 | 177 |
| GO:0071479110 | Esophagus | ESCC | cellular response to ionizing radiation | 54/8552 | 72/18723 | 3.85e-07 | 5.32e-06 | 54 |
| GO:00315705 | Esophagus | ESCC | DNA integrity checkpoint | 83/8552 | 123/18723 | 8.17e-07 | 1.06e-05 | 83 |
| Page: 1 2 3 4 5 6 |
| Pathway ID | Tissue | Disease Stage | Description | Gene Ratio | Bg Ratio | pvalue | p.adjust | qvalue | Count |
| hsa0421829 | Esophagus | ESCC | Cellular senescence | 119/4205 | 156/8465 | 5.89e-12 | 9.40e-11 | 4.81e-11 | 119 |
| hsa0421838 | Esophagus | ESCC | Cellular senescence | 119/4205 | 156/8465 | 5.89e-12 | 9.40e-11 | 4.81e-11 | 119 |
| hsa0421822 | Liver | HCC | Cellular senescence | 102/4020 | 156/8465 | 4.18e-06 | 3.59e-05 | 2.00e-05 | 102 |
| hsa0421832 | Liver | HCC | Cellular senescence | 102/4020 | 156/8465 | 4.18e-06 | 3.59e-05 | 2.00e-05 | 102 |
| hsa0421820 | Oral cavity | OSCC | Cellular senescence | 112/3704 | 156/8465 | 8.04e-13 | 1.42e-11 | 7.21e-12 | 112 |
| hsa04218110 | Oral cavity | OSCC | Cellular senescence | 112/3704 | 156/8465 | 8.04e-13 | 1.42e-11 | 7.21e-12 | 112 |
| Page: 1 |
Top |
Cell-cell communication analysis |
| Identification of potential cell-cell interactions between two cell types and their ligand-receptor pairs for different disease states |
| Ligand | Receptor | LRpair | Pathway | Tissue | Disease Stage |
| Page: 1 |
Top |
Single-cell gene regulatory network inference analysis |
| Find out the significant the regulons (TFs) and the target genes of each regulon across cell types for different disease states |
| TF | Cell Type | Tissue | Disease Stage | Target Gene | RSS | Regulon Activity |
| ∗The dot plots of a searched regulon are shown for all cell subpopulations in each disease state of each tissue based on the regulon specific score inferred using pySCENIC and by calculating the average expression. |
| Page: 1 |
Top |
Somatic mutation of malignant transformation related genes |
| Annotation of somatic variants for genes involved in malignant transformation |
| Hugo Symbol | Variant Class | Variant Classification | dbSNP RS | HGVSc | HGVSp | HGVSp Short | SWISSPROT | BIOTYPE | SIFT | PolyPhen | Tumor Sample Barcode | Tissue | Histology | Sex | Age | Stage | Therapy Types | Drugs | Outcome |
| HUS1 | SNV | Missense_Mutation | c.232G>A | p.Glu78Lys | p.E78K | O60921 | protein_coding | deleterious(0.01) | benign(0.395) | TCGA-BH-A208-01 | Breast | breast invasive carcinoma | Female | <65 | I/II | Unknown | Unknown | SD | |
| HUS1 | insertion | Frame_Shift_Ins | novel | c.688_689insAACAATTTCTCATTGATGTTGTGAAAATCGTCATGTATTTAGA | p.Val230GlufsTer20 | p.V230Efs*20 | O60921 | protein_coding | TCGA-BH-A0HF-01 | Breast | breast invasive carcinoma | Female | >=65 | I/II | Hormone Therapy | arimidex | SD | ||
| HUS1 | SNV | Missense_Mutation | c.183N>T | p.Glu61Asp | p.E61D | O60921 | protein_coding | tolerated(0.51) | benign(0.068) | TCGA-AA-3510-01 | Colorectum | colon adenocarcinoma | Male | >=65 | I/II | Unknown | Unknown | SD | |
| HUS1 | SNV | Missense_Mutation | c.501G>T | p.Lys167Asn | p.K167N | O60921 | protein_coding | deleterious(0) | probably_damaging(0.974) | TCGA-AA-3713-01 | Colorectum | colon adenocarcinoma | Male | >=65 | III/IV | Chemotherapy | 5-fluorouracil | PR | |
| HUS1 | SNV | Missense_Mutation | c.667N>C | p.Asn223His | p.N223H | O60921 | protein_coding | tolerated(0.13) | benign(0.003) | TCGA-AA-A010-01 | Colorectum | colon adenocarcinoma | Female | <65 | I/II | Chemotherapy | folinic | CR | |
| HUS1 | SNV | Missense_Mutation | rs779721301 | c.341C>T | p.Thr114Met | p.T114M | O60921 | protein_coding | deleterious(0.01) | probably_damaging(0.987) | TCGA-A5-A0G2-01 | Endometrium | uterine corpus endometrioid carcinoma | Female | <65 | III/IV | Unknown | Unknown | SD |
| HUS1 | SNV | Missense_Mutation | c.416N>A | p.Pro139His | p.P139H | O60921 | protein_coding | deleterious(0) | probably_damaging(1) | TCGA-AP-A059-01 | Endometrium | uterine corpus endometrioid carcinoma | Female | >=65 | I/II | Unknown | Unknown | SD | |
| HUS1 | SNV | Missense_Mutation | rs779721301 | c.341N>T | p.Thr114Met | p.T114M | O60921 | protein_coding | deleterious(0.01) | probably_damaging(0.987) | TCGA-AP-A1DK-01 | Endometrium | uterine corpus endometrioid carcinoma | Female | <65 | I/II | Unknown | Unknown | SD |
| HUS1 | SNV | Missense_Mutation | novel | c.265N>C | p.Ser89Pro | p.S89P | O60921 | protein_coding | tolerated(0.19) | possibly_damaging(0.747) | TCGA-AX-A2HD-01 | Endometrium | uterine corpus endometrioid carcinoma | Female | >=65 | III/IV | Unknown | Unknown | SD |
| HUS1 | SNV | Missense_Mutation | c.192N>A | p.Phe64Leu | p.F64L | O60921 | protein_coding | deleterious(0) | probably_damaging(1) | TCGA-B5-A0JY-01 | Endometrium | uterine corpus endometrioid carcinoma | Female | <65 | III/IV | Chemotherapy | doxorubicin | SD |
| Page: 1 2 3 |
Top |
Related drugs of malignant transformation related genes |
| Identification of chemicals and drugs interact with genes involved in malignant transfromation |
| (DGIdb 4.0) |
| Entrez ID | Symbol | Category | Interaction Types | Drug Claim Name | Drug Name | PMIDs |
| 3364 | HUS1 | DNA REPAIR, KINASE | CAMPTOTHECIN | CAMPTOTHECIN | 14762204 |
| Page: 1 |

Copyright 2023-Present -The University of Texas Health Science Center at Houston |