
|
|||||
|
 | |
| |
| |
| |
| |
| |
|
Gene: HULC |
Gene summary for HULC |
| Gene information | Species | Human | Gene symbol | HULC | Gene ID | 728655 |
| Gene name | hepatocellular carcinoma up-regulated long non-coding RNA | |
| Gene Alias | HCCAT1 | |
| Cytomap | 6p24.3 | |
| Gene Type | ncRNA | GO ID | GO:0006629 | UniProtAcc | NA |
Top |
Malignant transformation analysis |
| Identification of the aberrant gene expression in precancerous and cancerous lesions by comparing the gene expression of stem-like cells in diseased tissues with normal stem cells |
| Entrez ID | Symbol | Replicates | Species | Organ | Tissue | Adj P-value | Log2FC | Malignancy |
| 728655 | HULC | S41 | Human | Liver | Cirrhotic | 2.61e-13 | 6.17e-01 | -0.0343 |
| 728655 | HULC | HCC1_Meng | Human | Liver | HCC | 2.59e-91 | 7.90e-01 | 0.0246 |
| 728655 | HULC | HCC1 | Human | Liver | HCC | 2.86e-56 | 7.51e+00 | 0.5336 |
| 728655 | HULC | HCC5 | Human | Liver | HCC | 2.24e-24 | 4.19e+00 | 0.4932 |
| 728655 | HULC | Pt13.a | Human | Liver | HCC | 1.56e-147 | 1.78e+00 | 0.021 |
| 728655 | HULC | Pt13.b | Human | Liver | HCC | 9.37e-130 | 1.56e+00 | 0.0251 |
| 728655 | HULC | Pt13.c | Human | Liver | HCC | 2.93e-29 | 9.91e-01 | 0.0076 |
| 728655 | HULC | Pt14.a | Human | Liver | HCC | 3.24e-14 | 6.13e-01 | 0.0169 |
| 728655 | HULC | Pt14.b | Human | Liver | HCC | 3.58e-47 | 1.46e+00 | 0.018 |
| 728655 | HULC | Pt14.c | Human | Liver | HCC | 4.88e-25 | 1.27e+00 | 0.0054 |
| 728655 | HULC | Pt14.d | Human | Liver | HCC | 4.63e-43 | 9.28e-01 | 0.0143 |
| 728655 | HULC | RNA-P17T-P17T-2 | Human | Lung | IAC | 6.80e-05 | 5.12e-01 | 0.3371 |
| 728655 | HULC | RNA-P17T-P17T-4 | Human | Lung | IAC | 4.28e-05 | 4.97e-01 | 0.343 |
| 728655 | HULC | RNA-P17T-P17T-6 | Human | Lung | IAC | 1.48e-03 | 3.66e-01 | 0.3385 |
| 728655 | HULC | RNA-P17T-P17T-8 | Human | Lung | IAC | 5.44e-06 | 6.35e-01 | 0.3329 |
| 728655 | HULC | RNA-P25T1-P25T1-1 | Human | Lung | AIS | 1.67e-11 | 5.40e-01 | -0.2116 |
| 728655 | HULC | RNA-P25T1-P25T1-2 | Human | Lung | AIS | 1.36e-03 | 4.97e-01 | -0.1941 |
| 728655 | HULC | RNA-P25T1-P25T1-3 | Human | Lung | AIS | 7.22e-04 | 4.97e-01 | -0.2107 |
| 728655 | HULC | RNA-P25T1-P25T1-4 | Human | Lung | AIS | 2.01e-09 | 5.28e-01 | -0.2119 |
| 728655 | HULC | RNA-P7T1-P7T1-1 | Human | Lung | AIS | 1.36e-03 | 5.71e-01 | -0.0961 |
| Page: 1 2 |
| Tissue | Expression Dynamics | Abbreviation |
| Liver | 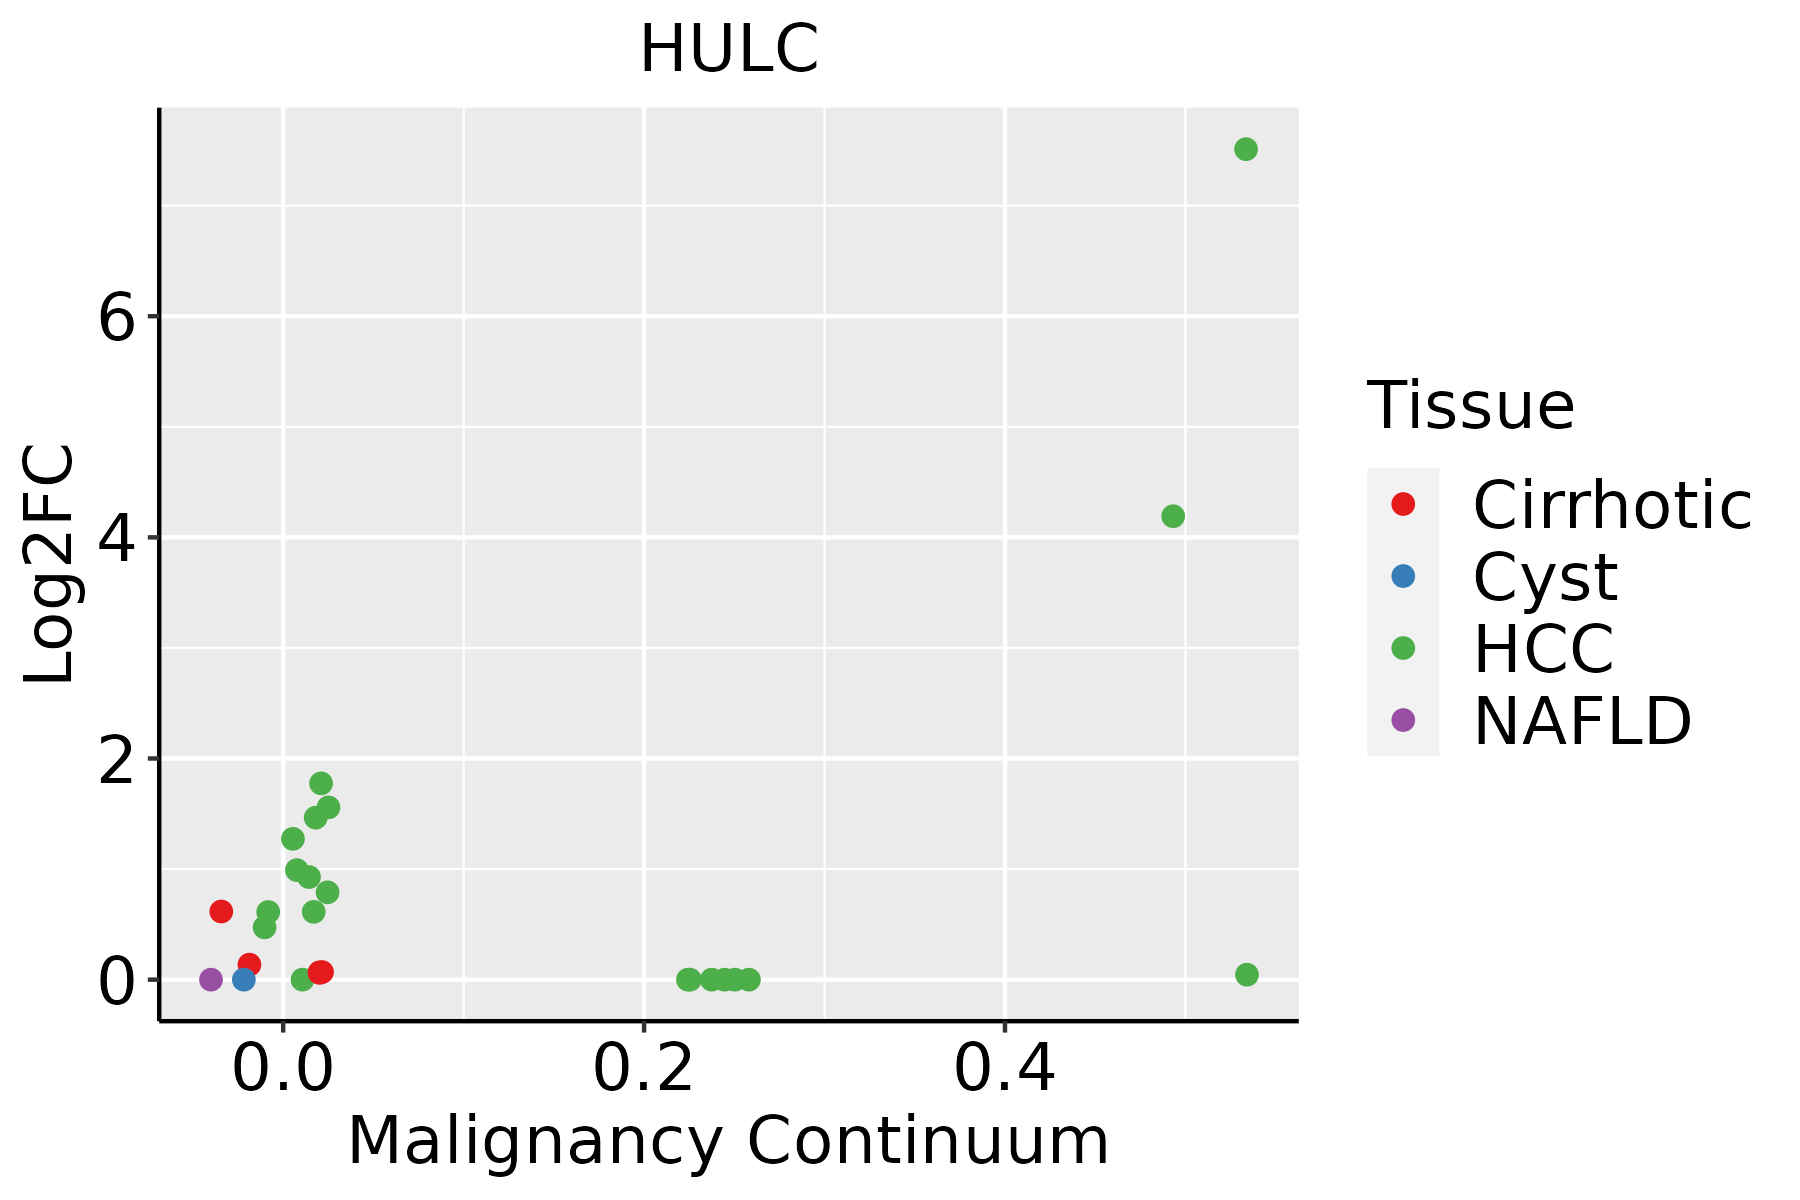 | HCC: Hepatocellular carcinoma |
| NAFLD: Non-alcoholic fatty liver disease | ||
| Lung | 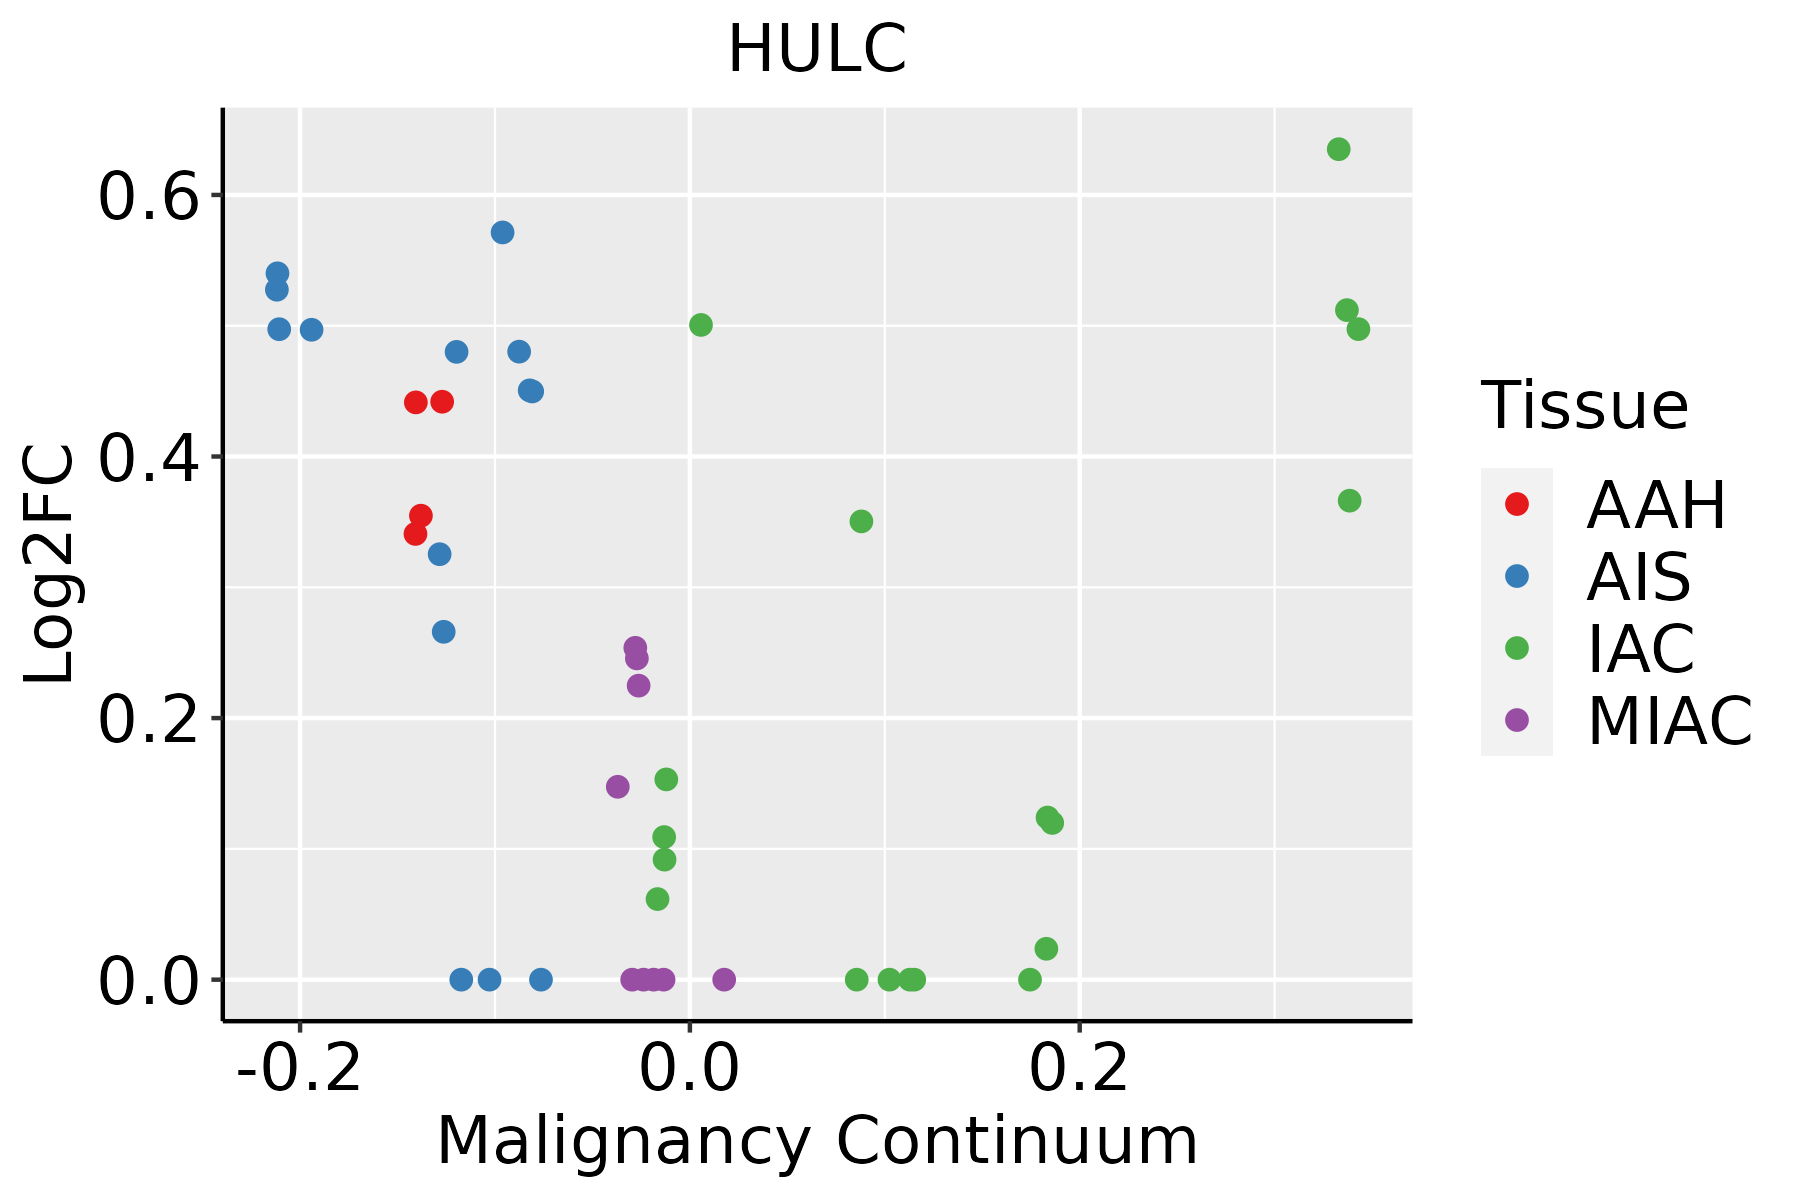 | AAH: Atypical adenomatous hyperplasia |
| AIS: Adenocarcinoma in situ | ||
| IAC: Invasive lung adenocarcinoma | ||
| MIA: Minimally invasive adenocarcinoma |
| ∗log2FC in expression of this searched gene in stem-like cells from each diseased tissue sample relative to stem-like cells in normal samples in each tissue plotted against the malignancy continuum. Samples are colored based on if they are from different disease stage. |
Top |
Malignant transformation related pathway analysis |
| Find out the enriched GO biological processes and KEGG pathways involved in transition from healthy to precancer to cancer |
| Tissue | Disease Stage | Enriched GO biological Processes |
| Colorectum | AD |  |
| Colorectum | SER |  |
| Colorectum | MSS |  |
| Colorectum | MSI-H |  |
| Colorectum | FAP |  |
| ∗Top 15 enriched GO BP terms are showed in the bar plot of each disease state in each tissue. Each row represents a significant GO biological process which is colored according to the -log10(p.adjust). |
| Page: 1 2 3 4 5 6 7 8 9 |
| GO ID | Tissue | Disease Stage | Description | Gene Ratio | Bg Ratio | pvalue | p.adjust | Count |
| GO:001921611 | Liver | Cirrhotic | regulation of lipid metabolic process | 119/4634 | 331/18723 | 3.05e-06 | 5.39e-05 | 119 |
| GO:004689011 | Liver | Cirrhotic | regulation of lipid biosynthetic process | 67/4634 | 171/18723 | 2.00e-05 | 2.65e-04 | 67 |
| GO:00192162 | Liver | HCC | regulation of lipid metabolic process | 181/7958 | 331/18723 | 4.58e-06 | 5.79e-05 | 181 |
| GO:00468902 | Liver | HCC | regulation of lipid biosynthetic process | 96/7958 | 171/18723 | 2.14e-04 | 1.63e-03 | 96 |
| Page: 1 |
| Pathway ID | Tissue | Disease Stage | Description | Gene Ratio | Bg Ratio | pvalue | p.adjust | qvalue | Count |
| Page: 1 |
Top |
Cell-cell communication analysis |
| Identification of potential cell-cell interactions between two cell types and their ligand-receptor pairs for different disease states |
| Ligand | Receptor | LRpair | Pathway | Tissue | Disease Stage |
| Page: 1 |
Top |
Single-cell gene regulatory network inference analysis |
| Find out the significant the regulons (TFs) and the target genes of each regulon across cell types for different disease states |
| TF | Cell Type | Tissue | Disease Stage | Target Gene | RSS | Regulon Activity |
| ∗The dot plots of a searched regulon are shown for all cell subpopulations in each disease state of each tissue based on the regulon specific score inferred using pySCENIC and by calculating the average expression. |
| Page: 1 |
Top |
Somatic mutation of malignant transformation related genes |
| Annotation of somatic variants for genes involved in malignant transformation |
| Hugo Symbol | Variant Class | Variant Classification | dbSNP RS | HGVSc | HGVSp | HGVSp Short | SWISSPROT | BIOTYPE | SIFT | PolyPhen | Tumor Sample Barcode | Tissue | Histology | Sex | Age | Stage | Therapy Types | Drugs | Outcome |
| Page: 1 |
Top |
Related drugs of malignant transformation related genes |
| Identification of chemicals and drugs interact with genes involved in malignant transfromation |
| (DGIdb 4.0) |
| Entrez ID | Symbol | Category | Interaction Types | Drug Claim Name | Drug Name | PMIDs |
| Page: 1 |

Copyright 2023-Present -The University of Texas Health Science Center at Houston |