| GO ID | Tissue | Disease Stage | Description | Gene Ratio | Bg Ratio | pvalue | p.adjust | Count |
| GO:00715598 | Oral cavity | OSCC | response to transforming growth factor beta | 140/7305 | 256/18723 | 2.34e-07 | 3.70e-06 | 140 |
| GO:00715608 | Oral cavity | OSCC | cellular response to transforming growth factor beta stimulus | 137/7305 | 250/18723 | 2.68e-07 | 4.15e-06 | 137 |
| GO:00071798 | Oral cavity | OSCC | transforming growth factor beta receptor signaling pathway | 109/7305 | 198/18723 | 3.21e-06 | 3.86e-05 | 109 |
| GO:00170155 | Oral cavity | OSCC | regulation of transforming growth factor beta receptor signaling pathway | 71/7305 | 128/18723 | 1.14e-04 | 8.34e-04 | 71 |
| GO:19038446 | Oral cavity | OSCC | regulation of cellular response to transforming growth factor beta stimulus | 72/7305 | 131/18723 | 1.51e-04 | 1.06e-03 | 72 |
| GO:00071789 | Oral cavity | OSCC | transmembrane receptor protein serine/threonine kinase signaling pathway | 165/7305 | 355/18723 | 2.31e-03 | 1.02e-02 | 165 |
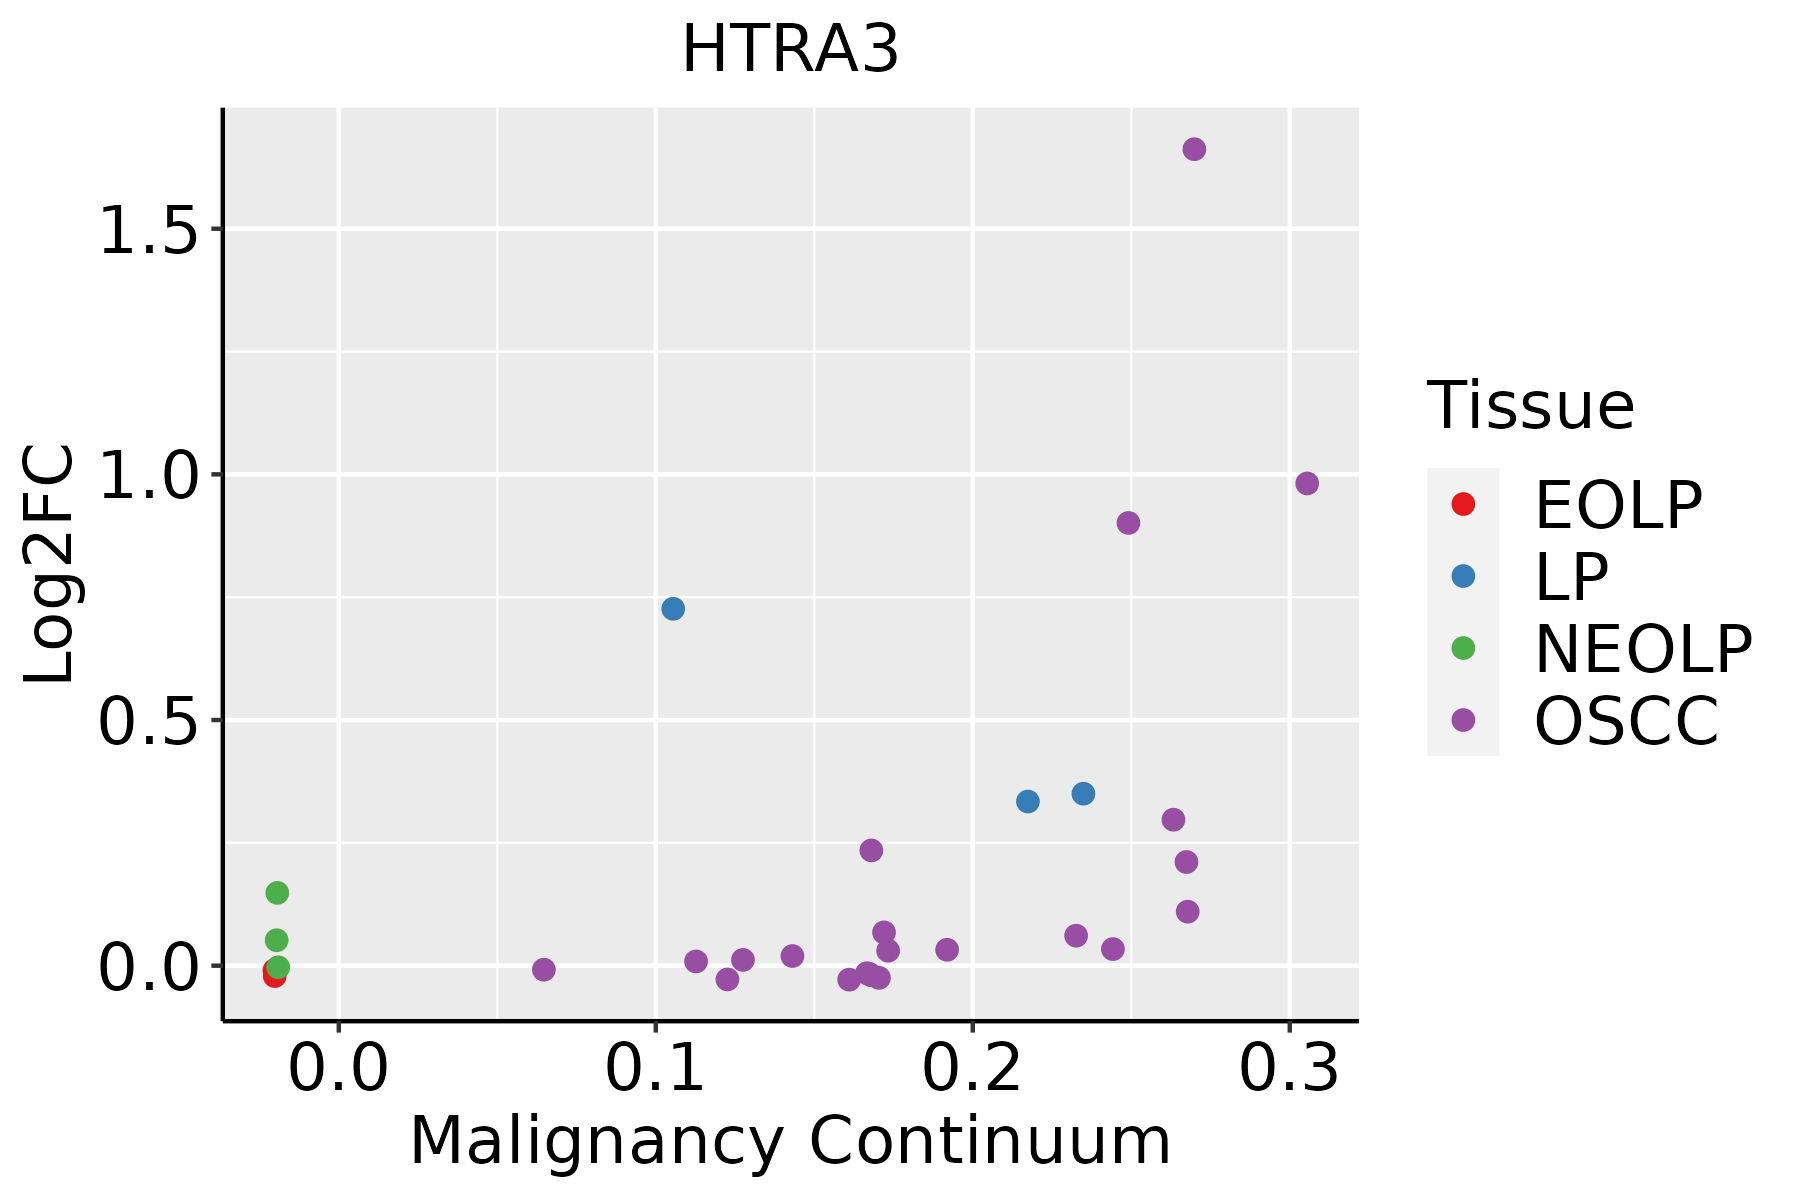
| GO:007155924 | Oral cavity | NEOLP | response to transforming growth factor beta | 59/2005 | 256/18723 | 8.84e-09 | 4.49e-07 | 59 |
| GO:007156024 | Oral cavity | NEOLP | cellular response to transforming growth factor beta stimulus | 58/2005 | 250/18723 | 9.13e-09 | 4.56e-07 | 58 |
| GO:000717923 | Oral cavity | NEOLP | transforming growth factor beta receptor signaling pathway | 48/2005 | 198/18723 | 4.01e-08 | 1.66e-06 | 48 |
| GO:000717822 | Oral cavity | NEOLP | transmembrane receptor protein serine/threonine kinase signaling pathway | 70/2005 | 355/18723 | 3.04e-07 | 9.62e-06 | 70 |
| GO:001701521 | Oral cavity | NEOLP | regulation of transforming growth factor beta receptor signaling pathway | 33/2005 | 128/18723 | 1.18e-06 | 3.08e-05 | 33 |
| GO:190384421 | Oral cavity | NEOLP | regulation of cellular response to transforming growth factor beta stimulus | 33/2005 | 131/18723 | 2.05e-06 | 4.86e-05 | 33 |
| GO:003051211 | Oral cavity | NEOLP | negative regulation of transforming growth factor beta receptor signaling pathway | 24/2005 | 81/18723 | 2.40e-06 | 5.53e-05 | 24 |
| GO:00901011 | Oral cavity | NEOLP | negative regulation of transmembrane receptor protein serine/threonine kinase signaling pathway | 32/2005 | 131/18723 | 5.88e-06 | 1.19e-04 | 32 |
| GO:009028711 | Oral cavity | NEOLP | regulation of cellular response to growth factor stimulus | 56/2005 | 304/18723 | 3.55e-05 | 5.20e-04 | 56 |
| GO:009009213 | Oral cavity | NEOLP | regulation of transmembrane receptor protein serine/threonine kinase signaling pathway | 49/2005 | 256/18723 | 3.90e-05 | 5.62e-04 | 49 |
| GO:00305101 | Oral cavity | NEOLP | regulation of BMP signaling pathway | 20/2005 | 96/18723 | 2.60e-03 | 1.63e-02 | 20 |
| GO:007177212 | Oral cavity | NEOLP | response to BMP | 29/2005 | 165/18723 | 5.04e-03 | 2.73e-02 | 29 |
| GO:007177312 | Oral cavity | NEOLP | cellular response to BMP stimulus | 29/2005 | 165/18723 | 5.04e-03 | 2.73e-02 | 29 |
| GO:003050912 | Oral cavity | NEOLP | BMP signaling pathway | 27/2005 | 152/18723 | 5.75e-03 | 3.04e-02 | 27 |
| Hugo Symbol | Variant Class | Variant Classification | dbSNP RS | HGVSc | HGVSp | HGVSp Short | SWISSPROT | BIOTYPE | SIFT | PolyPhen | Tumor Sample Barcode | Tissue | Histology | Sex | Age | Stage | Therapy Types | Drugs | Outcome |
| HTRA3 | insertion | Nonsense_Mutation | novel | c.658_659insCCGGGGGCTCGGGAGGCCTCACAAGCTAAGCCTG | p.Lys220ThrfsTer10 | p.K220Tfs*10 | P83110 | protein_coding | | | TCGA-A8-A07J-01 | Breast | breast invasive carcinoma | Female | <65 | I/II | Chemotherapy | 5-fluorouracil | CR |
| HTRA3 | insertion | Nonsense_Mutation | novel | c.838_839insCATCCTGGTCTGTCTGGCTCCGTGCTCCGT | p.Glu280delinsAlaSerTrpSerValTrpLeuArgAlaProTer | p.E280delinsASWSVWLRAP* | P83110 | protein_coding | | | TCGA-BH-A0HK-01 | Breast | breast invasive carcinoma | Female | >=65 | I/II | Hormone Therapy | arimidex | SD |
| HTRA3 | insertion | Frame_Shift_Ins | novel | c.840_841insTCAAGAT | p.Gly281SerfsTer93 | p.G281Sfs*93 | P83110 | protein_coding | | | TCGA-BH-A0HK-01 | Breast | breast invasive carcinoma | Female | >=65 | I/II | Hormone Therapy | arimidex | SD |
| HTRA3 | deletion | Frame_Shift_Del | novel | c.511delN | p.Leu172CysfsTer14 | p.L172Cfs*14 | P83110 | protein_coding | | | TCGA-D8-A27V-01 | Breast | breast invasive carcinoma | Female | <65 | I/II | Hormone Therapy | tamoxiphen | SD |
| HTRA3 | SNV | Missense_Mutation | rs776517422 | c.676T>G | p.Ser226Ala | p.S226A | P83110 | protein_coding | tolerated(1) | benign(0.006) | TCGA-2W-A8YY-01 | Cervix | cervical & endocervical cancer | Female | <65 | I/II | Chemotherapy | cisplatin | CR |
| HTRA3 | SNV | Missense_Mutation | novel | c.1001C>T | p.Ser334Leu | p.S334L | P83110 | protein_coding | deleterious(0.03) | probably_damaging(0.914) | TCGA-LP-A4AV-01 | Cervix | cervical & endocervical cancer | Female | <65 | I/II | Unknown | Unknown | SD |
| HTRA3 | SNV | Missense_Mutation | | c.887C>T | p.Thr296Met | p.T296M | P83110 | protein_coding | deleterious(0) | probably_damaging(1) | TCGA-5M-AAT6-01 | Colorectum | colon adenocarcinoma | Female | <65 | III/IV | Unknown | Unknown | PD |
| HTRA3 | SNV | Missense_Mutation | | c.1276G>A | p.Val426Met | p.V426M | P83110 | protein_coding | deleterious(0) | possibly_damaging(0.875) | TCGA-AD-6889-01 | Colorectum | colon adenocarcinoma | Male | >=65 | I/II | Chemotherapy | xeloda | PD |
| HTRA3 | SNV | Missense_Mutation | | c.1013N>G | p.Thr338Arg | p.T338R | P83110 | protein_coding | tolerated(1) | benign(0.001) | TCGA-CK-4951-01 | Colorectum | colon adenocarcinoma | Female | >=65 | I/II | Unknown | Unknown | PD |
| HTRA3 | SNV | Missense_Mutation | rs137866031 | c.1312N>T | p.Arg438Trp | p.R438W | P83110 | protein_coding | deleterious(0.02) | probably_damaging(0.957) | TCGA-CK-5916-01 | Colorectum | colon adenocarcinoma | Female | >=65 | I/II | Unknown | Unknown | PD |