
|
|||||
|
 | |
| |
| |
| |
| |
| |
|
Gene: HTRA1 |
Gene summary for HTRA1 |
| Gene information | Species | Human | Gene symbol | HTRA1 | Gene ID | 5654 |
| Gene name | HtrA serine peptidase 1 | |
| Gene Alias | ARMD7 | |
| Cytomap | 10q26.13 | |
| Gene Type | protein-coding | GO ID | GO:0000003 | UniProtAcc | Q92743 |
Top |
Malignant transformation analysis |
| Identification of the aberrant gene expression in precancerous and cancerous lesions by comparing the gene expression of stem-like cells in diseased tissues with normal stem cells |
| Entrez ID | Symbol | Replicates | Species | Organ | Tissue | Adj P-value | Log2FC | Malignancy |
| 5654 | HTRA1 | AEH-subject1 | Human | Endometrium | AEH | 7.25e-21 | -4.36e-01 | -0.3059 |
| 5654 | HTRA1 | AEH-subject2 | Human | Endometrium | AEH | 5.42e-13 | -3.81e-01 | -0.2525 |
| 5654 | HTRA1 | AEH-subject3 | Human | Endometrium | AEH | 9.13e-04 | -2.88e-01 | -0.2576 |
| 5654 | HTRA1 | AEH-subject4 | Human | Endometrium | AEH | 8.66e-07 | -3.47e-01 | -0.2657 |
| 5654 | HTRA1 | AEH-subject5 | Human | Endometrium | AEH | 6.72e-29 | -5.23e-01 | -0.2953 |
| 5654 | HTRA1 | EEC-subject1 | Human | Endometrium | EEC | 2.44e-05 | -2.38e-01 | -0.2682 |
| 5654 | HTRA1 | EEC-subject2 | Human | Endometrium | EEC | 1.19e-24 | -5.17e-01 | -0.2607 |
| 5654 | HTRA1 | EEC-subject3 | Human | Endometrium | EEC | 2.77e-33 | -4.31e-01 | -0.2525 |
| 5654 | HTRA1 | EEC-subject4 | Human | Endometrium | EEC | 3.48e-13 | -4.06e-01 | -0.2571 |
| 5654 | HTRA1 | EEC-subject5 | Human | Endometrium | EEC | 2.32e-16 | -4.48e-01 | -0.249 |
| 5654 | HTRA1 | GSM5276934 | Human | Endometrium | EEC | 2.53e-06 | -2.18e-01 | -0.0913 |
| 5654 | HTRA1 | GSM5276935 | Human | Endometrium | EEC | 1.20e-02 | -2.85e-01 | -0.123 |
| 5654 | HTRA1 | GSM5276937 | Human | Endometrium | EEC | 1.97e-12 | -4.10e-01 | -0.0897 |
| 5654 | HTRA1 | GSM6177620_NYU_UCEC1_lib1_lib1 | Human | Endometrium | EEC | 1.23e-23 | -4.07e-01 | -0.1869 |
| 5654 | HTRA1 | GSM6177620_NYU_UCEC1_lib2_lib2 | Human | Endometrium | EEC | 1.98e-23 | -4.24e-01 | -0.1875 |
| 5654 | HTRA1 | GSM6177620_NYU_UCEC1_lib3_lib3 | Human | Endometrium | EEC | 1.84e-21 | -4.58e-01 | -0.1883 |
| 5654 | HTRA1 | GSM6177621_NYU_UCEC2_lib1_lib1 | Human | Endometrium | EEC | 7.20e-20 | -7.10e-02 | -0.1934 |
| 5654 | HTRA1 | GSM6177622_NYU_UCEC3_lib1_lib1 | Human | Endometrium | EEC | 3.80e-37 | -5.60e-01 | -0.1917 |
| 5654 | HTRA1 | GSM6177622_NYU_UCEC3_lib2_lib2 | Human | Endometrium | EEC | 1.61e-38 | -5.60e-01 | -0.1916 |
| 5654 | HTRA1 | GSM6177623_NYU_UCEC3_Vis | Human | Endometrium | EEC | 2.25e-12 | -3.72e-01 | -0.1269 |
| Page: 1 2 3 4 5 6 7 |
| Tissue | Expression Dynamics | Abbreviation |
| Endometrium |  | AEH: Atypical endometrial hyperplasia |
| EEC: Endometrioid Cancer | ||
| Esophagus |  | ESCC: Esophageal squamous cell carcinoma |
| HGIN: High-grade intraepithelial neoplasias | ||
| LGIN: Low-grade intraepithelial neoplasias | ||
| Liver |  | HCC: Hepatocellular carcinoma |
| NAFLD: Non-alcoholic fatty liver disease | ||
| Oral Cavity | 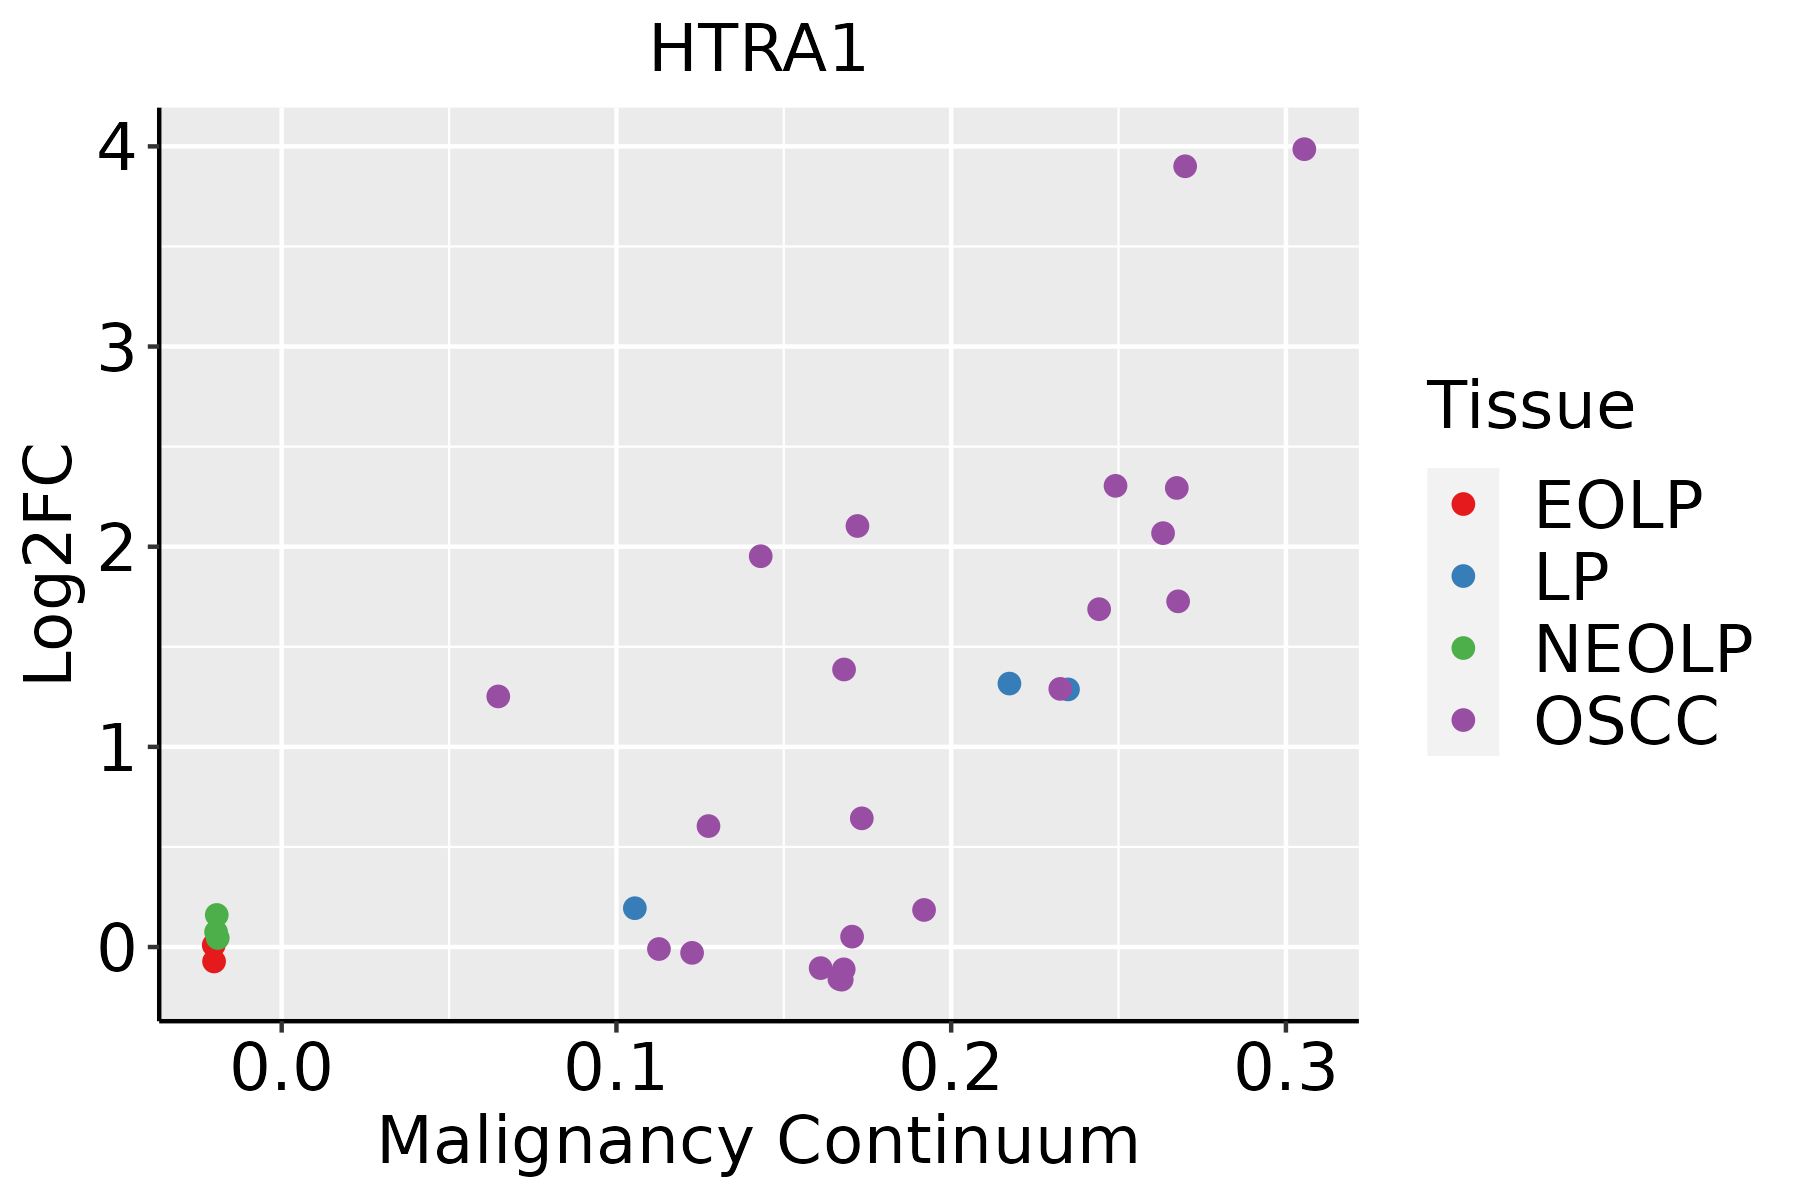 | EOLP: Erosive Oral lichen planus |
| LP: leukoplakia | ||
| NEOLP: Non-erosive oral lichen planus | ||
| OSCC: Oral squamous cell carcinoma | ||
| Prostate | 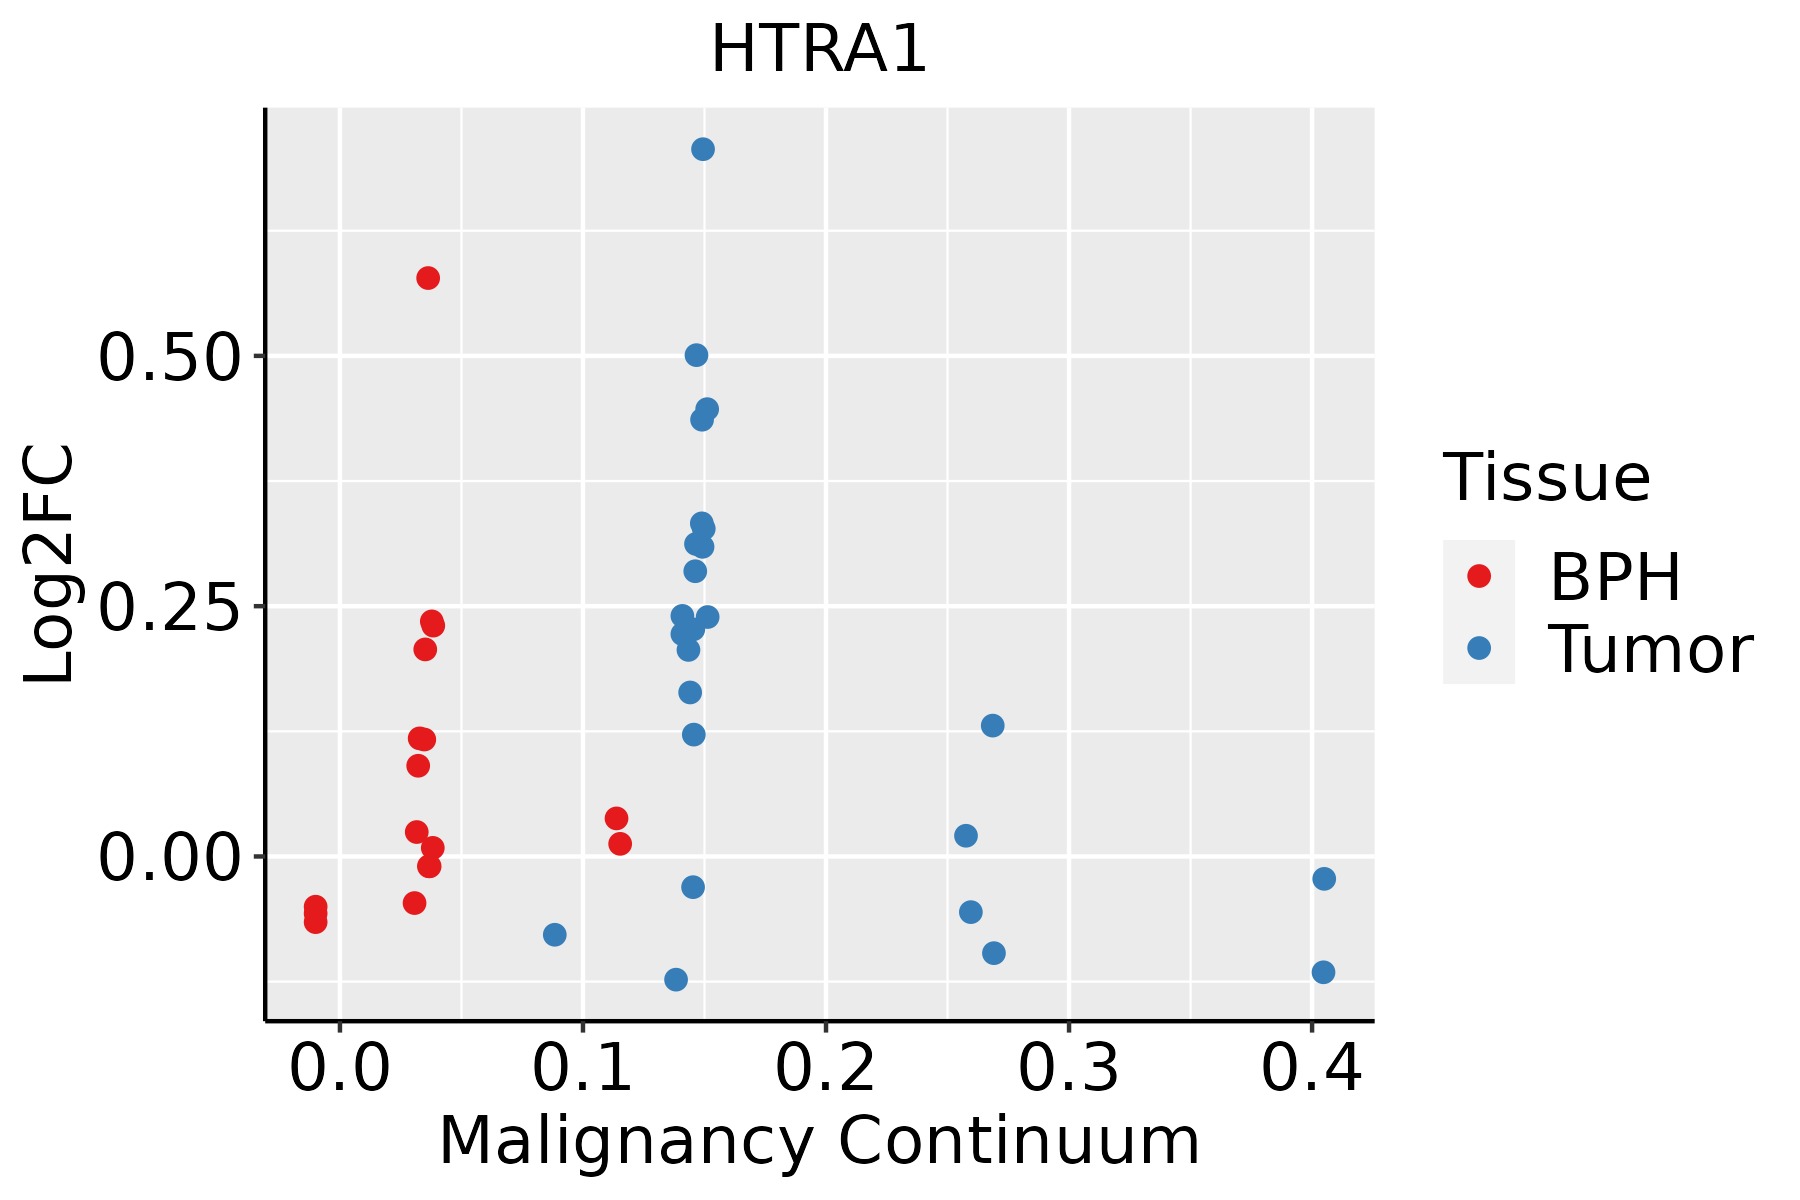 | BPH: Benign Prostatic Hyperplasia |
| Skin |  | AK: Actinic keratosis |
| cSCC: Cutaneous squamous cell carcinoma | ||
| SCCIS:squamous cell carcinoma in situ | ||
| Thyroid | 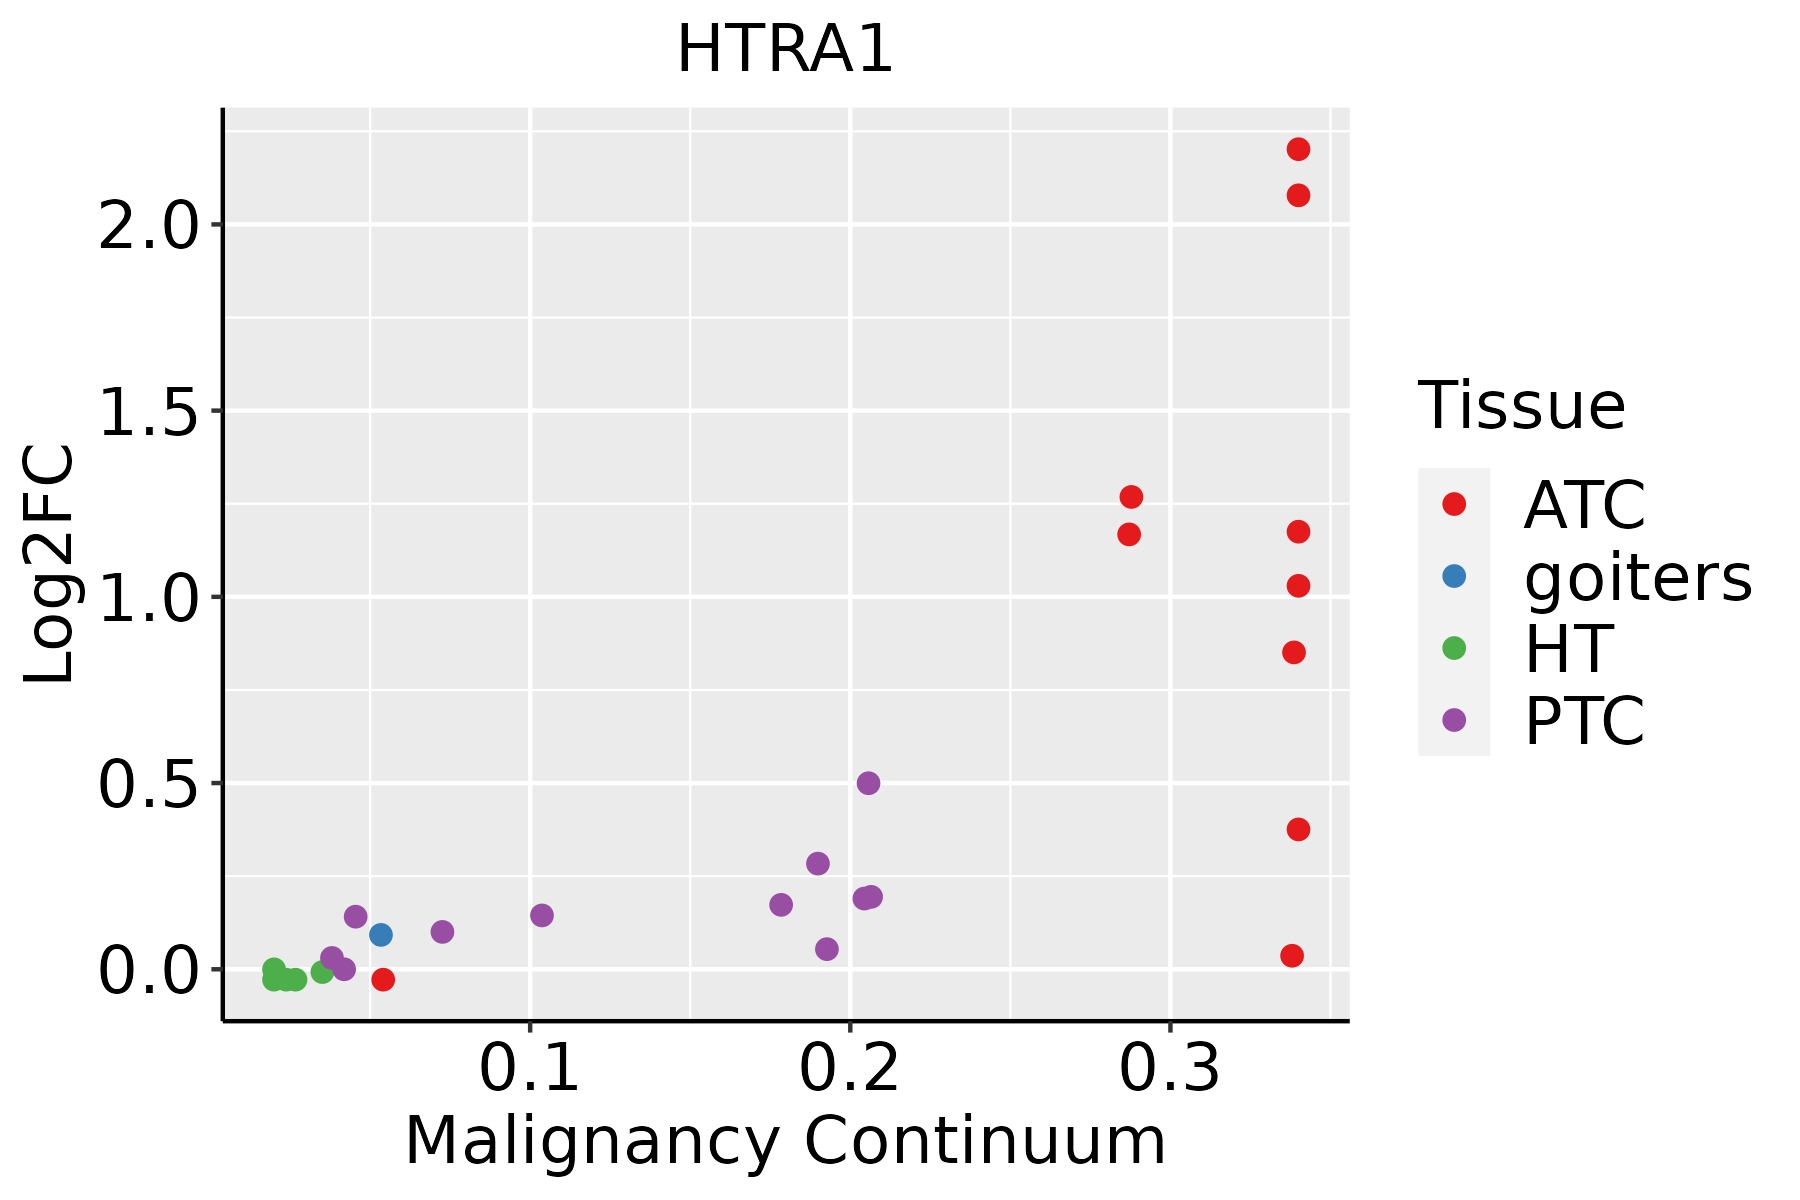 | ATC: Anaplastic thyroid cancer |
| HT: Hashimoto's thyroiditis | ||
| PTC: Papillary thyroid cancer |
| ∗log2FC in expression of this searched gene in stem-like cells from each diseased tissue sample relative to stem-like cells in normal samples in each tissue plotted against the malignancy continuum. Samples are colored based on if they are from different disease stage. |
Top |
Malignant transformation related pathway analysis |
| Find out the enriched GO biological processes and KEGG pathways involved in transition from healthy to precancer to cancer |
| Tissue | Disease Stage | Enriched GO biological Processes |
| Colorectum | AD |  |
| Colorectum | SER |  |
| Colorectum | MSS |  |
| Colorectum | MSI-H |  |
| Colorectum | FAP |  |
| ∗Top 15 enriched GO BP terms are showed in the bar plot of each disease state in each tissue. Each row represents a significant GO biological process which is colored according to the -log10(p.adjust). |
| Page: 1 2 3 4 5 6 7 8 9 |
| GO ID | Tissue | Disease Stage | Description | Gene Ratio | Bg Ratio | pvalue | p.adjust | Count |
| GO:00614589 | Endometrium | AEH | reproductive system development | 88/2100 | 427/18723 | 9.50e-09 | 6.41e-07 | 88 |
| GO:00486089 | Endometrium | AEH | reproductive structure development | 87/2100 | 424/18723 | 1.43e-08 | 9.12e-07 | 87 |
| GO:00018909 | Endometrium | AEH | placenta development | 39/2100 | 144/18723 | 1.07e-07 | 5.20e-06 | 39 |
| GO:00506738 | Endometrium | AEH | epithelial cell proliferation | 84/2100 | 437/18723 | 4.88e-07 | 1.94e-05 | 84 |
| GO:00506788 | Endometrium | AEH | regulation of epithelial cell proliferation | 73/2100 | 381/18723 | 3.04e-06 | 8.44e-05 | 73 |
| GO:00715596 | Endometrium | AEH | response to transforming growth factor beta | 53/2100 | 256/18723 | 7.01e-06 | 1.69e-04 | 53 |
| GO:00071787 | Endometrium | AEH | transmembrane receptor protein serine/threonine kinase signaling pathway | 67/2100 | 355/18723 | 1.28e-05 | 2.80e-04 | 67 |
| GO:00715606 | Endometrium | AEH | cellular response to transforming growth factor beta stimulus | 51/2100 | 250/18723 | 1.59e-05 | 3.32e-04 | 51 |
| GO:00506795 | Endometrium | AEH | positive regulation of epithelial cell proliferation | 43/2100 | 207/18723 | 4.55e-05 | 7.61e-04 | 43 |
| GO:00305092 | Endometrium | AEH | BMP signaling pathway | 32/2100 | 152/18723 | 3.15e-04 | 3.54e-03 | 32 |
| GO:00096159 | Endometrium | AEH | response to virus | 63/2100 | 367/18723 | 3.81e-04 | 4.10e-03 | 63 |
| GO:00071796 | Endometrium | AEH | transforming growth factor beta receptor signaling pathway | 38/2100 | 198/18723 | 6.41e-04 | 6.23e-03 | 38 |
| GO:00717722 | Endometrium | AEH | response to BMP | 32/2100 | 165/18723 | 1.38e-03 | 1.16e-02 | 32 |
| GO:00717732 | Endometrium | AEH | cellular response to BMP stimulus | 32/2100 | 165/18723 | 1.38e-03 | 1.16e-02 | 32 |
| GO:00026838 | Endometrium | AEH | negative regulation of immune system process | 69/2100 | 434/18723 | 1.76e-03 | 1.41e-02 | 69 |
| GO:00900922 | Endometrium | AEH | regulation of transmembrane receptor protein serine/threonine kinase signaling pathway | 43/2100 | 256/18723 | 4.47e-03 | 2.93e-02 | 43 |
| GO:006145815 | Endometrium | EEC | reproductive system development | 91/2168 | 427/18723 | 4.54e-09 | 3.13e-07 | 91 |
| GO:004860814 | Endometrium | EEC | reproductive structure development | 90/2168 | 424/18723 | 6.77e-09 | 4.41e-07 | 90 |
| GO:000189015 | Endometrium | EEC | placenta development | 40/2168 | 144/18723 | 8.31e-08 | 4.23e-06 | 40 |
| GO:005067315 | Endometrium | EEC | epithelial cell proliferation | 83/2168 | 437/18723 | 3.38e-06 | 9.14e-05 | 83 |
| Page: 1 2 3 4 5 6 7 8 9 10 11 12 |
| Pathway ID | Tissue | Disease Stage | Description | Gene Ratio | Bg Ratio | pvalue | p.adjust | qvalue | Count |
| Page: 1 |
Top |
Cell-cell communication analysis |
| Identification of potential cell-cell interactions between two cell types and their ligand-receptor pairs for different disease states |
| Ligand | Receptor | LRpair | Pathway | Tissue | Disease Stage |
| Page: 1 |
Top |
Single-cell gene regulatory network inference analysis |
| Find out the significant the regulons (TFs) and the target genes of each regulon across cell types for different disease states |
| TF | Cell Type | Tissue | Disease Stage | Target Gene | RSS | Regulon Activity |
| ∗The dot plots of a searched regulon are shown for all cell subpopulations in each disease state of each tissue based on the regulon specific score inferred using pySCENIC and by calculating the average expression. |
| Page: 1 |
Top |
Somatic mutation of malignant transformation related genes |
| Annotation of somatic variants for genes involved in malignant transformation |
| Hugo Symbol | Variant Class | Variant Classification | dbSNP RS | HGVSc | HGVSp | HGVSp Short | SWISSPROT | BIOTYPE | SIFT | PolyPhen | Tumor Sample Barcode | Tissue | Histology | Sex | Age | Stage | Therapy Types | Drugs | Outcome |
| HTRA1 | SNV | Missense_Mutation | c.1367N>T | p.Ser456Ile | p.S456I | Q92743 | protein_coding | deleterious(0.03) | benign(0.396) | TCGA-AC-A2FG-01 | Breast | breast invasive carcinoma | Female | >=65 | I/II | Hormone Therapy | arimidex | CR | |
| HTRA1 | SNV | Missense_Mutation | rs750423045 | c.806N>A | p.Arg269His | p.R269H | Q92743 | protein_coding | tolerated(0.42) | benign(0.023) | TCGA-BH-A0HF-01 | Breast | breast invasive carcinoma | Female | >=65 | I/II | Hormone Therapy | arimidex | SD |
| HTRA1 | SNV | Missense_Mutation | rs773859508 | c.1157N>A | p.Arg386Gln | p.R386Q | Q92743 | protein_coding | tolerated(0.06) | possibly_damaging(0.458) | TCGA-EW-A1IY-01 | Breast | breast invasive carcinoma | Female | <65 | I/II | Chemotherapy | taxotere | SD |
| HTRA1 | SNV | Missense_Mutation | rs751200867 | c.1297G>A | p.Val433Ile | p.V433I | Q92743 | protein_coding | tolerated(0.46) | benign(0.13) | TCGA-GM-A2DB-01 | Breast | breast invasive carcinoma | Female | <65 | I/II | Chemotherapy | taxol | CR |
| HTRA1 | insertion | Frame_Shift_Ins | novel | c.755_756insTCCTTTAT | p.Leu253ProfsTer48 | p.L253Pfs*48 | Q92743 | protein_coding | TCGA-DS-A1OB-01 | Cervix | cervical & endocervical cancer | Female | <65 | I/II | Chemotherapy | carboplatin | PD | ||
| HTRA1 | SNV | Missense_Mutation | rs587776445 | c.821N>A | p.Arg274Gln | p.R274Q | Q92743 | protein_coding | tolerated(0.05) | possibly_damaging(0.899) | TCGA-A6-5661-01 | Colorectum | colon adenocarcinoma | Female | >=65 | I/II | Unknown | Unknown | SD |
| HTRA1 | SNV | Missense_Mutation | rs587776449 | c.961N>A | p.Ala321Thr | p.A321T | Q92743 | protein_coding | deleterious(0.02) | probably_damaging(1) | TCGA-AA-3663-01 | Colorectum | colon adenocarcinoma | Male | <65 | I/II | Unknown | Unknown | SD |
| HTRA1 | SNV | Missense_Mutation | c.743N>C | p.Lys248Thr | p.K248T | Q92743 | protein_coding | deleterious(0) | possibly_damaging(0.697) | TCGA-AA-3819-01 | Colorectum | colon adenocarcinoma | Female | <65 | I/II | Unknown | Unknown | SD | |
| HTRA1 | SNV | Missense_Mutation | c.1322N>T | p.Ser441Phe | p.S441F | Q92743 | protein_coding | deleterious(0) | possibly_damaging(0.656) | TCGA-AA-3977-01 | Colorectum | colon adenocarcinoma | Male | >=65 | I/II | Unknown | Unknown | SD | |
| HTRA1 | SNV | Missense_Mutation | c.568N>T | p.Arg190Cys | p.R190C | Q92743 | protein_coding | tolerated(0.18) | probably_damaging(0.938) | TCGA-AA-3980-01 | Colorectum | colon adenocarcinoma | Female | >=65 | I/II | Unknown | Unknown | SD |
| Page: 1 2 3 4 5 6 |
Top |
Related drugs of malignant transformation related genes |
| Identification of chemicals and drugs interact with genes involved in malignant transfromation |
| (DGIdb 4.0) |
| Entrez ID | Symbol | Category | Interaction Types | Drug Claim Name | Drug Name | PMIDs |
| 5654 | HTRA1 | ENZYME, DRUGGABLE GENOME, PROTEASE | bevacizumab | BEVACIZUMAB | 22594510,23559864,23842101,23337555 | |
| 5654 | HTRA1 | ENZYME, DRUGGABLE GENOME, PROTEASE | ranibizumab | RANIBIZUMAB | 22594510,23559864,23842101,23337555 | |
| 5654 | HTRA1 | ENZYME, DRUGGABLE GENOME, PROTEASE | HYDROGEN PEROXIDE | 10517331 |
| Page: 1 |

Copyright 2023-Present -The University of Texas Health Science Center at Houston |