| Tissue | Expression Dynamics | Abbreviation |
| Breast | 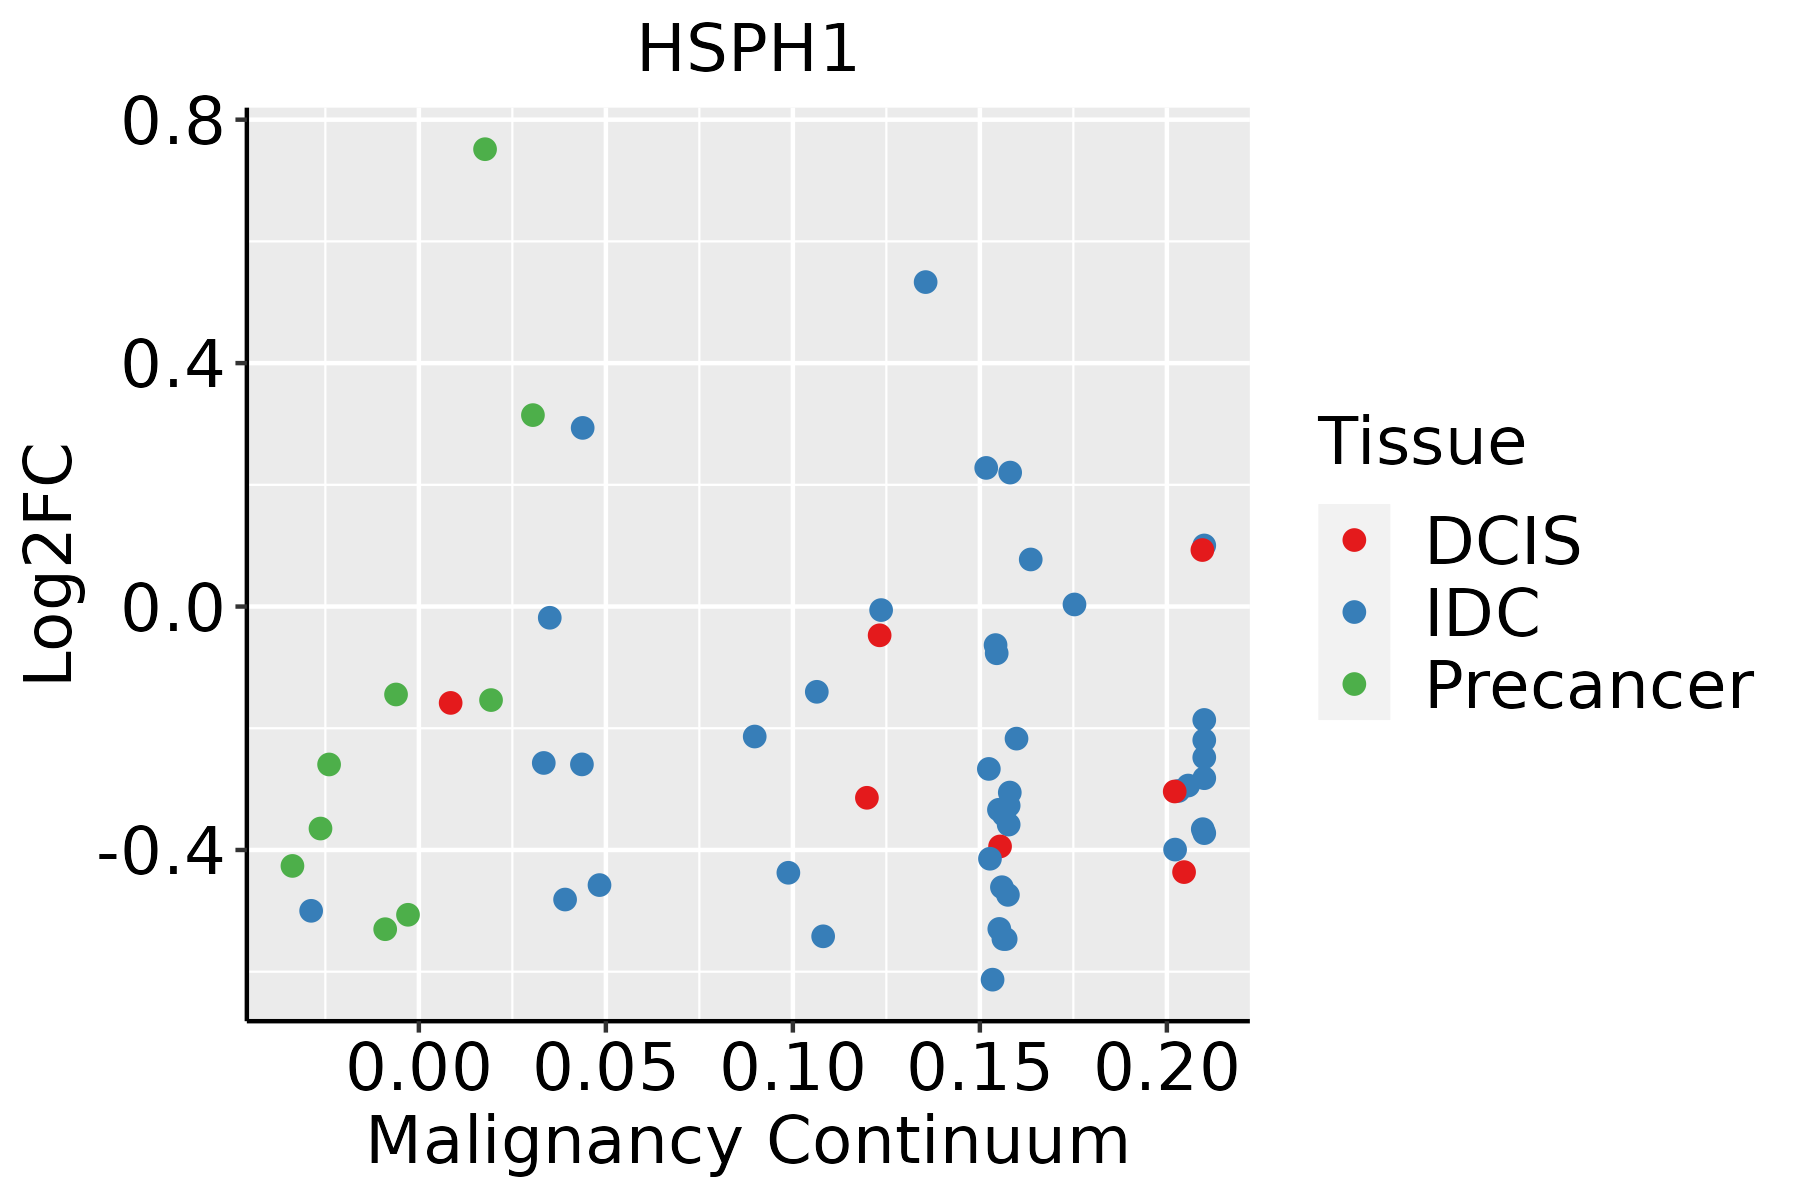 | IDC: Invasive ductal carcinoma |
| DCIS: Ductal carcinoma in situ |
| Precancer(BRCA1-mut): Precancerous lesion from BRCA1 mutation carriers |
| Cervix | 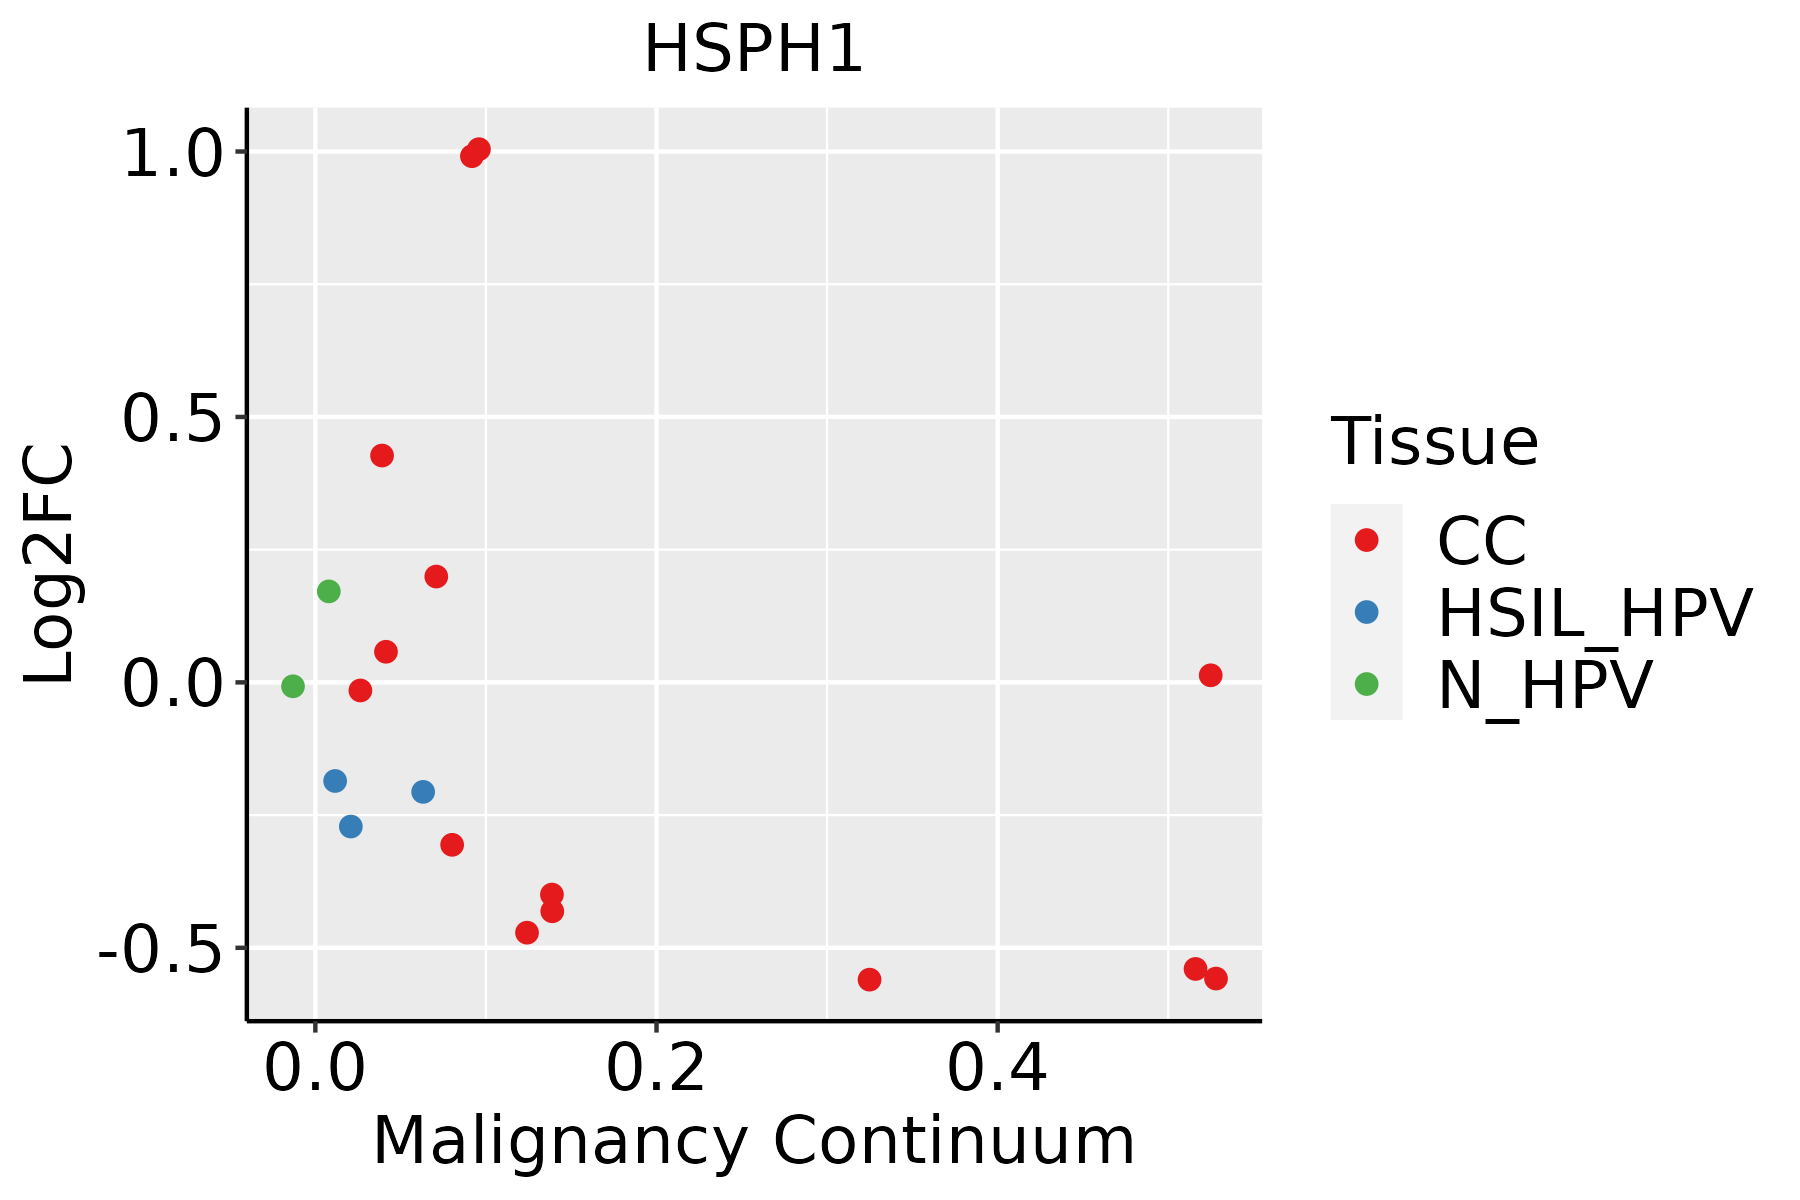 | CC: Cervix cancer |
| HSIL_HPV: HPV-infected high-grade squamous intraepithelial lesions |
| N_HPV: HPV-infected normal cervix |
| Colorectum (GSE201348) |  | FAP: Familial adenomatous polyposis |
| CRC: Colorectal cancer |
| Colorectum (HTA11) |  | AD: Adenomas |
| SER: Sessile serrated lesions |
| MSI-H: Microsatellite-high colorectal cancer |
| MSS: Microsatellite stable colorectal cancer |
| Endometrium |  | AEH: Atypical endometrial hyperplasia |
| EEC: Endometrioid Cancer |
| Esophagus | 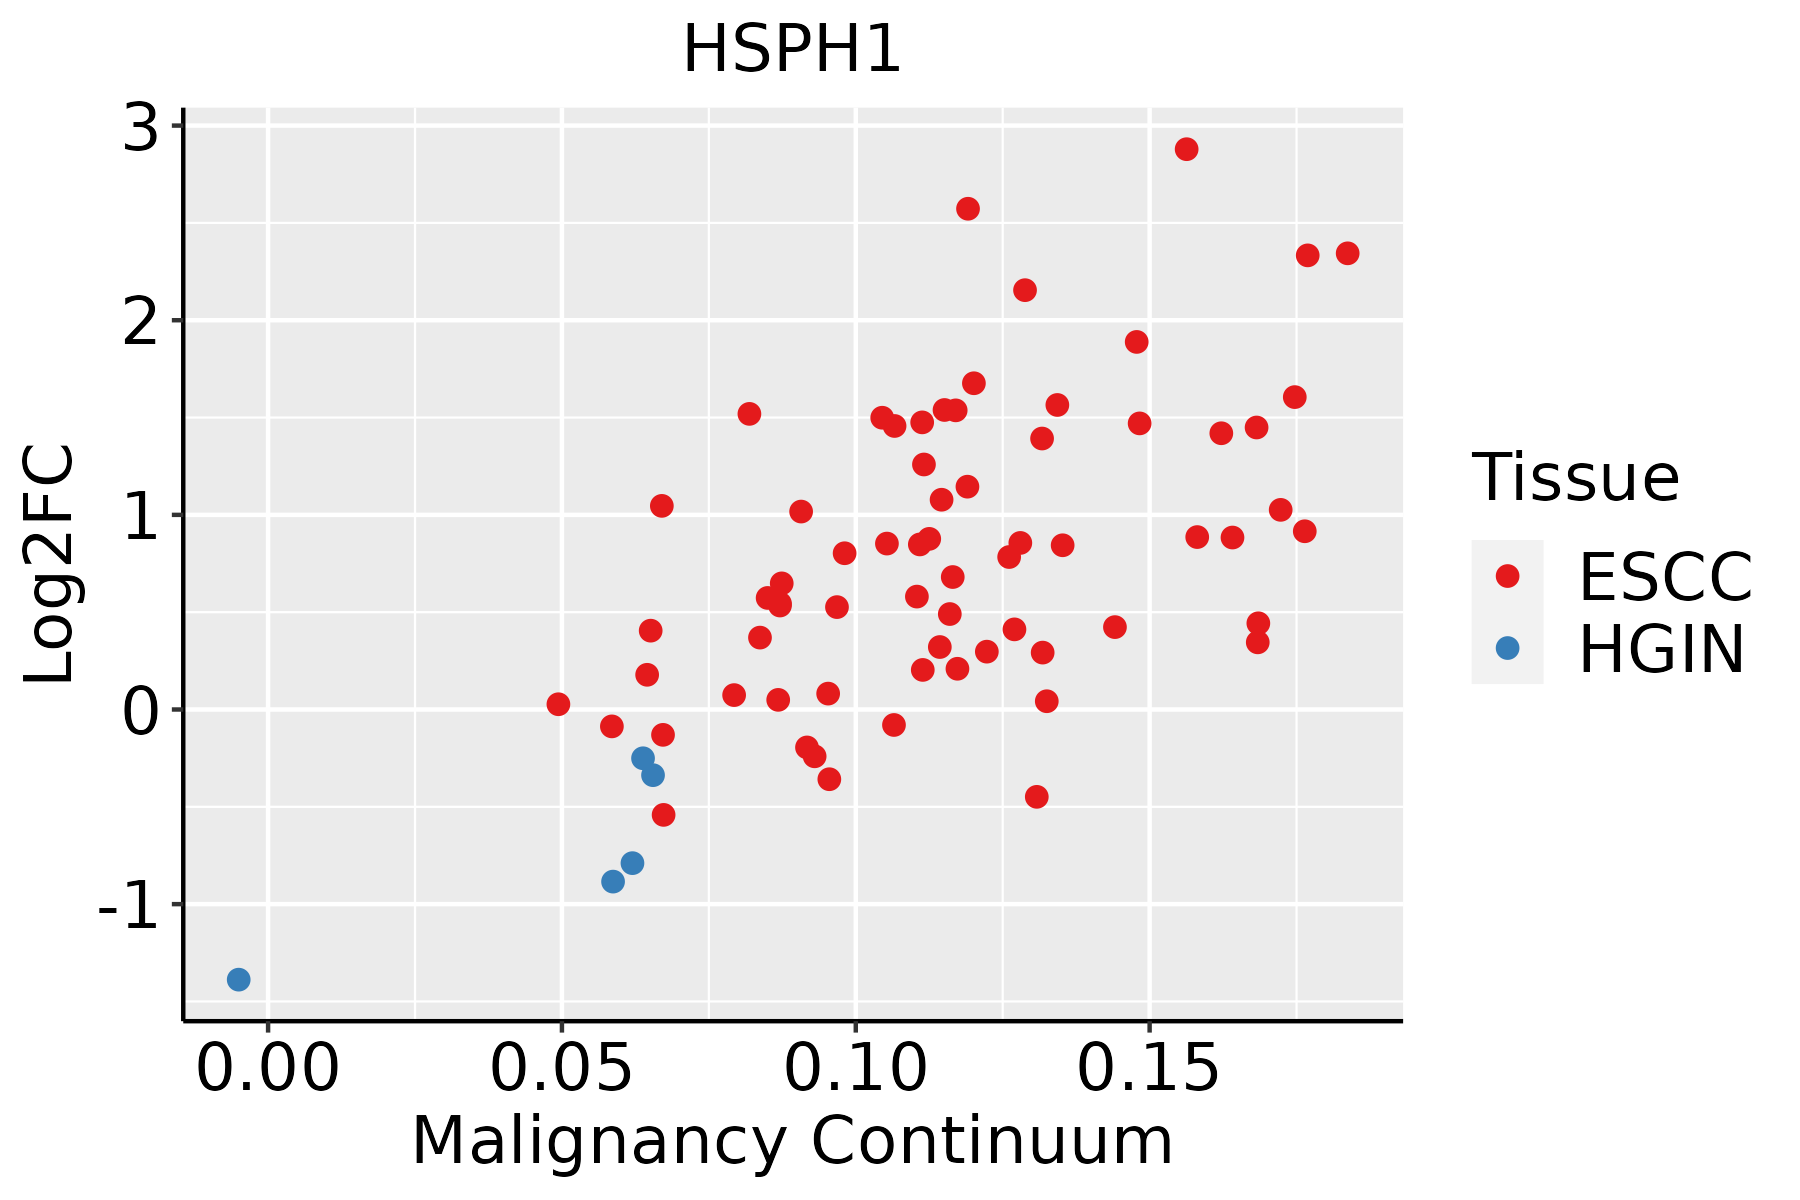 | ESCC: Esophageal squamous cell carcinoma |
| HGIN: High-grade intraepithelial neoplasias |
| LGIN: Low-grade intraepithelial neoplasias |
| GC |  | CAG: Chronic atrophic gastritis |
| CAG with IM: Chronic atrophic gastritis with intestinal metaplasia |
| CSG: Chronic superficial gastritis |
| GC: Gastric cancer |
| SIM: Severe intestinal metaplasia |
| WIM: Wild intestinal metaplasia |
| Liver | 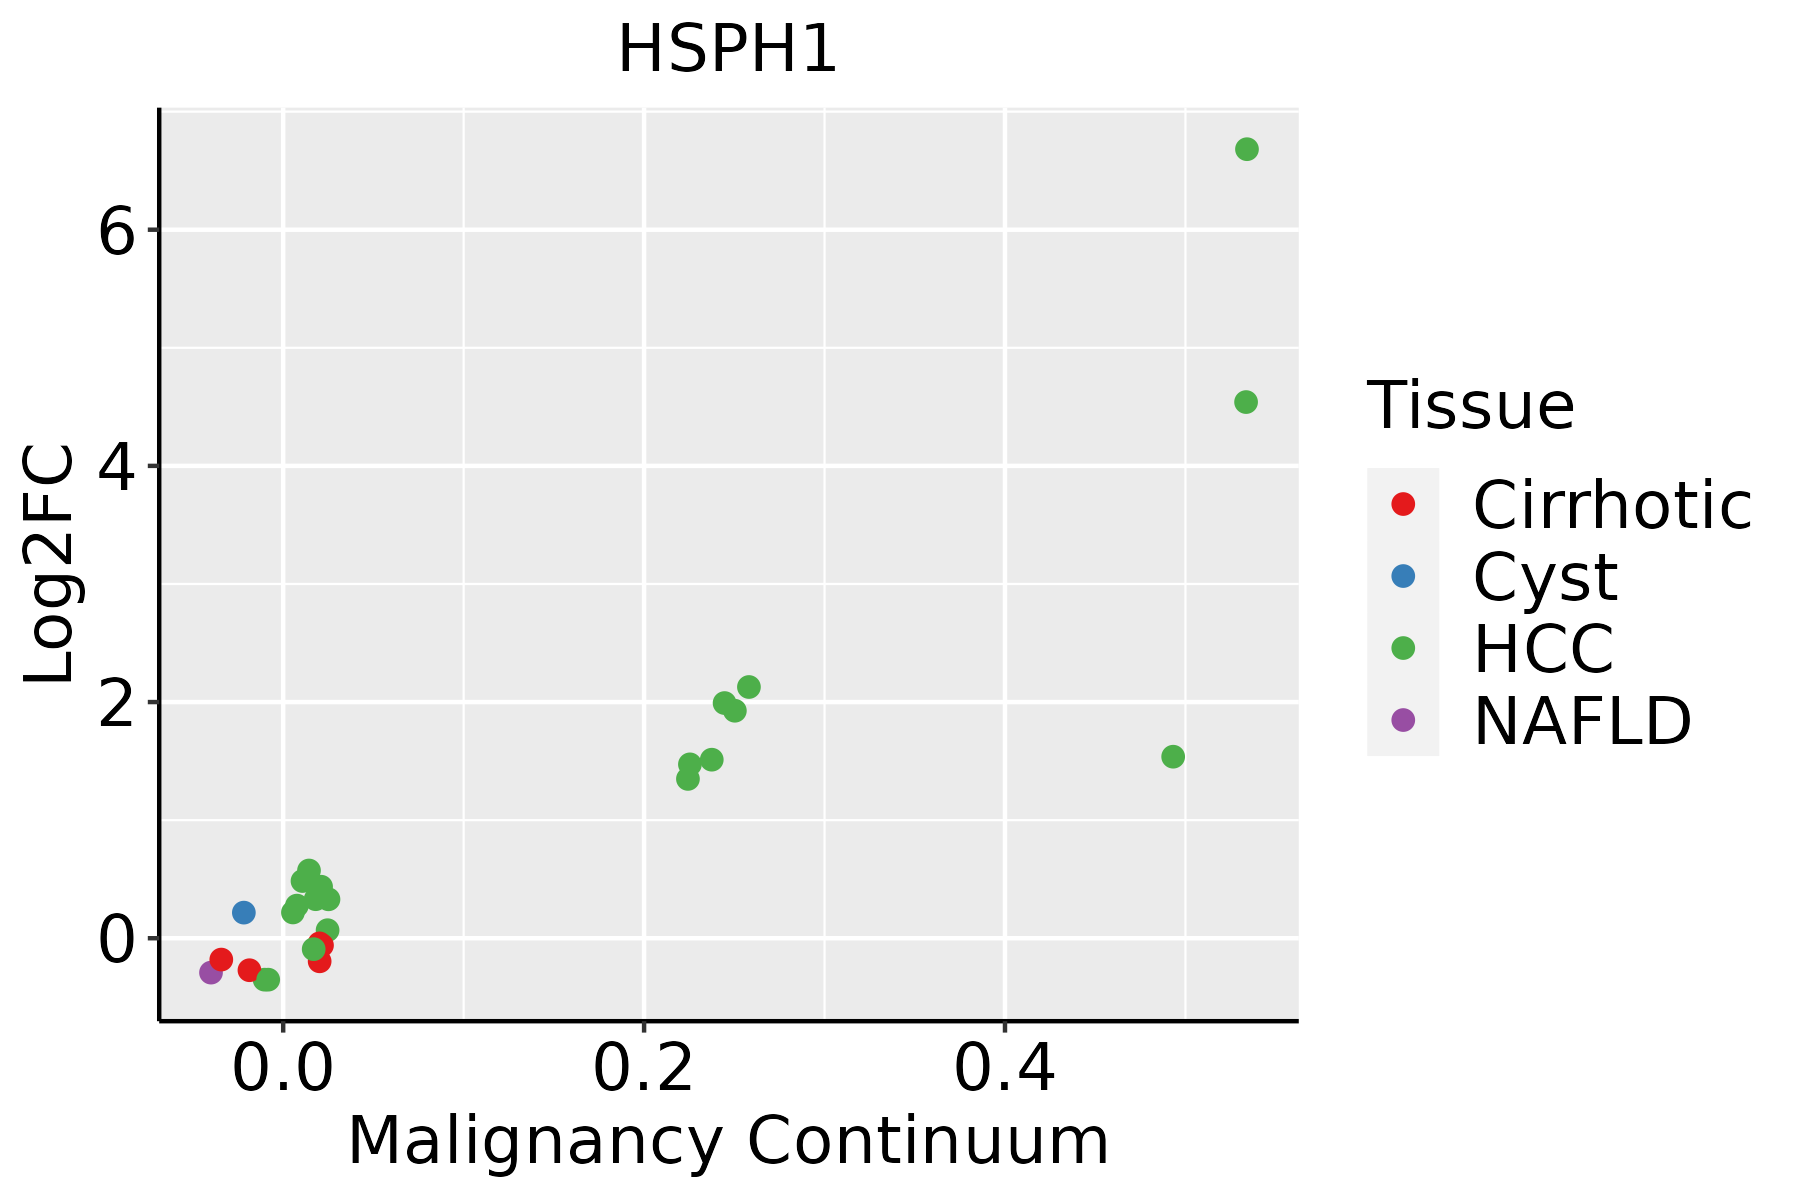 | HCC: Hepatocellular carcinoma |
| NAFLD: Non-alcoholic fatty liver disease |
| Lung | 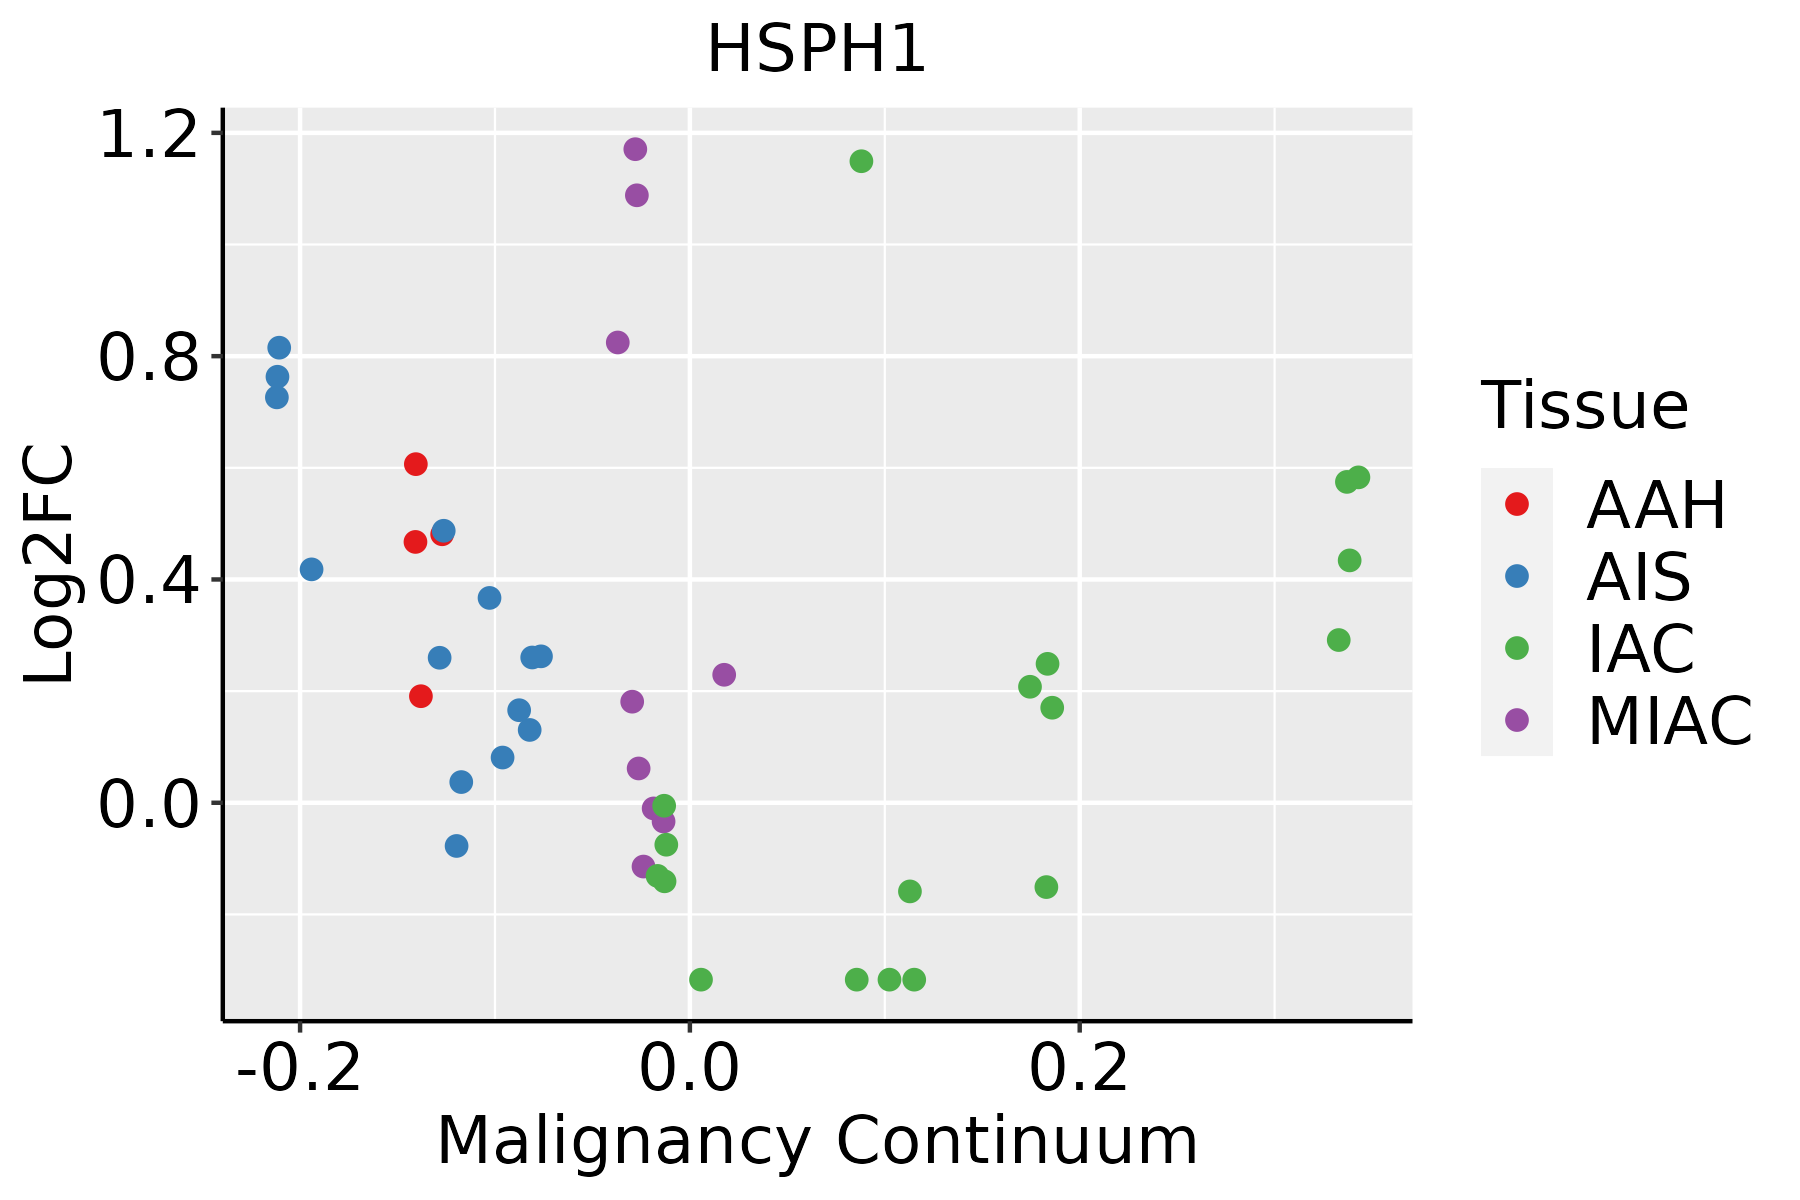 | AAH: Atypical adenomatous hyperplasia |
| AIS: Adenocarcinoma in situ |
| IAC: Invasive lung adenocarcinoma |
| MIA: Minimally invasive adenocarcinoma |
| Oral Cavity | 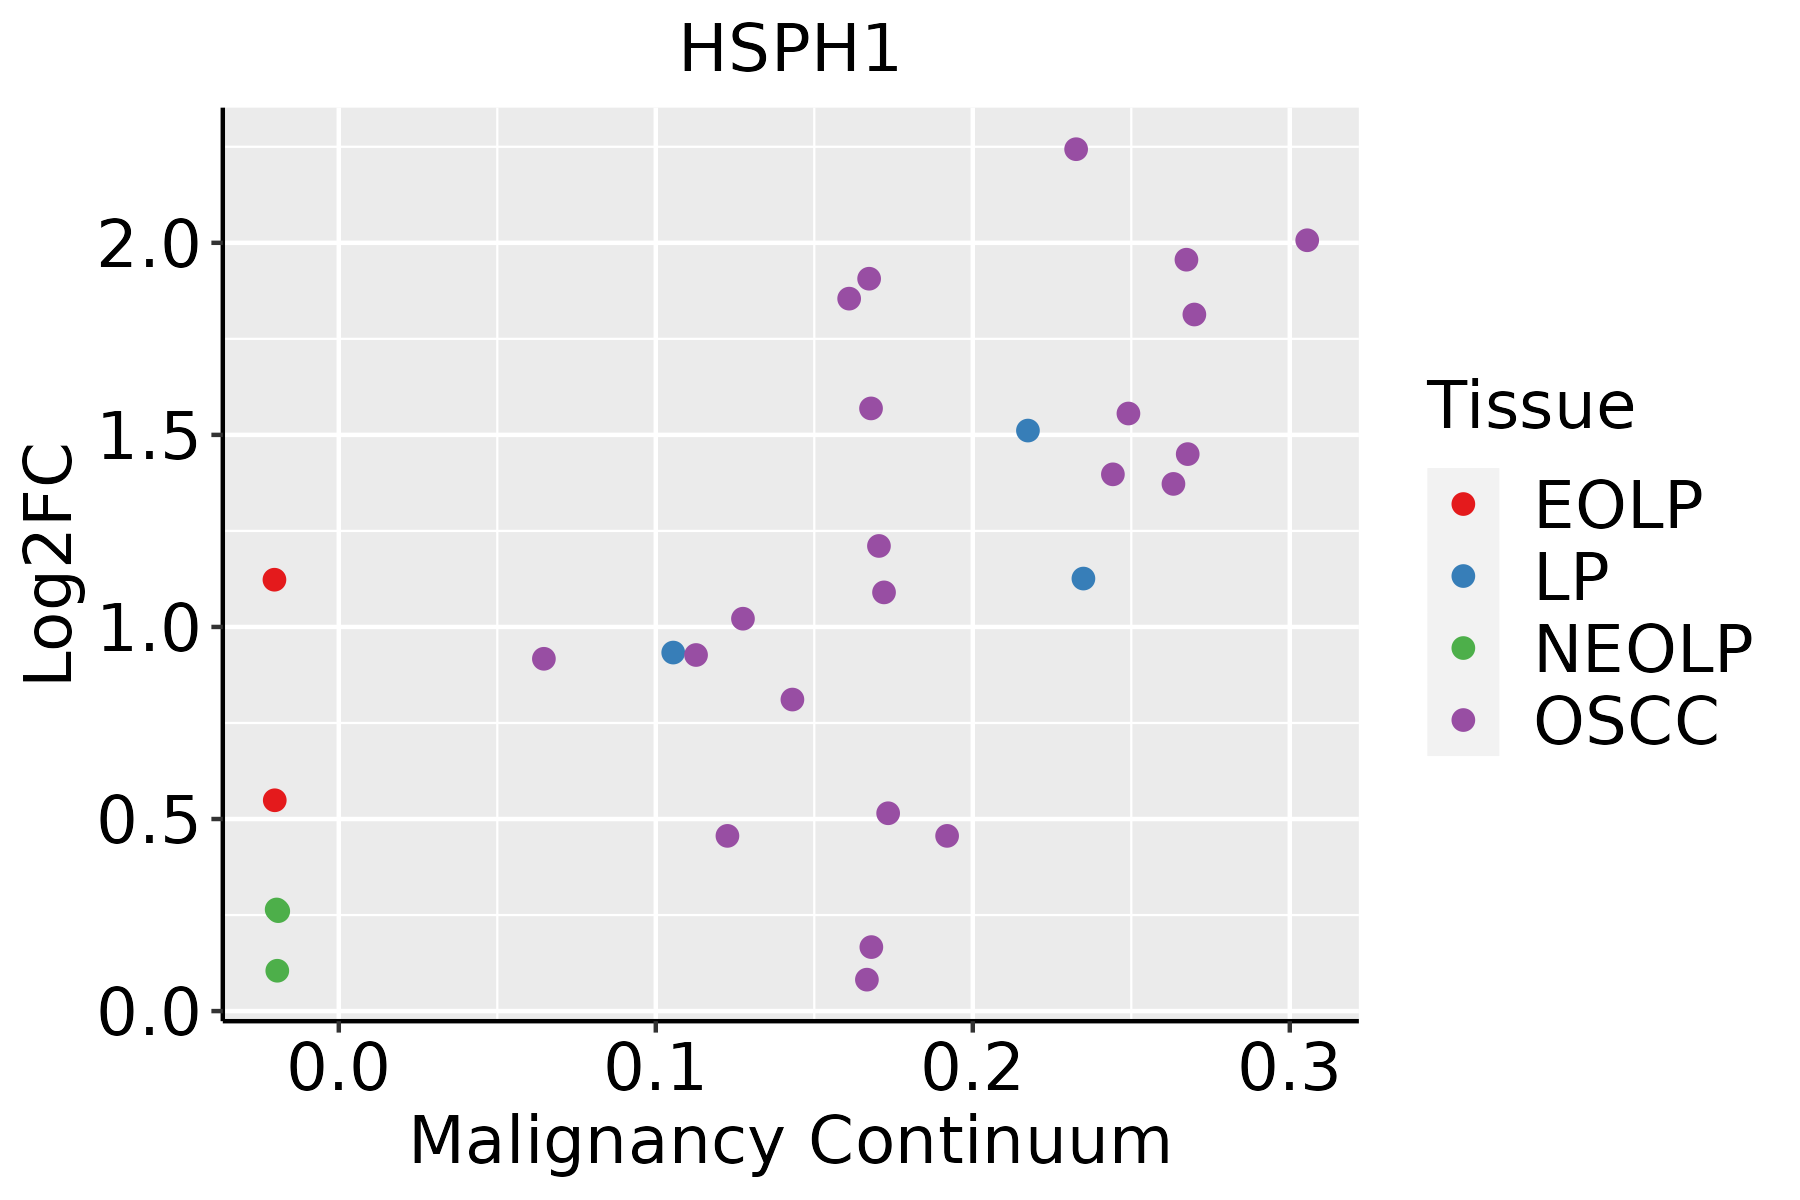 | EOLP: Erosive Oral lichen planus |
| LP: leukoplakia |
| NEOLP: Non-erosive oral lichen planus |
| OSCC: Oral squamous cell carcinoma |
| Prostate | 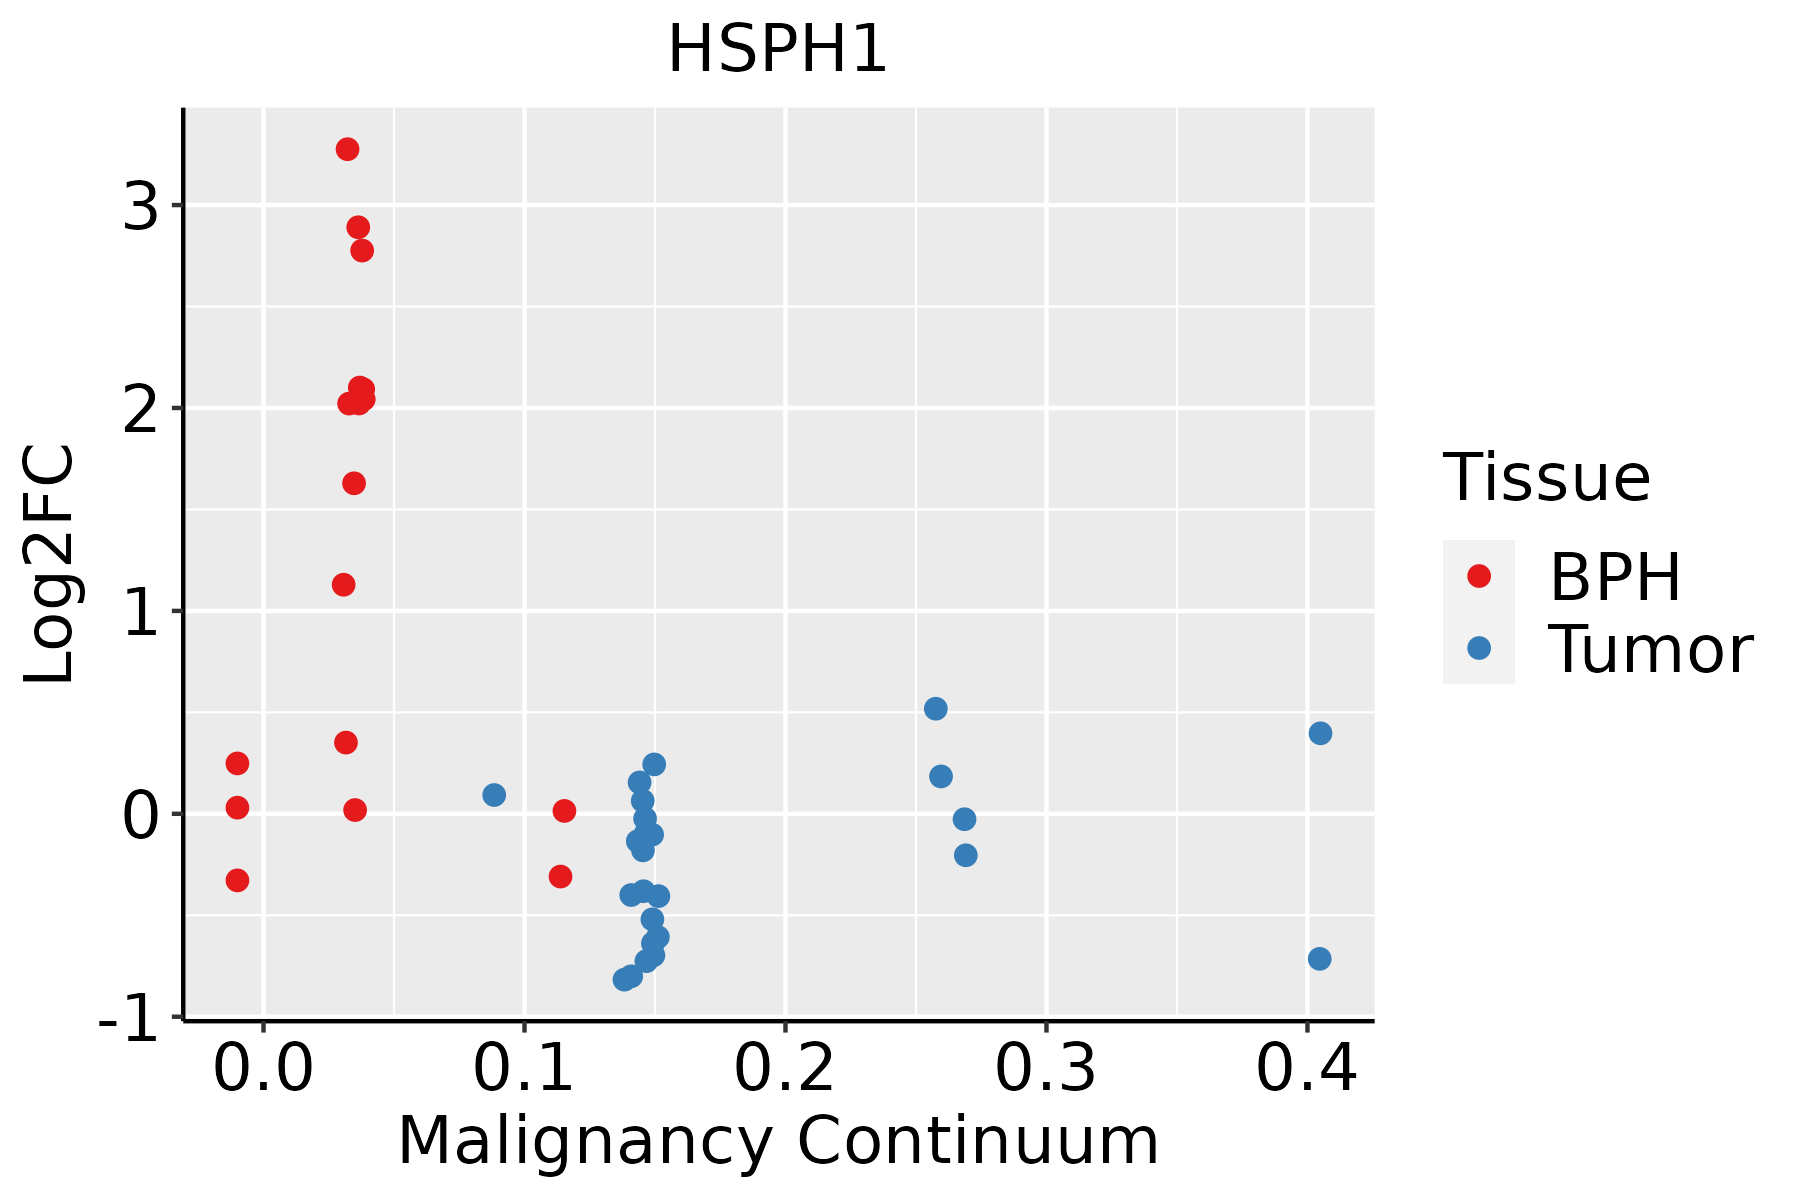 | BPH: Benign Prostatic Hyperplasia |
| Skin | 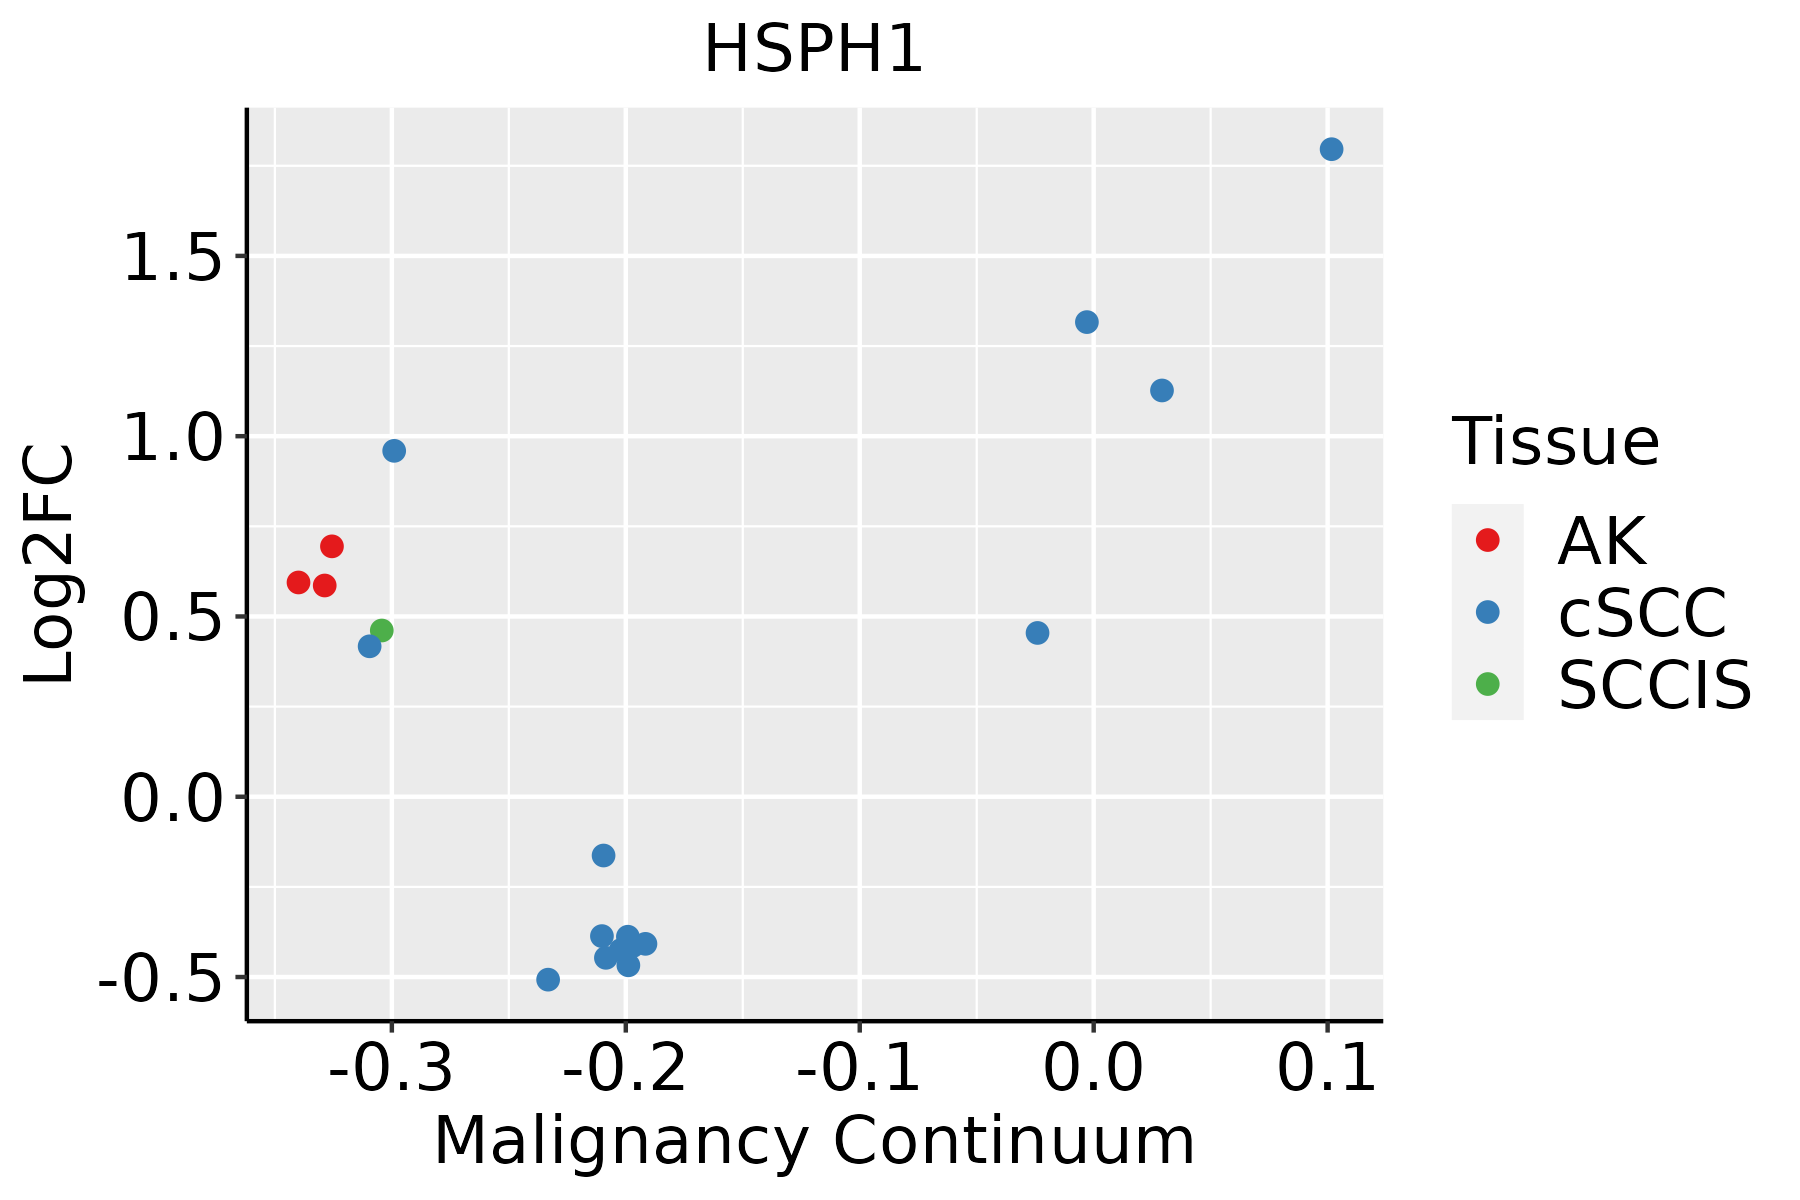 | AK: Actinic keratosis |
| cSCC: Cutaneous squamous cell carcinoma |
| SCCIS:squamous cell carcinoma in situ |
| Thyroid |  | ATC: Anaplastic thyroid cancer |
| HT: Hashimoto's thyroiditis |
| PTC: Papillary thyroid cancer |
| GO ID | Tissue | Disease Stage | Description | Gene Ratio | Bg Ratio | pvalue | p.adjust | Count |
| GO:00064578 | Breast | Precancer | protein folding | 43/1080 | 212/18723 | 3.48e-13 | 7.45e-11 | 43 |
| GO:00064588 | Breast | Precancer | 'de novo' protein folding | 16/1080 | 43/18723 | 8.14e-10 | 6.92e-08 | 16 |
| GO:00069869 | Breast | Precancer | response to unfolded protein | 28/1080 | 137/18723 | 3.81e-09 | 3.00e-07 | 28 |
| GO:00610778 | Breast | Precancer | chaperone-mediated protein folding | 19/1080 | 67/18723 | 4.22e-09 | 3.28e-07 | 19 |
| GO:00510848 | Breast | Precancer | 'de novo' posttranslational protein folding | 14/1080 | 39/18723 | 1.61e-08 | 1.12e-06 | 14 |
| GO:00510858 | Breast | Precancer | chaperone cofactor-dependent protein refolding | 13/1080 | 34/18723 | 2.17e-08 | 1.47e-06 | 13 |
| GO:00359669 | Breast | Precancer | response to topologically incorrect protein | 29/1080 | 159/18723 | 3.00e-08 | 1.89e-06 | 29 |
| GO:00457859 | Breast | Precancer | positive regulation of cell adhesion | 52/1080 | 437/18723 | 5.74e-07 | 2.49e-05 | 52 |
| GO:00421107 | Breast | Precancer | T cell activation | 52/1080 | 487/18723 | 1.37e-05 | 3.42e-04 | 52 |
| GO:00508707 | Breast | Precancer | positive regulation of T cell activation | 29/1080 | 216/18723 | 1.94e-05 | 4.58e-04 | 29 |
| GO:19030396 | Breast | Precancer | positive regulation of leukocyte cell-cell adhesion | 30/1080 | 239/18723 | 5.13e-05 | 1.07e-03 | 30 |
| GO:00508637 | Breast | Precancer | regulation of T cell activation | 37/1080 | 329/18723 | 8.04e-05 | 1.56e-03 | 37 |
| GO:00224098 | Breast | Precancer | positive regulation of cell-cell adhesion | 33/1080 | 284/18723 | 1.03e-04 | 1.89e-03 | 33 |
| GO:00071597 | Breast | Precancer | leukocyte cell-cell adhesion | 40/1080 | 371/18723 | 1.07e-04 | 1.94e-03 | 40 |
| GO:00224079 | Breast | Precancer | regulation of cell-cell adhesion | 45/1080 | 448/18723 | 2.12e-04 | 3.30e-03 | 45 |
| GO:19030377 | Breast | Precancer | regulation of leukocyte cell-cell adhesion | 36/1080 | 336/18723 | 2.61e-04 | 3.84e-03 | 36 |
| GO:000645713 | Breast | IDC | protein folding | 47/1434 | 212/18723 | 2.31e-11 | 3.86e-09 | 47 |
| GO:006107713 | Breast | IDC | chaperone-mediated protein folding | 21/1434 | 67/18723 | 1.35e-08 | 9.71e-07 | 21 |
| GO:000645813 | Breast | IDC | 'de novo' protein folding | 16/1434 | 43/18723 | 4.69e-08 | 3.02e-06 | 16 |
| GO:000698614 | Breast | IDC | response to unfolded protein | 30/1434 | 137/18723 | 1.24e-07 | 7.03e-06 | 30 |
| Pathway ID | Tissue | Disease Stage | Description | Gene Ratio | Bg Ratio | pvalue | p.adjust | qvalue | Count |
| hsa0414118 | Breast | Precancer | Protein processing in endoplasmic reticulum | 33/684 | 174/8465 | 2.78e-06 | 3.83e-05 | 2.94e-05 | 33 |
| hsa0414119 | Breast | Precancer | Protein processing in endoplasmic reticulum | 33/684 | 174/8465 | 2.78e-06 | 3.83e-05 | 2.94e-05 | 33 |
| hsa0414124 | Breast | IDC | Protein processing in endoplasmic reticulum | 36/867 | 174/8465 | 2.73e-05 | 2.86e-04 | 2.14e-04 | 36 |
| hsa0414134 | Breast | IDC | Protein processing in endoplasmic reticulum | 36/867 | 174/8465 | 2.73e-05 | 2.86e-04 | 2.14e-04 | 36 |
| hsa0414143 | Breast | DCIS | Protein processing in endoplasmic reticulum | 36/846 | 174/8465 | 1.60e-05 | 1.91e-04 | 1.41e-04 | 36 |
| hsa0414153 | Breast | DCIS | Protein processing in endoplasmic reticulum | 36/846 | 174/8465 | 1.60e-05 | 1.91e-04 | 1.41e-04 | 36 |
| hsa0414120 | Cervix | CC | Protein processing in endoplasmic reticulum | 55/1267 | 174/8465 | 1.74e-08 | 2.68e-07 | 1.58e-07 | 55 |
| hsa04141110 | Cervix | CC | Protein processing in endoplasmic reticulum | 55/1267 | 174/8465 | 1.74e-08 | 2.68e-07 | 1.58e-07 | 55 |
| hsa0414144 | Cervix | N_HPV | Protein processing in endoplasmic reticulum | 21/349 | 174/8465 | 8.84e-06 | 1.09e-04 | 8.55e-05 | 21 |
| hsa0414154 | Cervix | N_HPV | Protein processing in endoplasmic reticulum | 21/349 | 174/8465 | 8.84e-06 | 1.09e-04 | 8.55e-05 | 21 |
| hsa041414 | Colorectum | MSS | Protein processing in endoplasmic reticulum | 75/1875 | 174/8465 | 3.78e-10 | 8.44e-09 | 5.17e-09 | 75 |
| hsa041415 | Colorectum | MSS | Protein processing in endoplasmic reticulum | 75/1875 | 174/8465 | 3.78e-10 | 8.44e-09 | 5.17e-09 | 75 |
| hsa0414126 | Endometrium | AEH | Protein processing in endoplasmic reticulum | 62/1197 | 174/8465 | 5.97e-13 | 1.39e-11 | 1.01e-11 | 62 |
| hsa04141111 | Endometrium | AEH | Protein processing in endoplasmic reticulum | 62/1197 | 174/8465 | 5.97e-13 | 1.39e-11 | 1.01e-11 | 62 |
| hsa0414127 | Endometrium | EEC | Protein processing in endoplasmic reticulum | 64/1237 | 174/8465 | 2.17e-13 | 5.09e-12 | 3.80e-12 | 64 |
| hsa0414136 | Endometrium | EEC | Protein processing in endoplasmic reticulum | 64/1237 | 174/8465 | 2.17e-13 | 5.09e-12 | 3.80e-12 | 64 |
| hsa0414139 | Esophagus | HGIN | Protein processing in endoplasmic reticulum | 67/1383 | 174/8465 | 1.06e-12 | 2.16e-11 | 1.72e-11 | 67 |
| hsa04141114 | Esophagus | HGIN | Protein processing in endoplasmic reticulum | 67/1383 | 174/8465 | 1.06e-12 | 2.16e-11 | 1.72e-11 | 67 |
| hsa04141211 | Esophagus | ESCC | Protein processing in endoplasmic reticulum | 147/4205 | 174/8465 | 3.29e-22 | 1.10e-19 | 5.64e-20 | 147 |
| hsa04141310 | Esophagus | ESCC | Protein processing in endoplasmic reticulum | 147/4205 | 174/8465 | 3.29e-22 | 1.10e-19 | 5.64e-20 | 147 |
| Hugo Symbol | Variant Class | Variant Classification | dbSNP RS | HGVSc | HGVSp | HGVSp Short | SWISSPROT | BIOTYPE | SIFT | PolyPhen | Tumor Sample Barcode | Tissue | Histology | Sex | Age | Stage | Therapy Types | Drugs | Outcome |
| HSPH1 | SNV | Missense_Mutation | novel | c.1742N>C | p.Asp581Ala | p.D581A | Q92598 | protein_coding | tolerated(0.05) | possibly_damaging(0.627) | TCGA-A2-A1G4-01 | Breast | breast invasive carcinoma | Female | >=65 | III/IV | Chemotherapy | adriamycin | SD |
| HSPH1 | SNV | Missense_Mutation | novel | c.1077N>A | p.Phe359Leu | p.F359L | Q92598 | protein_coding | deleterious(0.05) | possibly_damaging(0.897) | TCGA-AN-A046-01 | Breast | breast invasive carcinoma | Female | >=65 | I/II | Unknown | Unknown | SD |
| HSPH1 | SNV | Missense_Mutation | novel | c.1742A>C | p.Asp581Ala | p.D581A | Q92598 | protein_coding | tolerated(0.05) | possibly_damaging(0.627) | TCGA-AO-A1KT-01 | Breast | breast invasive carcinoma | Female | >=65 | I/II | Chemotherapy | fluorouracil | SD |
| HSPH1 | SNV | Missense_Mutation | novel | c.1742N>C | p.Asp581Ala | p.D581A | Q92598 | protein_coding | tolerated(0.05) | possibly_damaging(0.627) | TCGA-B6-A1KF-01 | Breast | breast invasive carcinoma | Female | >=65 | I/II | Unknown | Unknown | SD |
| HSPH1 | SNV | Missense_Mutation | | c.1869N>T | p.Met623Ile | p.M623I | Q92598 | protein_coding | deleterious(0.02) | probably_damaging(0.968) | TCGA-B6-A1KN-01 | Breast | breast invasive carcinoma | Female | <65 | III/IV | Unknown | Unknown | SD |
| HSPH1 | SNV | Missense_Mutation | | c.1420G>C | p.Asp474His | p.D474H | Q92598 | protein_coding | deleterious(0) | probably_damaging(0.973) | TCGA-BH-A0W7-01 | Breast | breast invasive carcinoma | Female | <65 | I/II | Chemotherapy | taxotere | CR |
| HSPH1 | SNV | Missense_Mutation | novel | c.1742N>C | p.Asp581Ala | p.D581A | Q92598 | protein_coding | tolerated(0.05) | possibly_damaging(0.627) | TCGA-BH-A1F2-01 | Breast | breast invasive carcinoma | Female | <65 | III/IV | Unknown | Unknown | SD |
| HSPH1 | SNV | Missense_Mutation | novel | c.1742A>C | p.Asp581Ala | p.D581A | Q92598 | protein_coding | tolerated(0.05) | possibly_damaging(0.627) | TCGA-BH-A1F5-01 | Breast | breast invasive carcinoma | Female | <65 | I/II | Unknown | Unknown | SD |
| HSPH1 | SNV | Missense_Mutation | novel | c.1742A>C | p.Asp581Ala | p.D581A | Q92598 | protein_coding | tolerated(0.05) | possibly_damaging(0.627) | TCGA-BH-A1F8-01 | Breast | breast invasive carcinoma | Female | >=65 | III/IV | Unknown | Unknown | PD |
| HSPH1 | SNV | Missense_Mutation | novel | c.1742A>C | p.Asp581Ala | p.D581A | Q92598 | protein_coding | tolerated(0.05) | possibly_damaging(0.627) | TCGA-D8-A1JT-01 | Breast | breast invasive carcinoma | Female | >=65 | I/II | Hormone Therapy | arimidex | SD |


