
|
|||||
|
 | |
| |
| |
| |
| |
| |
|
Gene: HSPG2 |
Gene summary for HSPG2 |
| Gene information | Species | Human | Gene symbol | HSPG2 | Gene ID | 3339 |
| Gene name | heparan sulfate proteoglycan 2 | |
| Gene Alias | HSPG | |
| Cytomap | 1p36.12 | |
| Gene Type | protein-coding | GO ID | GO:0001525 | UniProtAcc | P98160 |
Top |
Malignant transformation analysis |
| Identification of the aberrant gene expression in precancerous and cancerous lesions by comparing the gene expression of stem-like cells in diseased tissues with normal stem cells |
| Entrez ID | Symbol | Replicates | Species | Organ | Tissue | Adj P-value | Log2FC | Malignancy |
| 3339 | HSPG2 | LZE4T | Human | Esophagus | ESCC | 4.47e-05 | -5.57e-02 | 0.0811 |
| 3339 | HSPG2 | LZE8T | Human | Esophagus | ESCC | 1.82e-03 | 1.51e-01 | 0.067 |
| 3339 | HSPG2 | LZE20T | Human | Esophagus | ESCC | 1.18e-05 | 1.16e-01 | 0.0662 |
| 3339 | HSPG2 | LZE22T | Human | Esophagus | ESCC | 5.32e-04 | 2.75e-01 | 0.068 |
| 3339 | HSPG2 | LZE24T | Human | Esophagus | ESCC | 2.12e-08 | 1.89e-01 | 0.0596 |
| 3339 | HSPG2 | LZE21T | Human | Esophagus | ESCC | 4.47e-04 | 8.79e-02 | 0.0655 |
| 3339 | HSPG2 | P1T-E | Human | Esophagus | ESCC | 2.45e-04 | 5.45e-01 | 0.0875 |
| 3339 | HSPG2 | P2T-E | Human | Esophagus | ESCC | 5.55e-09 | 2.26e-01 | 0.1177 |
| 3339 | HSPG2 | P4T-E | Human | Esophagus | ESCC | 5.41e-09 | 5.25e-01 | 0.1323 |
| 3339 | HSPG2 | P8T-E | Human | Esophagus | ESCC | 1.59e-10 | 3.04e-01 | 0.0889 |
| 3339 | HSPG2 | P10T-E | Human | Esophagus | ESCC | 1.14e-26 | 5.69e-01 | 0.116 |
| 3339 | HSPG2 | P11T-E | Human | Esophagus | ESCC | 2.52e-11 | 9.96e-01 | 0.1426 |
| 3339 | HSPG2 | P12T-E | Human | Esophagus | ESCC | 4.12e-02 | 8.56e-02 | 0.1122 |
| 3339 | HSPG2 | P15T-E | Human | Esophagus | ESCC | 1.97e-07 | 4.21e-01 | 0.1149 |
| 3339 | HSPG2 | P16T-E | Human | Esophagus | ESCC | 1.75e-14 | 3.89e-02 | 0.1153 |
| 3339 | HSPG2 | P17T-E | Human | Esophagus | ESCC | 1.67e-03 | 7.58e-01 | 0.1278 |
| 3339 | HSPG2 | P21T-E | Human | Esophagus | ESCC | 1.51e-21 | 5.94e-01 | 0.1617 |
| 3339 | HSPG2 | P22T-E | Human | Esophagus | ESCC | 5.42e-09 | 1.73e-01 | 0.1236 |
| 3339 | HSPG2 | P24T-E | Human | Esophagus | ESCC | 1.06e-03 | 5.61e-01 | 0.1287 |
| 3339 | HSPG2 | P26T-E | Human | Esophagus | ESCC | 6.10e-10 | 8.85e-02 | 0.1276 |
| Page: 1 2 3 4 5 6 |
| Tissue | Expression Dynamics | Abbreviation |
| Esophagus |  | ESCC: Esophageal squamous cell carcinoma |
| HGIN: High-grade intraepithelial neoplasias | ||
| LGIN: Low-grade intraepithelial neoplasias | ||
| Liver | 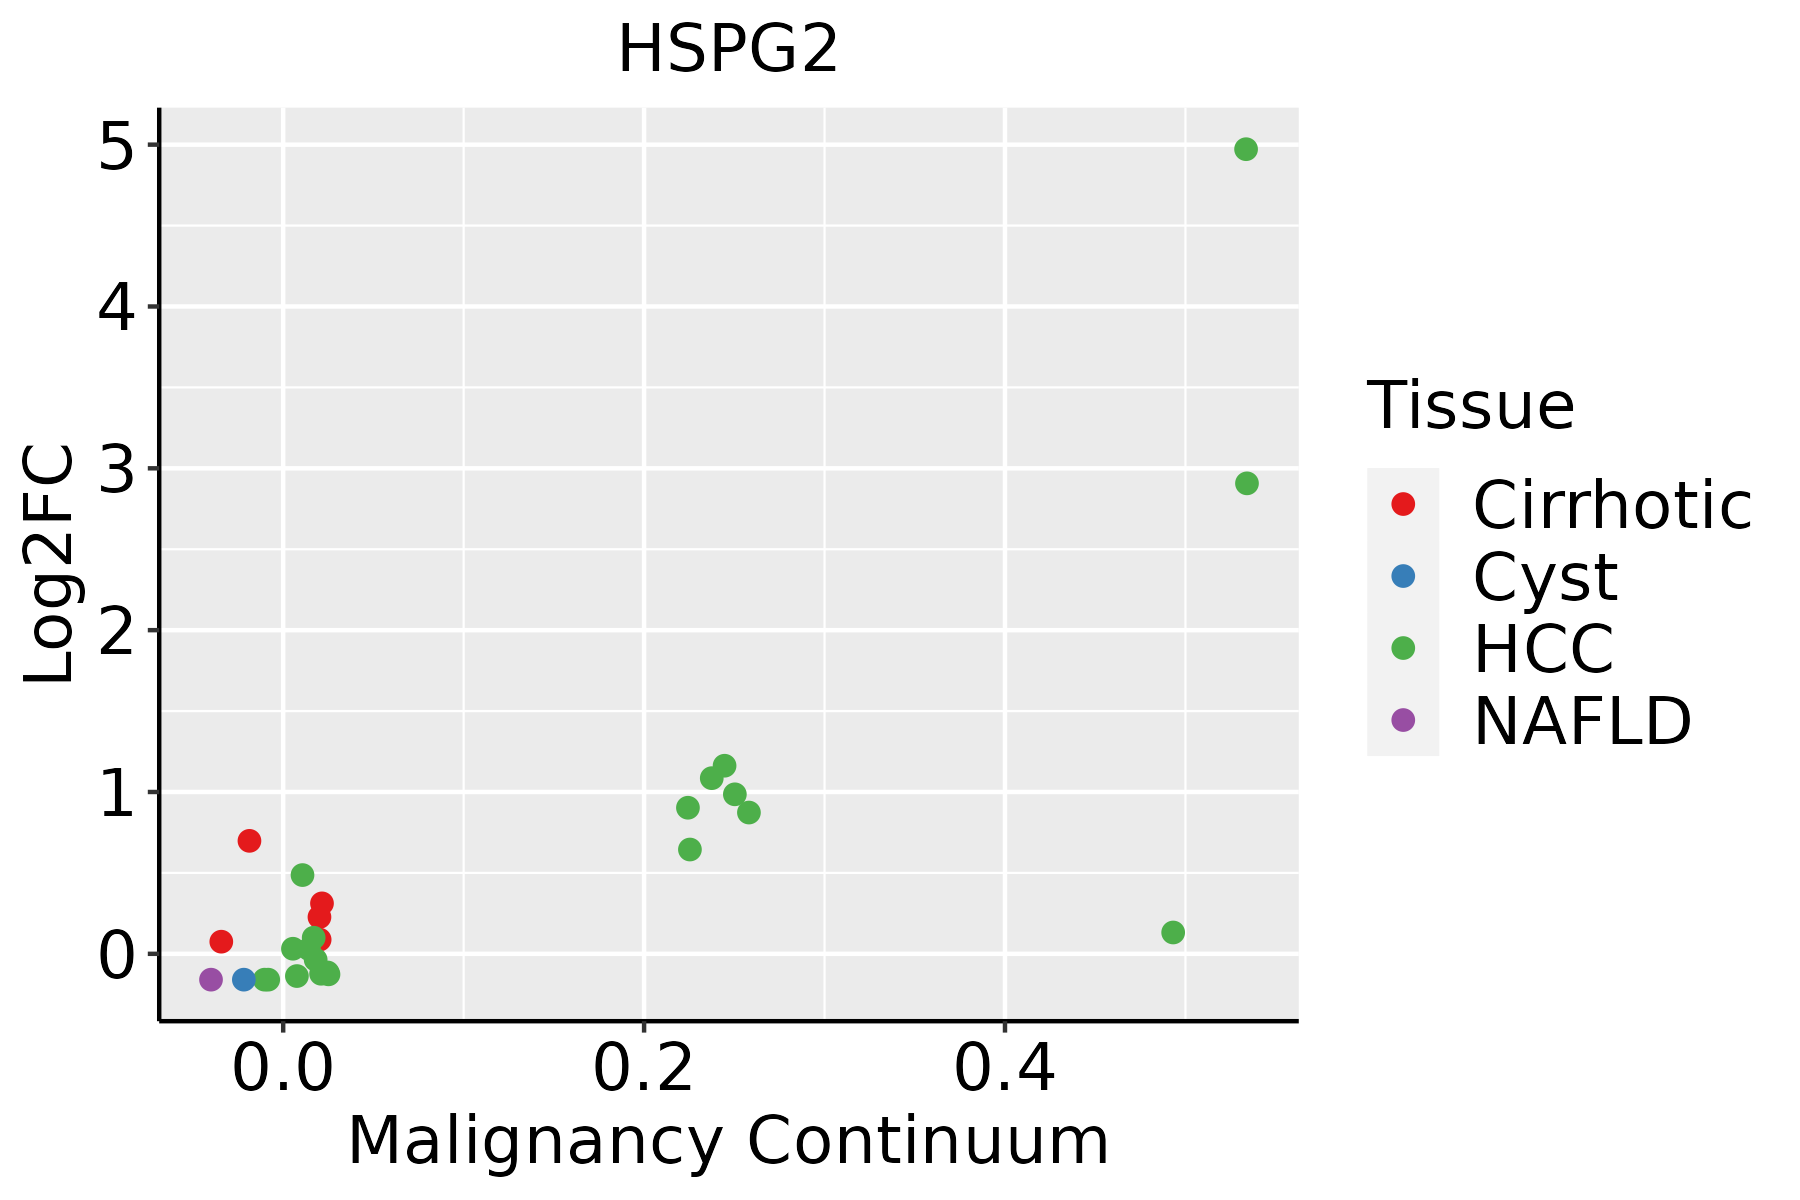 | HCC: Hepatocellular carcinoma |
| NAFLD: Non-alcoholic fatty liver disease | ||
| Lung |  | AAH: Atypical adenomatous hyperplasia |
| AIS: Adenocarcinoma in situ | ||
| IAC: Invasive lung adenocarcinoma | ||
| MIA: Minimally invasive adenocarcinoma | ||
| Oral Cavity |  | EOLP: Erosive Oral lichen planus |
| LP: leukoplakia | ||
| NEOLP: Non-erosive oral lichen planus | ||
| OSCC: Oral squamous cell carcinoma | ||
| Thyroid | 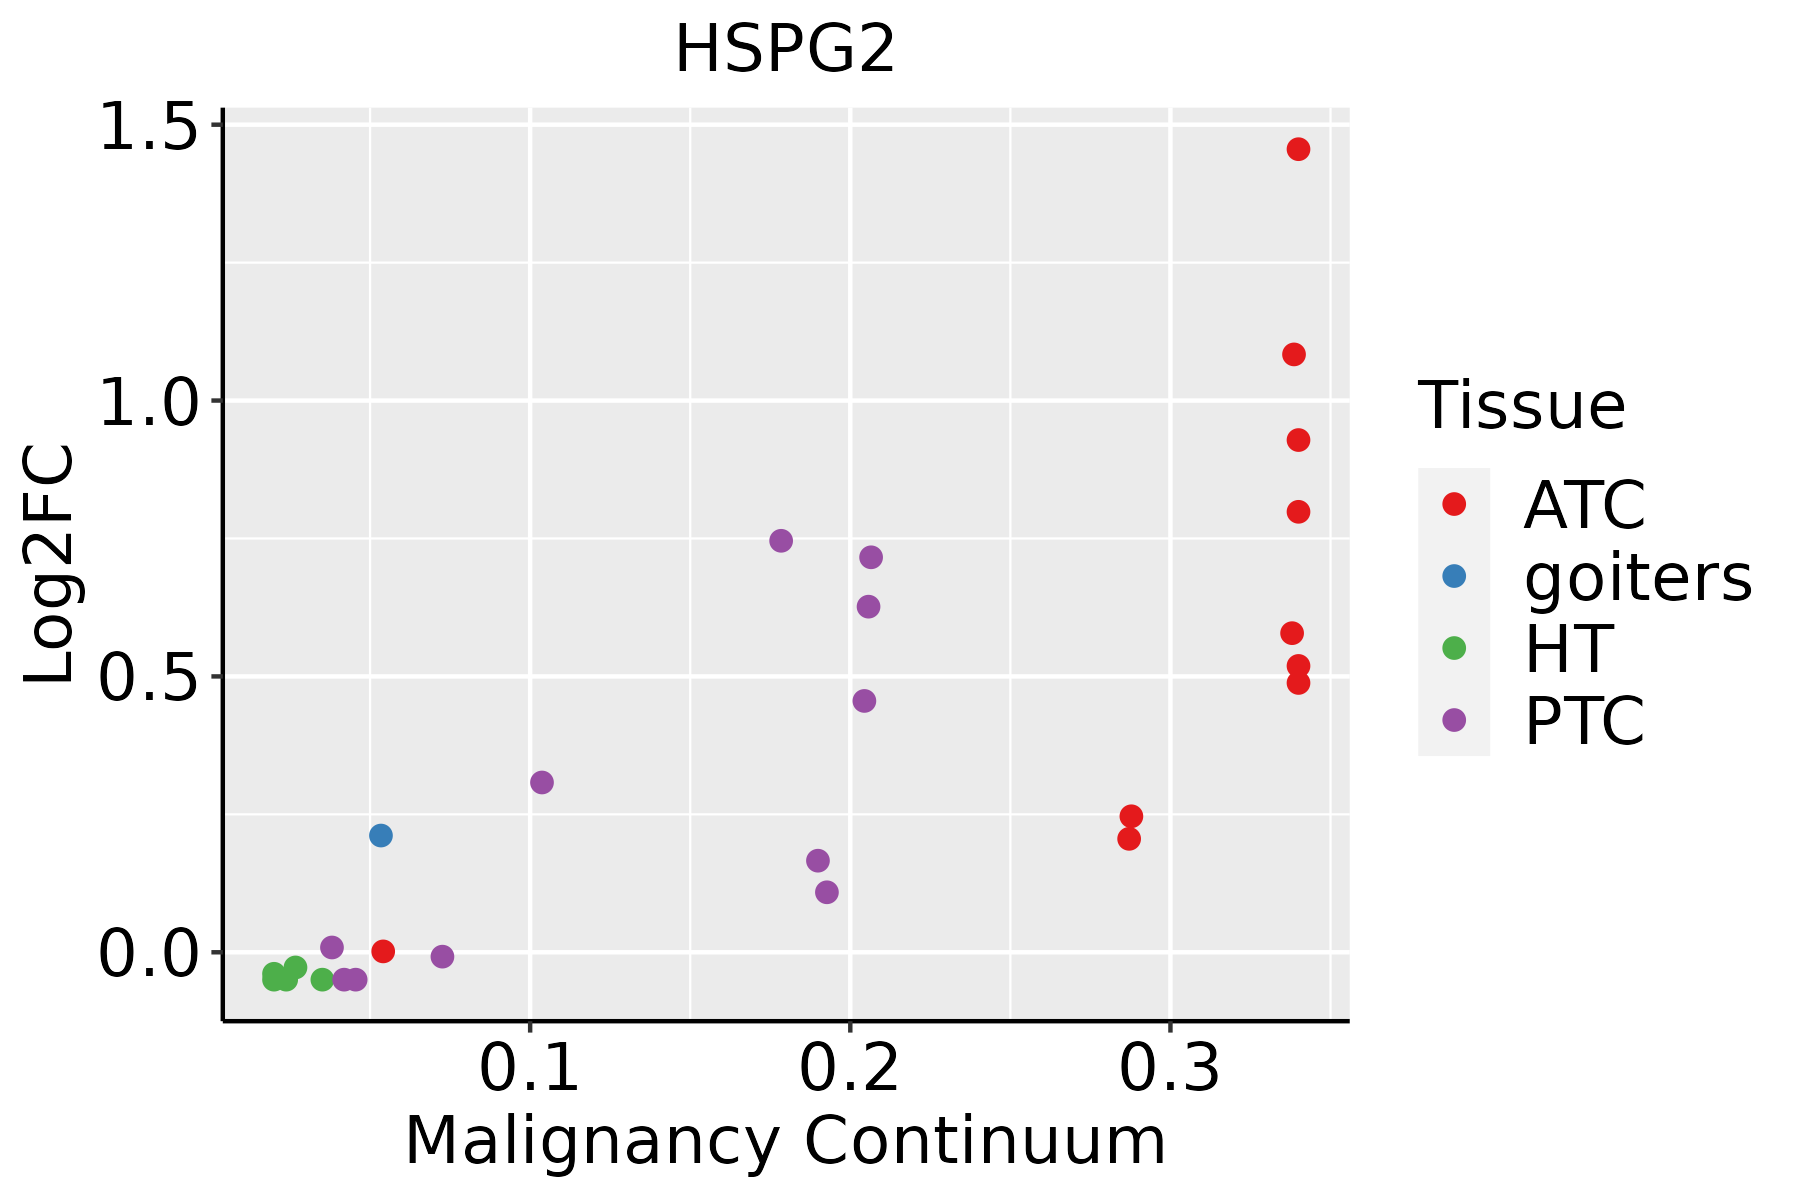 | ATC: Anaplastic thyroid cancer |
| HT: Hashimoto's thyroiditis | ||
| PTC: Papillary thyroid cancer |
| ∗log2FC in expression of this searched gene in stem-like cells from each diseased tissue sample relative to stem-like cells in normal samples in each tissue plotted against the malignancy continuum. Samples are colored based on if they are from different disease stage. |
Top |
Malignant transformation related pathway analysis |
| Find out the enriched GO biological processes and KEGG pathways involved in transition from healthy to precancer to cancer |
| Tissue | Disease Stage | Enriched GO biological Processes |
| Colorectum | AD |  |
| Colorectum | SER |  |
| Colorectum | MSS |  |
| Colorectum | MSI-H |  |
| Colorectum | FAP |  |
| ∗Top 15 enriched GO BP terms are showed in the bar plot of each disease state in each tissue. Each row represents a significant GO biological process which is colored according to the -log10(p.adjust). |
| Page: 1 2 3 4 5 6 7 8 9 |
| GO ID | Tissue | Disease Stage | Description | Gene Ratio | Bg Ratio | pvalue | p.adjust | Count |
| GO:000689818 | Esophagus | ESCC | receptor-mediated endocytosis | 142/8552 | 244/18723 | 5.22e-05 | 4.05e-04 | 142 |
| GO:000689811 | Liver | Cirrhotic | receptor-mediated endocytosis | 91/4634 | 244/18723 | 8.13e-06 | 1.22e-04 | 91 |
| GO:000689821 | Liver | HCC | receptor-mediated endocytosis | 134/7958 | 244/18723 | 5.73e-05 | 5.31e-04 | 134 |
| GO:00068985 | Lung | IAC | receptor-mediated endocytosis | 50/2061 | 244/18723 | 1.01e-05 | 3.23e-04 | 50 |
| GO:000689812 | Lung | AIS | receptor-mediated endocytosis | 50/1849 | 244/18723 | 4.47e-07 | 3.52e-05 | 50 |
| GO:000689822 | Lung | MIAC | receptor-mediated endocytosis | 25/967 | 244/18723 | 8.78e-04 | 1.88e-02 | 25 |
| GO:000689810 | Oral cavity | OSCC | receptor-mediated endocytosis | 125/7305 | 244/18723 | 6.56e-05 | 5.32e-04 | 125 |
| GO:000689817 | Oral cavity | LP | receptor-mediated endocytosis | 87/4623 | 244/18723 | 7.83e-05 | 1.02e-03 | 87 |
| GO:0006898110 | Thyroid | PTC | receptor-mediated endocytosis | 112/5968 | 244/18723 | 2.87e-06 | 3.74e-05 | 112 |
| GO:000689826 | Thyroid | ATC | receptor-mediated endocytosis | 118/6293 | 244/18723 | 1.17e-06 | 1.50e-05 | 118 |
| GO:00457657 | Thyroid | ATC | regulation of angiogenesis | 141/6293 | 342/18723 | 1.80e-03 | 8.85e-03 | 141 |
| GO:19013427 | Thyroid | ATC | regulation of vasculature development | 143/6293 | 348/18723 | 1.95e-03 | 9.44e-03 | 143 |
| Page: 1 |
| Pathway ID | Tissue | Disease Stage | Description | Gene Ratio | Bg Ratio | pvalue | p.adjust | qvalue | Count |
| hsa0520529 | Esophagus | ESCC | Proteoglycans in cancer | 138/4205 | 205/8465 | 1.79e-07 | 1.40e-06 | 7.15e-07 | 138 |
| hsa051619 | Esophagus | ESCC | Hepatitis B | 108/4205 | 162/8465 | 7.68e-06 | 4.15e-05 | 2.12e-05 | 108 |
| hsa0520537 | Esophagus | ESCC | Proteoglycans in cancer | 138/4205 | 205/8465 | 1.79e-07 | 1.40e-06 | 7.15e-07 | 138 |
| hsa0516114 | Esophagus | ESCC | Hepatitis B | 108/4205 | 162/8465 | 7.68e-06 | 4.15e-05 | 2.12e-05 | 108 |
| hsa0520510 | Liver | Cirrhotic | Proteoglycans in cancer | 85/2530 | 205/8465 | 2.37e-04 | 1.58e-03 | 9.75e-04 | 85 |
| hsa0520511 | Liver | Cirrhotic | Proteoglycans in cancer | 85/2530 | 205/8465 | 2.37e-04 | 1.58e-03 | 9.75e-04 | 85 |
| hsa0520521 | Liver | HCC | Proteoglycans in cancer | 121/4020 | 205/8465 | 5.22e-04 | 2.18e-03 | 1.21e-03 | 121 |
| hsa051612 | Liver | HCC | Hepatitis B | 91/4020 | 162/8465 | 1.56e-02 | 3.76e-02 | 2.09e-02 | 91 |
| hsa0520531 | Liver | HCC | Proteoglycans in cancer | 121/4020 | 205/8465 | 5.22e-04 | 2.18e-03 | 1.21e-03 | 121 |
| hsa0516111 | Liver | HCC | Hepatitis B | 91/4020 | 162/8465 | 1.56e-02 | 3.76e-02 | 2.09e-02 | 91 |
| hsa0520512 | Lung | IAC | Proteoglycans in cancer | 53/1053 | 205/8465 | 9.47e-08 | 6.16e-06 | 4.09e-06 | 53 |
| hsa04512 | Lung | IAC | ECM-receptor interaction | 20/1053 | 89/8465 | 5.65e-03 | 2.45e-02 | 1.63e-02 | 20 |
| hsa0520513 | Lung | IAC | Proteoglycans in cancer | 53/1053 | 205/8465 | 9.47e-08 | 6.16e-06 | 4.09e-06 | 53 |
| hsa045121 | Lung | IAC | ECM-receptor interaction | 20/1053 | 89/8465 | 5.65e-03 | 2.45e-02 | 1.63e-02 | 20 |
| hsa0520522 | Lung | AIS | Proteoglycans in cancer | 52/961 | 205/8465 | 1.16e-08 | 5.38e-07 | 3.44e-07 | 52 |
| hsa045122 | Lung | AIS | ECM-receptor interaction | 20/961 | 89/8465 | 1.95e-03 | 1.26e-02 | 8.09e-03 | 20 |
| hsa0520532 | Lung | AIS | Proteoglycans in cancer | 52/961 | 205/8465 | 1.16e-08 | 5.38e-07 | 3.44e-07 | 52 |
| hsa045123 | Lung | AIS | ECM-receptor interaction | 20/961 | 89/8465 | 1.95e-03 | 1.26e-02 | 8.09e-03 | 20 |
| hsa0520561 | Lung | MIAC | Proteoglycans in cancer | 31/507 | 205/8465 | 1.45e-06 | 9.39e-05 | 6.79e-05 | 31 |
| hsa0520571 | Lung | MIAC | Proteoglycans in cancer | 31/507 | 205/8465 | 1.45e-06 | 9.39e-05 | 6.79e-05 | 31 |
| Page: 1 2 |
Top |
Cell-cell communication analysis |
| Identification of potential cell-cell interactions between two cell types and their ligand-receptor pairs for different disease states |
| Ligand | Receptor | LRpair | Pathway | Tissue | Disease Stage |
| HSPG2 | DAG1 | HSPG2_DAG1 | HSPG | Breast | DCIS |
| HSPG2 | DAG1 | HSPG2_DAG1 | HSPG | Cervix | Precancer |
| HSPG2 | DAG1 | HSPG2_DAG1 | HSPG | CRC | AD |
| HSPG2 | DAG1 | HSPG2_DAG1 | HSPG | CRC | ADJ |
| HSPG2 | DAG1 | HSPG2_DAG1 | HSPG | CRC | MSI-H |
| HSPG2 | DAG1 | HSPG2_DAG1 | HSPG | CRC | MSS |
| HSPG2 | DAG1 | HSPG2_DAG1 | HSPG | Endometrium | Healthy |
| HSPG2 | DAG1 | HSPG2_DAG1 | HSPG | Esophagus | ESCC |
| HSPG2 | DAG1 | HSPG2_DAG1 | HSPG | GC | ADJ |
| HSPG2 | DAG1 | HSPG2_DAG1 | HSPG | HNSCC | ADJ |
| HSPG2 | DAG1 | HSPG2_DAG1 | HSPG | HNSCC | OSCC |
| HSPG2 | DAG1 | HSPG2_DAG1 | HSPG | HNSCC | Precancer |
| HSPG2 | DAG1 | HSPG2_DAG1 | HSPG | Liver | HCC |
| HSPG2 | DAG1 | HSPG2_DAG1 | HSPG | Liver | Healthy |
| HSPG2 | DAG1 | HSPG2_DAG1 | HSPG | Lung | AAH |
| HSPG2 | DAG1 | HSPG2_DAG1 | HSPG | Lung | MIAC |
| HSPG2 | DAG1 | HSPG2_DAG1 | HSPG | Prostate | BPH |
| HSPG2 | DAG1 | HSPG2_DAG1 | HSPG | Prostate | Healthy |
| HSPG2 | DAG1 | HSPG2_DAG1 | HSPG | Prostate | Tumor |
| HSPG2 | DAG1 | HSPG2_DAG1 | HSPG | Skin | cSCC |
| Page: 1 2 |
Top |
Single-cell gene regulatory network inference analysis |
| Find out the significant the regulons (TFs) and the target genes of each regulon across cell types for different disease states |
| TF | Cell Type | Tissue | Disease Stage | Target Gene | RSS | Regulon Activity |
| ∗The dot plots of a searched regulon are shown for all cell subpopulations in each disease state of each tissue based on the regulon specific score inferred using pySCENIC and by calculating the average expression. |
| Page: 1 |
Top |
Somatic mutation of malignant transformation related genes |
| Annotation of somatic variants for genes involved in malignant transformation |
| Hugo Symbol | Variant Class | Variant Classification | dbSNP RS | HGVSc | HGVSp | HGVSp Short | SWISSPROT | BIOTYPE | SIFT | PolyPhen | Tumor Sample Barcode | Tissue | Histology | Sex | Age | Stage | Therapy Types | Drugs | Outcome |
| HSPG2 | SNV | Missense_Mutation | c.1402G>A | p.Asp468Asn | p.D468N | P98160 | protein_coding | deleterious(0) | probably_damaging(0.999) | TCGA-A2-A0CW-01 | Breast | breast invasive carcinoma | Female | >=65 | I/II | Hormone Therapy | anastrozole | SD | |
| HSPG2 | SNV | Missense_Mutation | c.10750G>C | p.Val3584Leu | p.V3584L | P98160 | protein_coding | tolerated(0.2) | possibly_damaging(0.447) | TCGA-AC-A23H-01 | Breast | breast invasive carcinoma | Female | >=65 | I/II | Unknown | Unknown | PD | |
| HSPG2 | SNV | Missense_Mutation | rs190732238 | c.7954N>A | p.Val2652Met | p.V2652M | P98160 | protein_coding | tolerated(0.06) | benign(0.14) | TCGA-AN-A0FZ-01 | Breast | breast invasive carcinoma | Female | <65 | III/IV | Unknown | Unknown | SD |
| HSPG2 | SNV | Missense_Mutation | rs762861100 | c.11908N>A | p.Gly3970Arg | p.G3970R | P98160 | protein_coding | deleterious(0.02) | probably_damaging(0.993) | TCGA-AO-A128-01 | Breast | breast invasive carcinoma | Female | <65 | I/II | Chemotherapy | doxorubicin | SD |
| HSPG2 | SNV | Missense_Mutation | novel | c.10335N>A | p.Ser3445Arg | p.S3445R | P98160 | protein_coding | tolerated(0.29) | probably_damaging(0.945) | TCGA-AR-A0U2-01 | Breast | breast invasive carcinoma | Female | <65 | III/IV | Hormone Therapy | tamoxiphen | PD |
| HSPG2 | SNV | Missense_Mutation | rs372033039 | c.4900N>A | p.Gly1634Ser | p.G1634S | P98160 | protein_coding | deleterious(0.04) | possibly_damaging(0.503) | TCGA-BH-A0B6-01 | Breast | breast invasive carcinoma | Female | <65 | I/II | Unknown | Unknown | SD |
| HSPG2 | SNV | Missense_Mutation | novel | c.7226T>G | p.Val2409Gly | p.V2409G | P98160 | protein_coding | tolerated(0.05) | possibly_damaging(0.672) | TCGA-BH-A0BG-01 | Breast | breast invasive carcinoma | Female | >=65 | I/II | Unknown | Unknown | SD |
| HSPG2 | SNV | Missense_Mutation | rs573946760 | c.10336N>A | p.Val3446Met | p.V3446M | P98160 | protein_coding | deleterious(0.01) | probably_damaging(0.999) | TCGA-BH-A6R8-01 | Breast | breast invasive carcinoma | Female | <65 | I/II | Unknown | Unknown | SD |
| HSPG2 | SNV | Missense_Mutation | c.6319N>T | p.Val2107Phe | p.V2107F | P98160 | protein_coding | deleterious(0) | possibly_damaging(0.559) | TCGA-D8-A143-01 | Breast | breast invasive carcinoma | Female | <65 | I/II | Chemotherapy | doxorubicin | SD | |
| HSPG2 | SNV | Missense_Mutation | c.11752N>T | p.Gly3918Trp | p.G3918W | P98160 | protein_coding | deleterious(0) | probably_damaging(1) | TCGA-E2-A14P-01 | Breast | breast invasive carcinoma | Female | >=65 | III/IV | Targeted Molecular therapy | trastuzumab | SD |
| Page: 1 2 3 4 5 6 7 8 9 10 11 12 13 14 15 16 17 18 19 20 21 22 23 24 25 26 27 28 29 30 31 32 33 |
Top |
Related drugs of malignant transformation related genes |
| Identification of chemicals and drugs interact with genes involved in malignant transfromation |
| (DGIdb 4.0) |
| Entrez ID | Symbol | Category | Interaction Types | Drug Claim Name | Drug Name | PMIDs |
| 3339 | HSPG2 | KINASE, DRUGGABLE GENOME | antipsychotics | 21808285 | ||
| 3339 | HSPG2 | KINASE, DRUGGABLE GENOME | D-20133 | 21649580 | ||
| 3339 | HSPG2 | KINASE, DRUGGABLE GENOME | haloperidol | HALOPERIDOL | 27023437 | |
| 3339 | HSPG2 | KINASE, DRUGGABLE GENOME | CSA | CYCLOSPORINE | 14974815 | |
| 3339 | HSPG2 | KINASE, DRUGGABLE GENOME | PALIFERMIN | PALIFERMIN |
| Page: 1 |

Copyright 2023-Present -The University of Texas Health Science Center at Houston |