
|
|||||
|
 | |
| |
| |
| |
| |
| |
|
Gene: HSPE1 |
Gene summary for HSPE1 |
| Gene information | Species | Human | Gene symbol | HSPE1 | Gene ID | 3336 |
| Gene name | heat shock protein family E (Hsp10) member 1 | |
| Gene Alias | CPN10 | |
| Cytomap | 2q33.1 | |
| Gene Type | protein-coding | GO ID | GO:0001503 | UniProtAcc | P61604 |
Top |
Malignant transformation analysis |
| Identification of the aberrant gene expression in precancerous and cancerous lesions by comparing the gene expression of stem-like cells in diseased tissues with normal stem cells |
| Entrez ID | Symbol | Replicates | Species | Organ | Tissue | Adj P-value | Log2FC | Malignancy |
| 3336 | HSPE1 | GSM4909277 | Human | Breast | Precancer | 4.55e-13 | 8.38e-01 | 0.0177 |
| 3336 | HSPE1 | GSM4909280 | Human | Breast | Precancer | 8.21e-03 | 2.93e-01 | 0.0305 |
| 3336 | HSPE1 | GSM4909281 | Human | Breast | IDC | 1.03e-06 | 3.51e-01 | 0.21 |
| 3336 | HSPE1 | GSM4909285 | Human | Breast | IDC | 8.01e-19 | 4.79e-01 | 0.21 |
| 3336 | HSPE1 | GSM4909286 | Human | Breast | IDC | 6.96e-11 | -6.10e-02 | 0.1081 |
| 3336 | HSPE1 | GSM4909287 | Human | Breast | IDC | 1.00e-18 | 4.94e-01 | 0.2057 |
| 3336 | HSPE1 | GSM4909293 | Human | Breast | IDC | 3.46e-04 | 1.54e-01 | 0.1581 |
| 3336 | HSPE1 | GSM4909294 | Human | Breast | IDC | 1.67e-39 | 5.45e-01 | 0.2022 |
| 3336 | HSPE1 | GSM4909296 | Human | Breast | IDC | 1.96e-02 | 7.43e-02 | 0.1524 |
| 3336 | HSPE1 | GSM4909297 | Human | Breast | IDC | 1.50e-09 | -9.32e-02 | 0.1517 |
| 3336 | HSPE1 | GSM4909298 | Human | Breast | IDC | 5.00e-08 | -2.01e-01 | 0.1551 |
| 3336 | HSPE1 | GSM4909304 | Human | Breast | IDC | 6.28e-08 | 2.96e-01 | 0.1636 |
| 3336 | HSPE1 | GSM4909308 | Human | Breast | IDC | 6.36e-07 | 2.42e-01 | 0.158 |
| 3336 | HSPE1 | GSM4909311 | Human | Breast | IDC | 6.34e-31 | -5.82e-01 | 0.1534 |
| 3336 | HSPE1 | GSM4909312 | Human | Breast | IDC | 6.03e-06 | -2.64e-01 | 0.1552 |
| 3336 | HSPE1 | GSM4909313 | Human | Breast | IDC | 5.41e-09 | -5.14e-01 | 0.0391 |
| 3336 | HSPE1 | GSM4909315 | Human | Breast | IDC | 2.43e-05 | 2.88e-01 | 0.21 |
| 3336 | HSPE1 | GSM4909316 | Human | Breast | IDC | 3.25e-06 | 4.01e-01 | 0.21 |
| 3336 | HSPE1 | GSM4909319 | Human | Breast | IDC | 1.15e-43 | -3.08e-01 | 0.1563 |
| 3336 | HSPE1 | GSM4909320 | Human | Breast | IDC | 9.88e-05 | -2.88e-01 | 0.1575 |
| Page: 1 2 3 4 5 6 7 8 9 10 11 12 13 14 15 16 17 |
| Tissue | Expression Dynamics | Abbreviation |
| Breast | 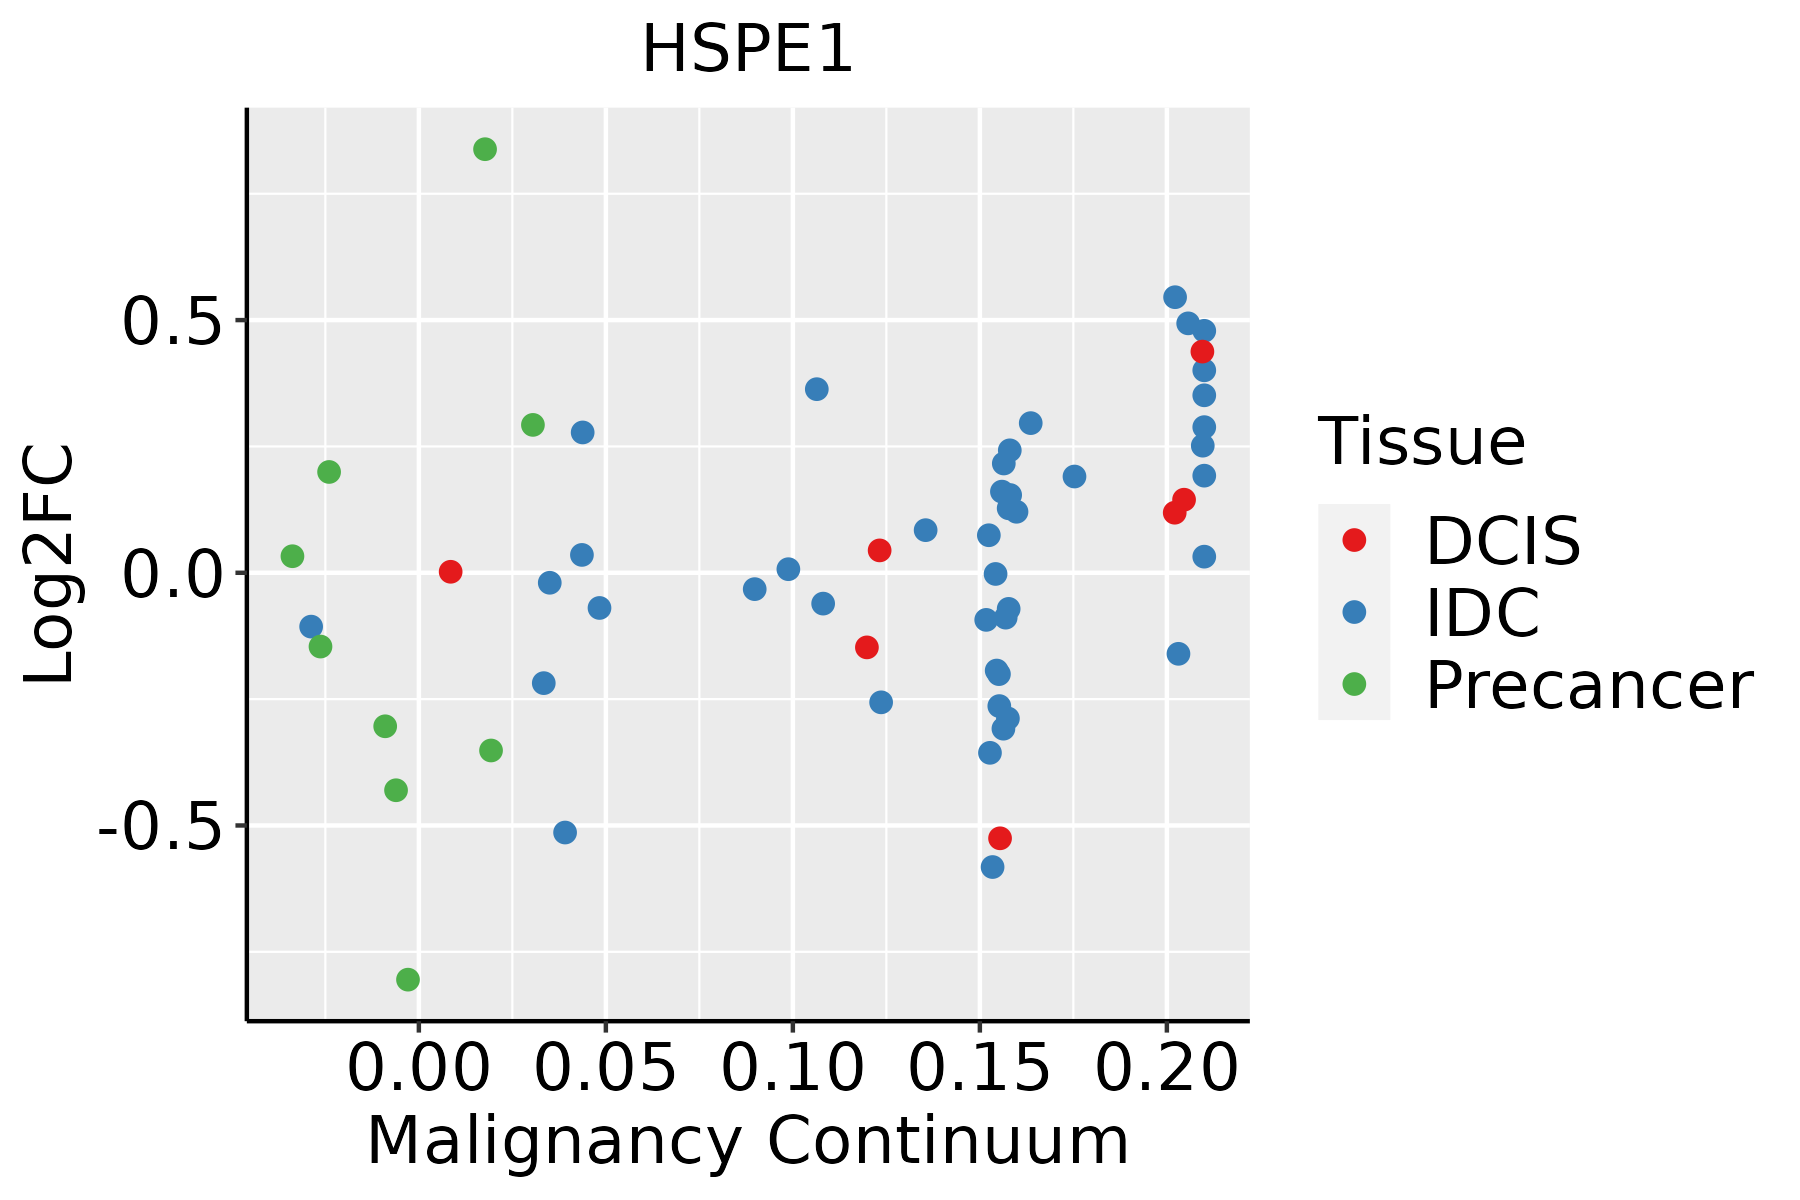 | IDC: Invasive ductal carcinoma |
| DCIS: Ductal carcinoma in situ | ||
| Precancer(BRCA1-mut): Precancerous lesion from BRCA1 mutation carriers | ||
| Cervix | 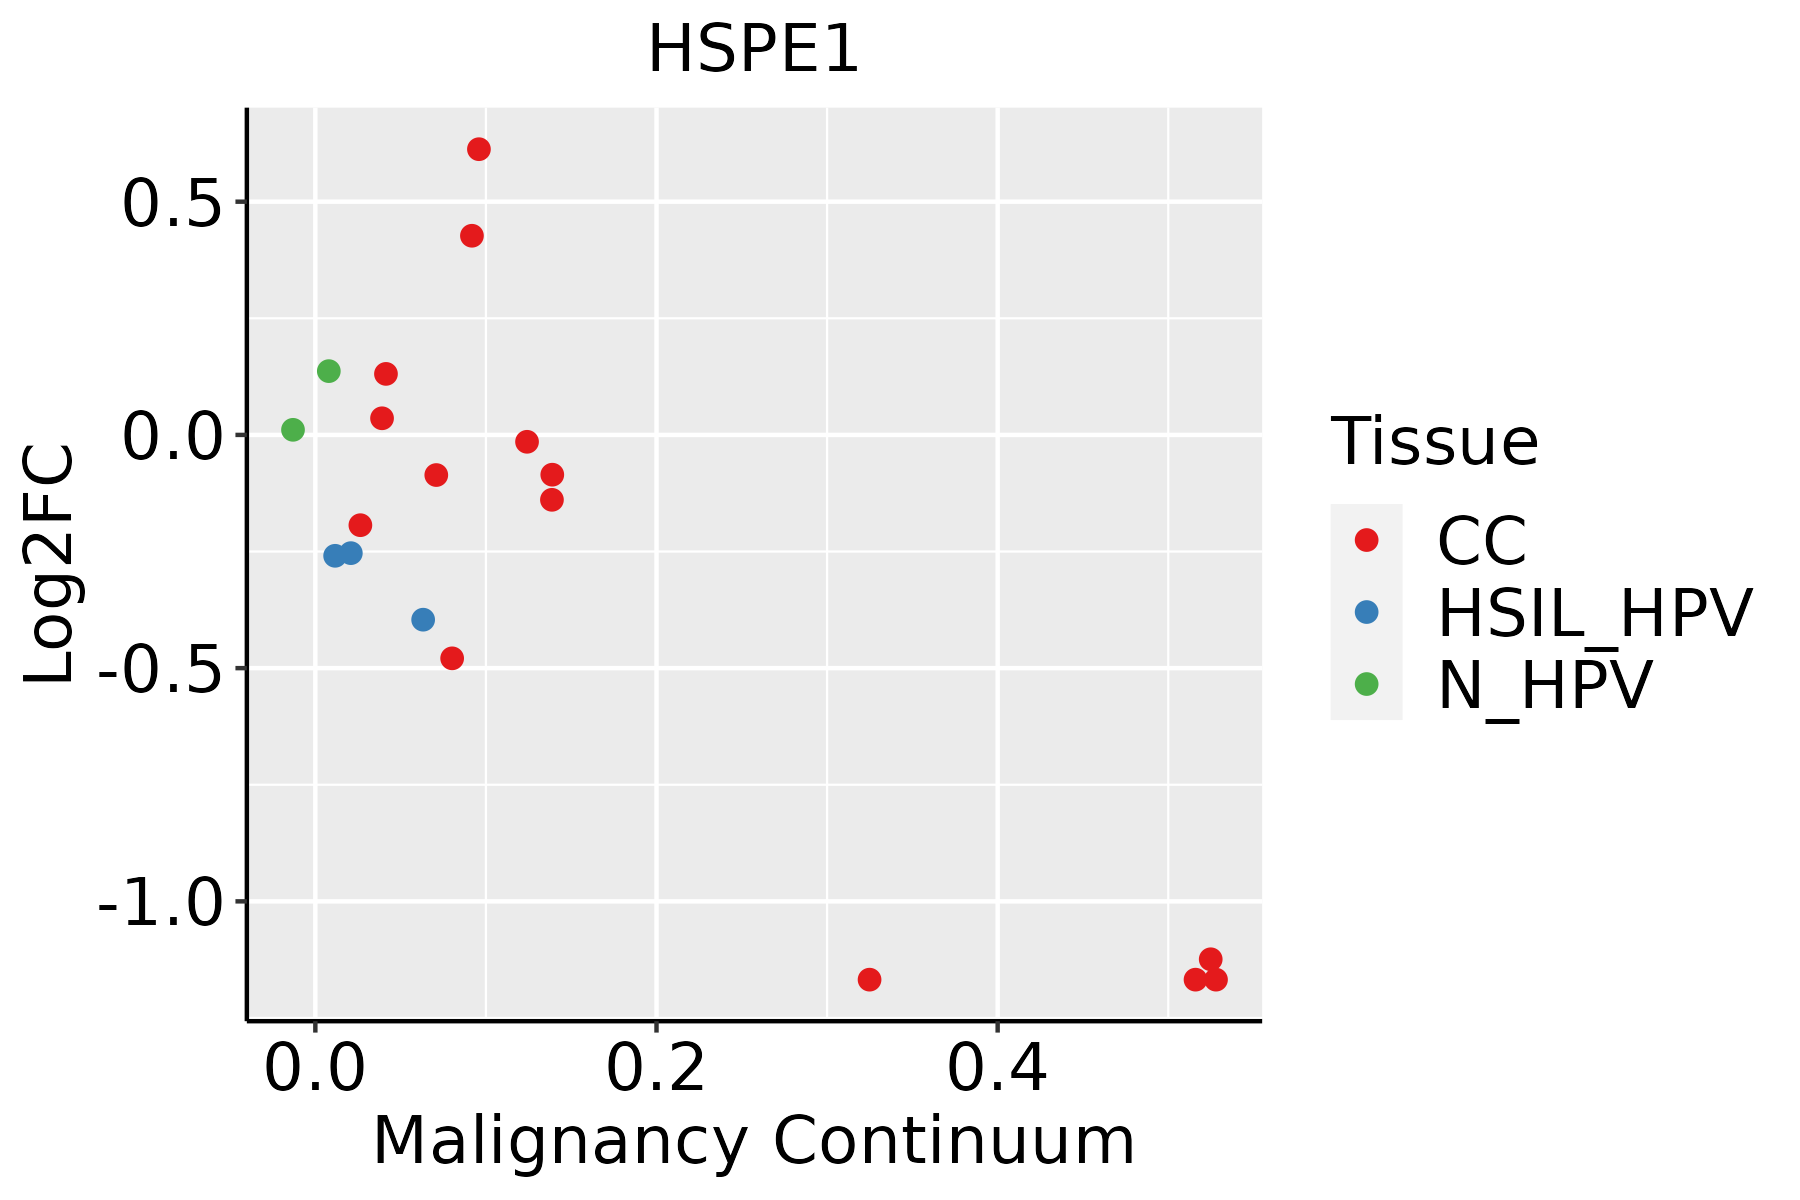 | CC: Cervix cancer |
| HSIL_HPV: HPV-infected high-grade squamous intraepithelial lesions | ||
| N_HPV: HPV-infected normal cervix | ||
| Colorectum (GSE201348) |  | FAP: Familial adenomatous polyposis |
| CRC: Colorectal cancer | ||
| Colorectum (HTA11) |  | AD: Adenomas |
| SER: Sessile serrated lesions | ||
| MSI-H: Microsatellite-high colorectal cancer | ||
| MSS: Microsatellite stable colorectal cancer | ||
| Endometrium |  | AEH: Atypical endometrial hyperplasia |
| EEC: Endometrioid Cancer | ||
| Esophagus |  | ESCC: Esophageal squamous cell carcinoma |
| HGIN: High-grade intraepithelial neoplasias | ||
| LGIN: Low-grade intraepithelial neoplasias | ||
| GC | 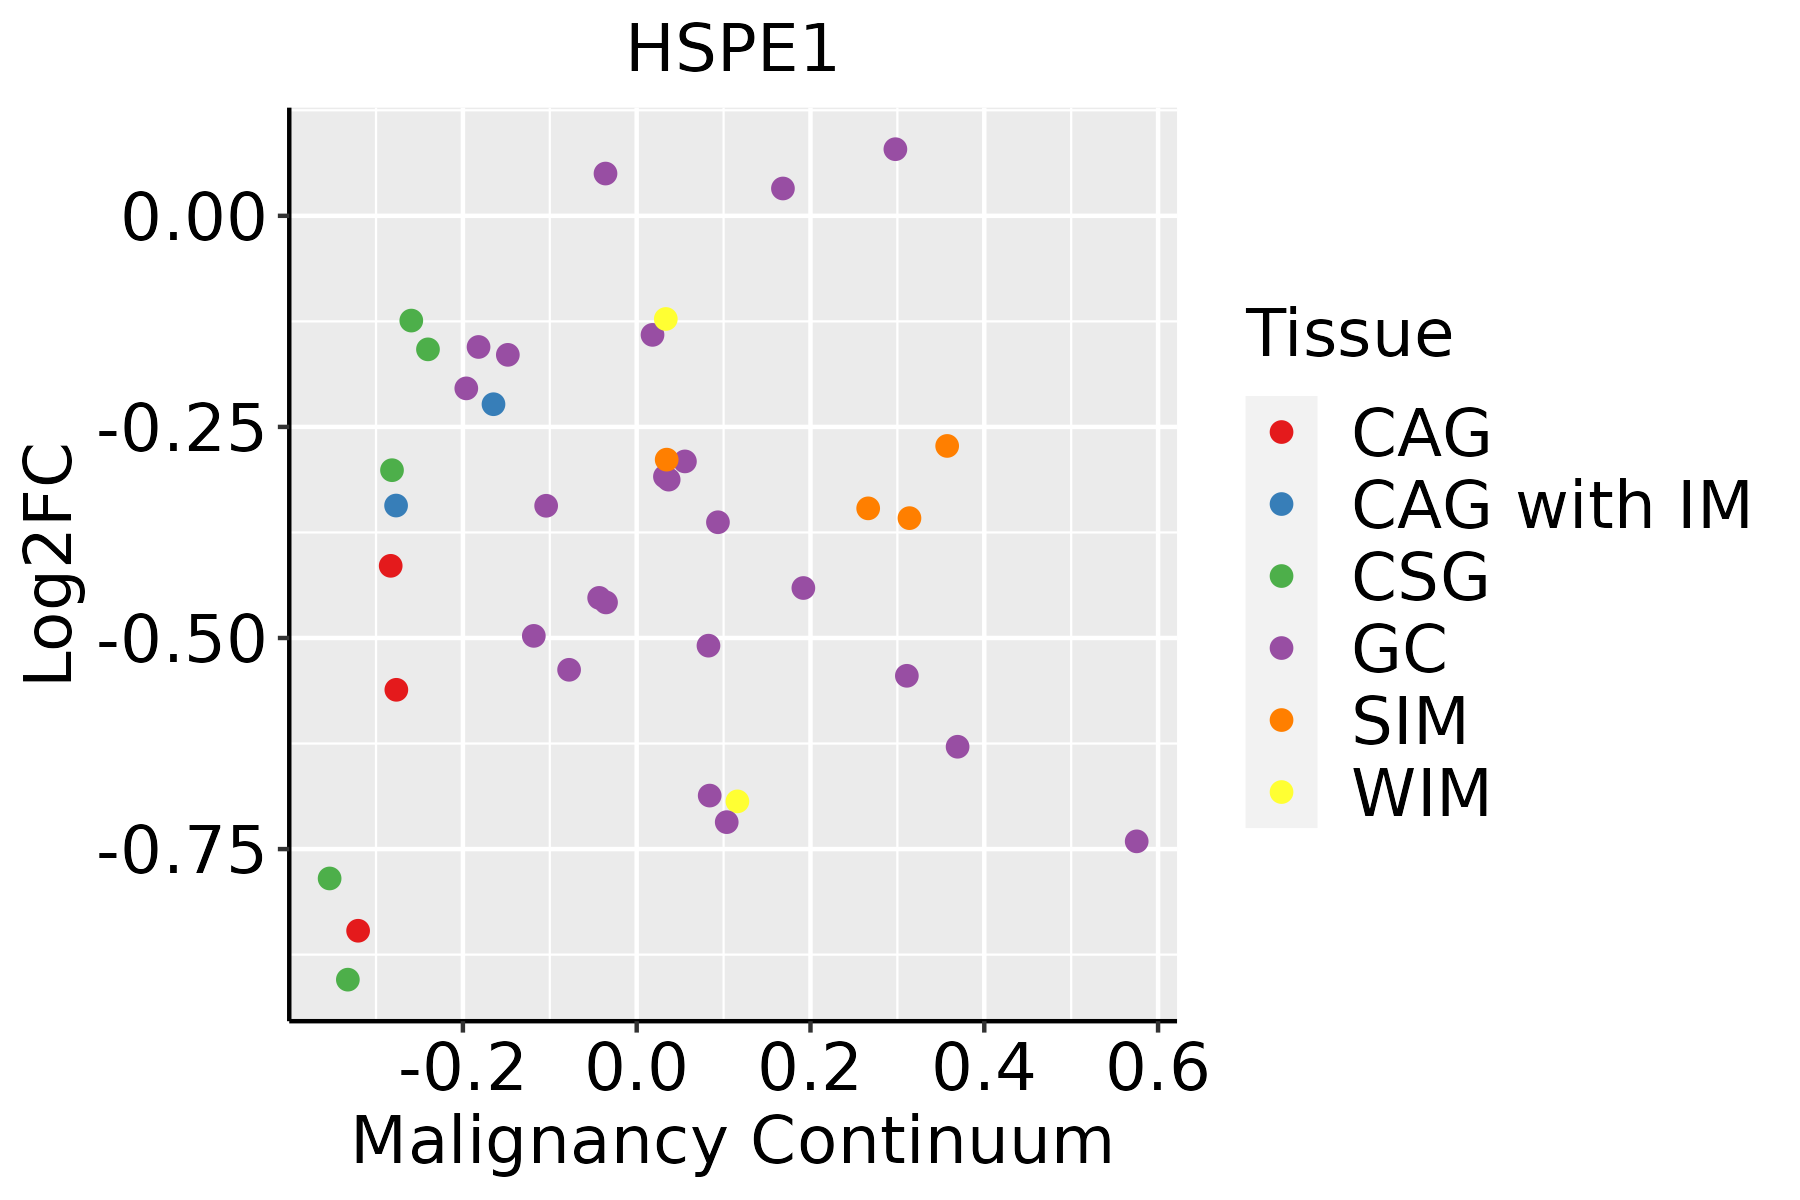 | CAG: Chronic atrophic gastritis |
| CAG with IM: Chronic atrophic gastritis with intestinal metaplasia | ||
| CSG: Chronic superficial gastritis | ||
| GC: Gastric cancer | ||
| SIM: Severe intestinal metaplasia | ||
| WIM: Wild intestinal metaplasia | ||
| Liver | 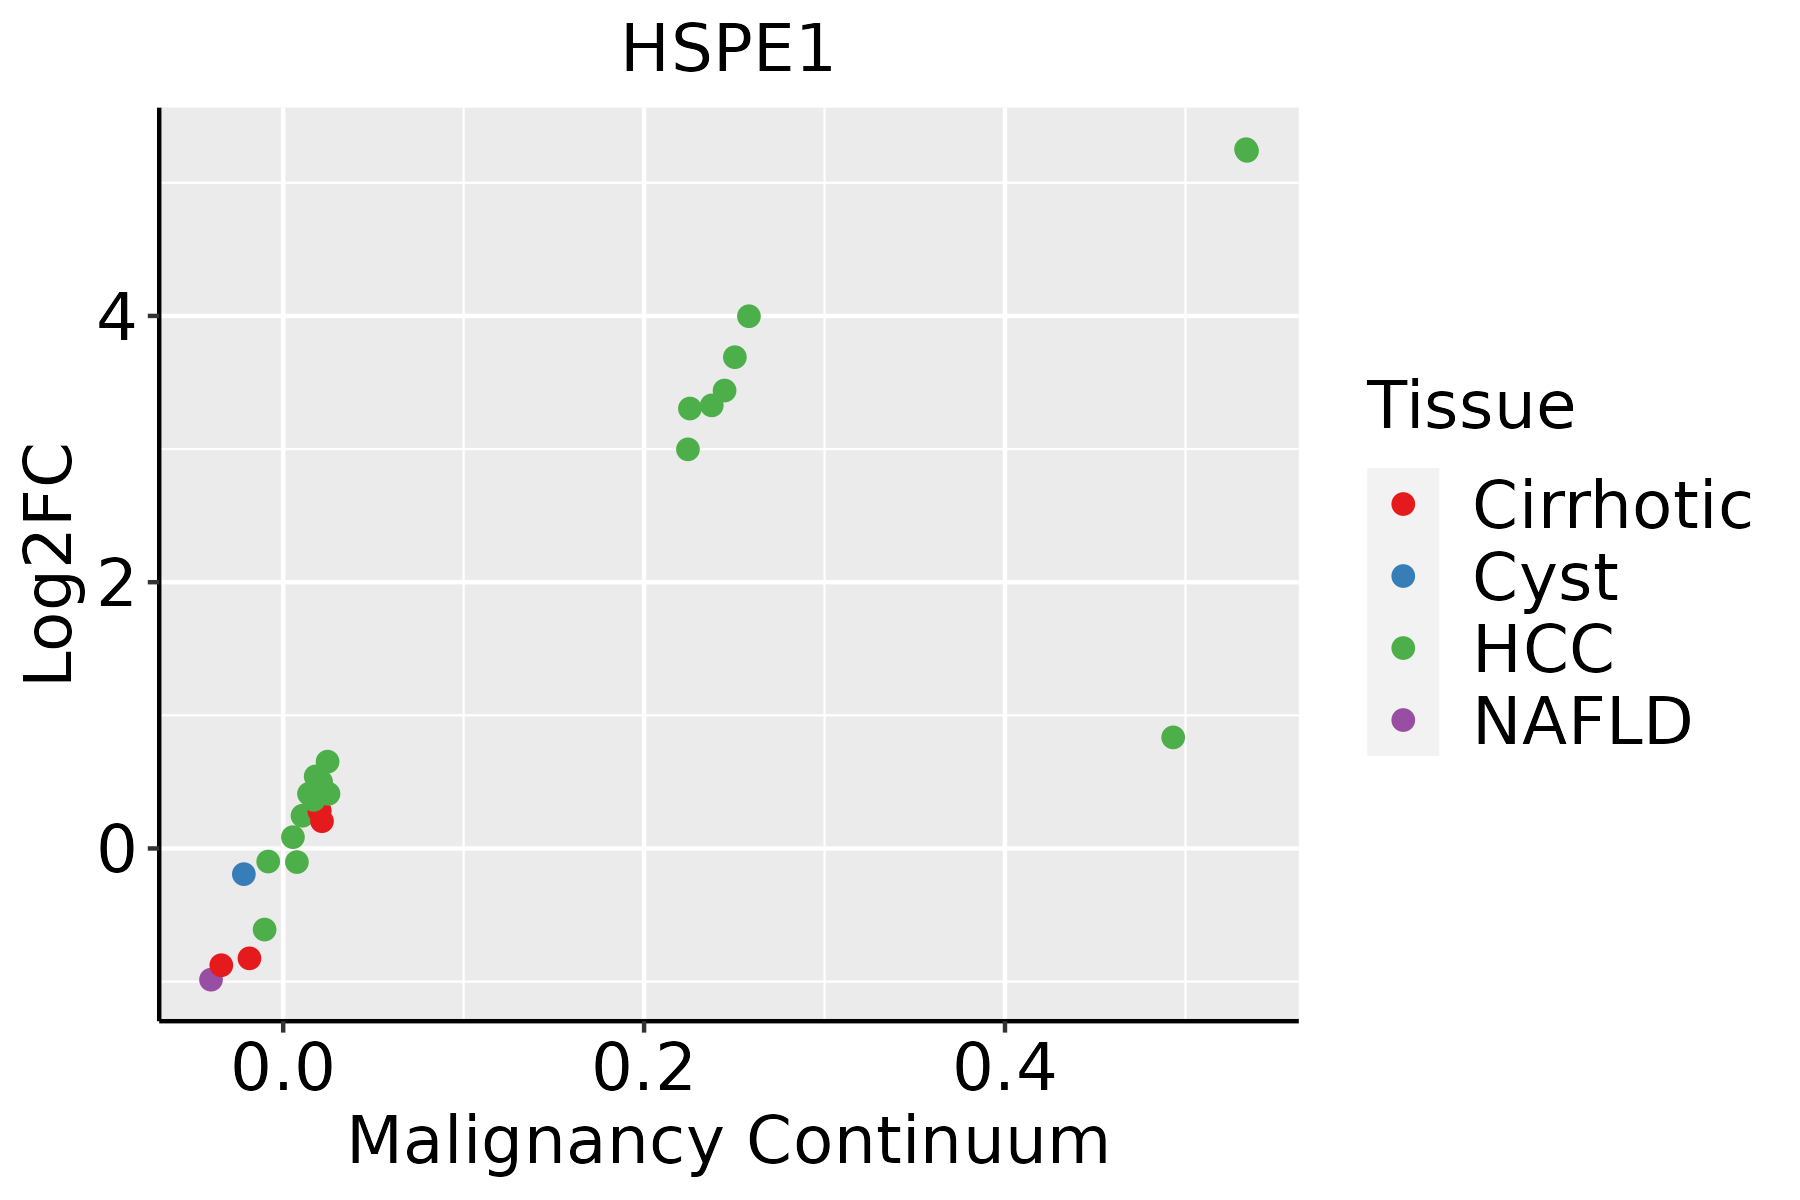 | HCC: Hepatocellular carcinoma |
| NAFLD: Non-alcoholic fatty liver disease | ||
| Oral Cavity |  | EOLP: Erosive Oral lichen planus |
| LP: leukoplakia | ||
| NEOLP: Non-erosive oral lichen planus | ||
| OSCC: Oral squamous cell carcinoma | ||
| Prostate |  | BPH: Benign Prostatic Hyperplasia |
| Skin | 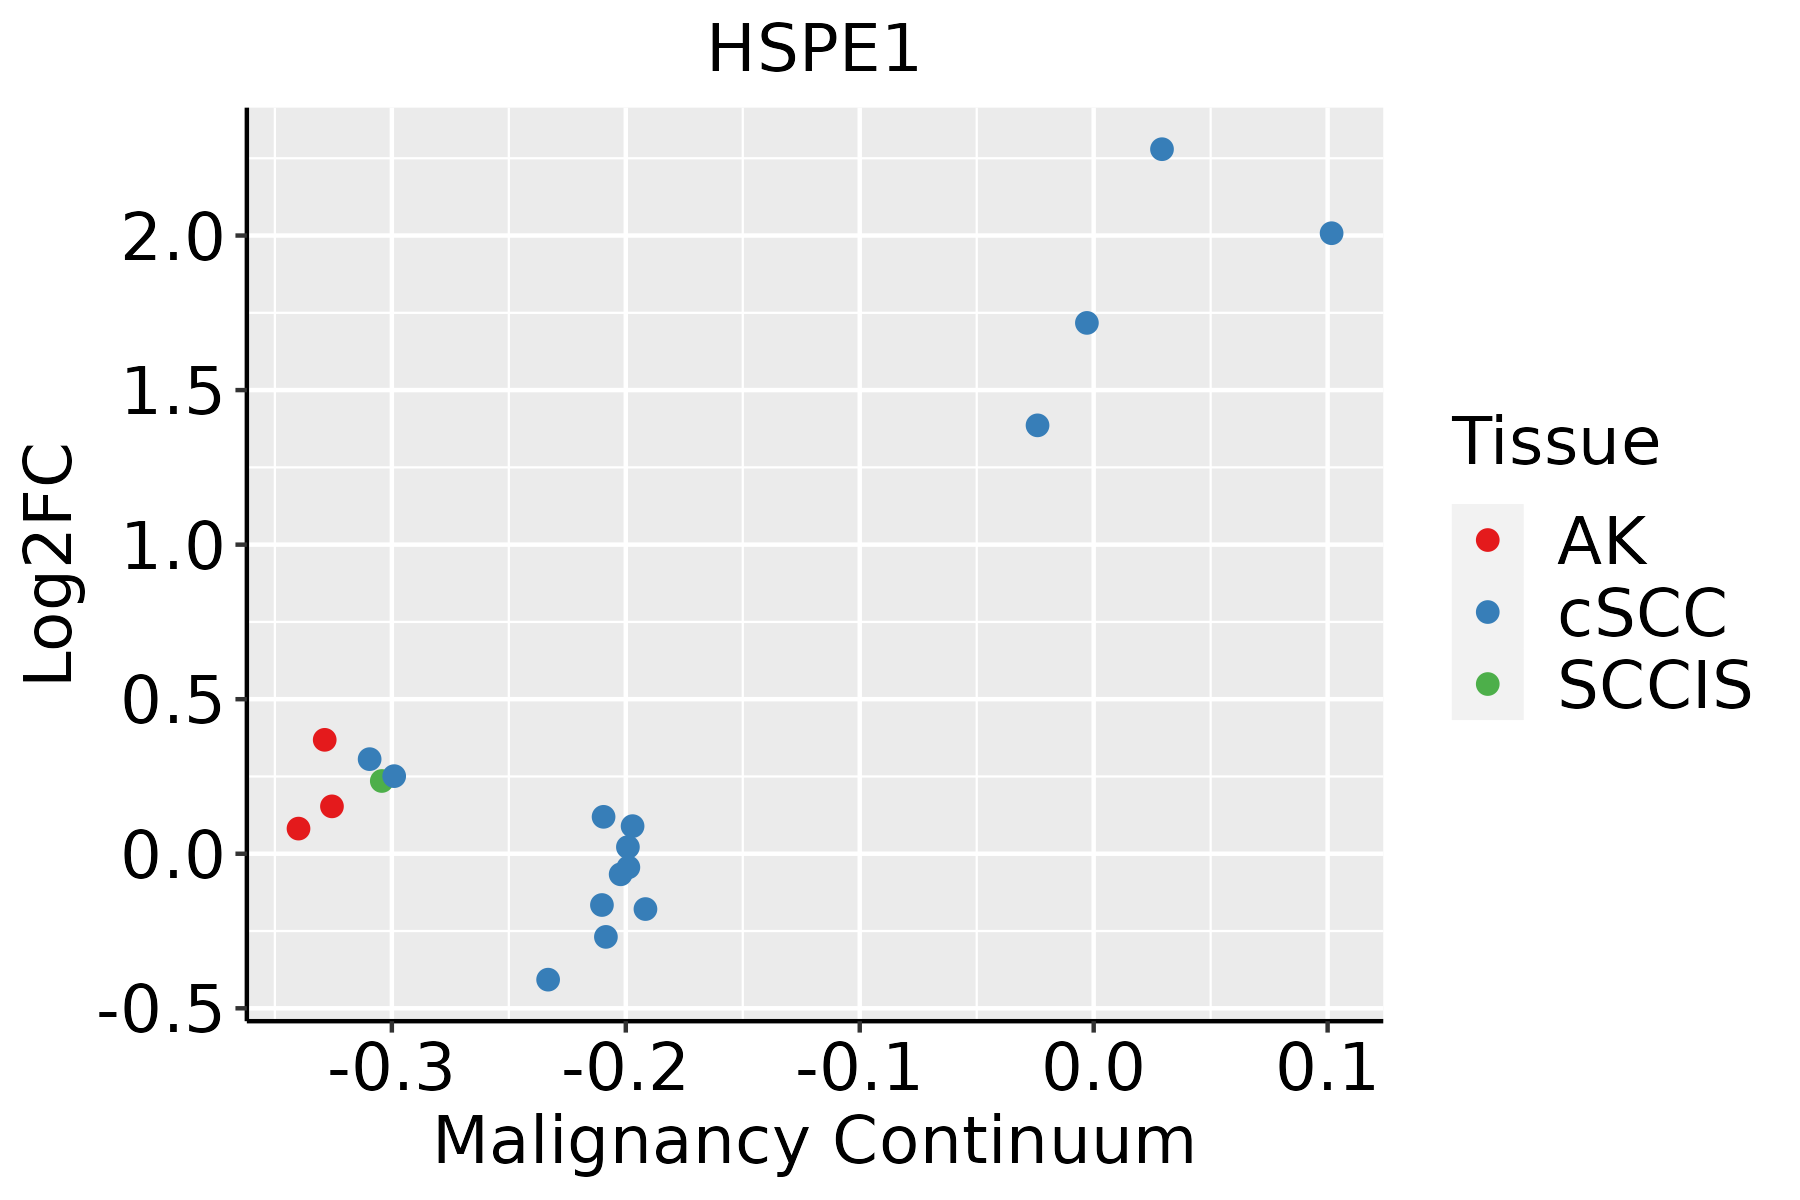 | AK: Actinic keratosis |
| cSCC: Cutaneous squamous cell carcinoma | ||
| SCCIS:squamous cell carcinoma in situ | ||
| Thyroid | 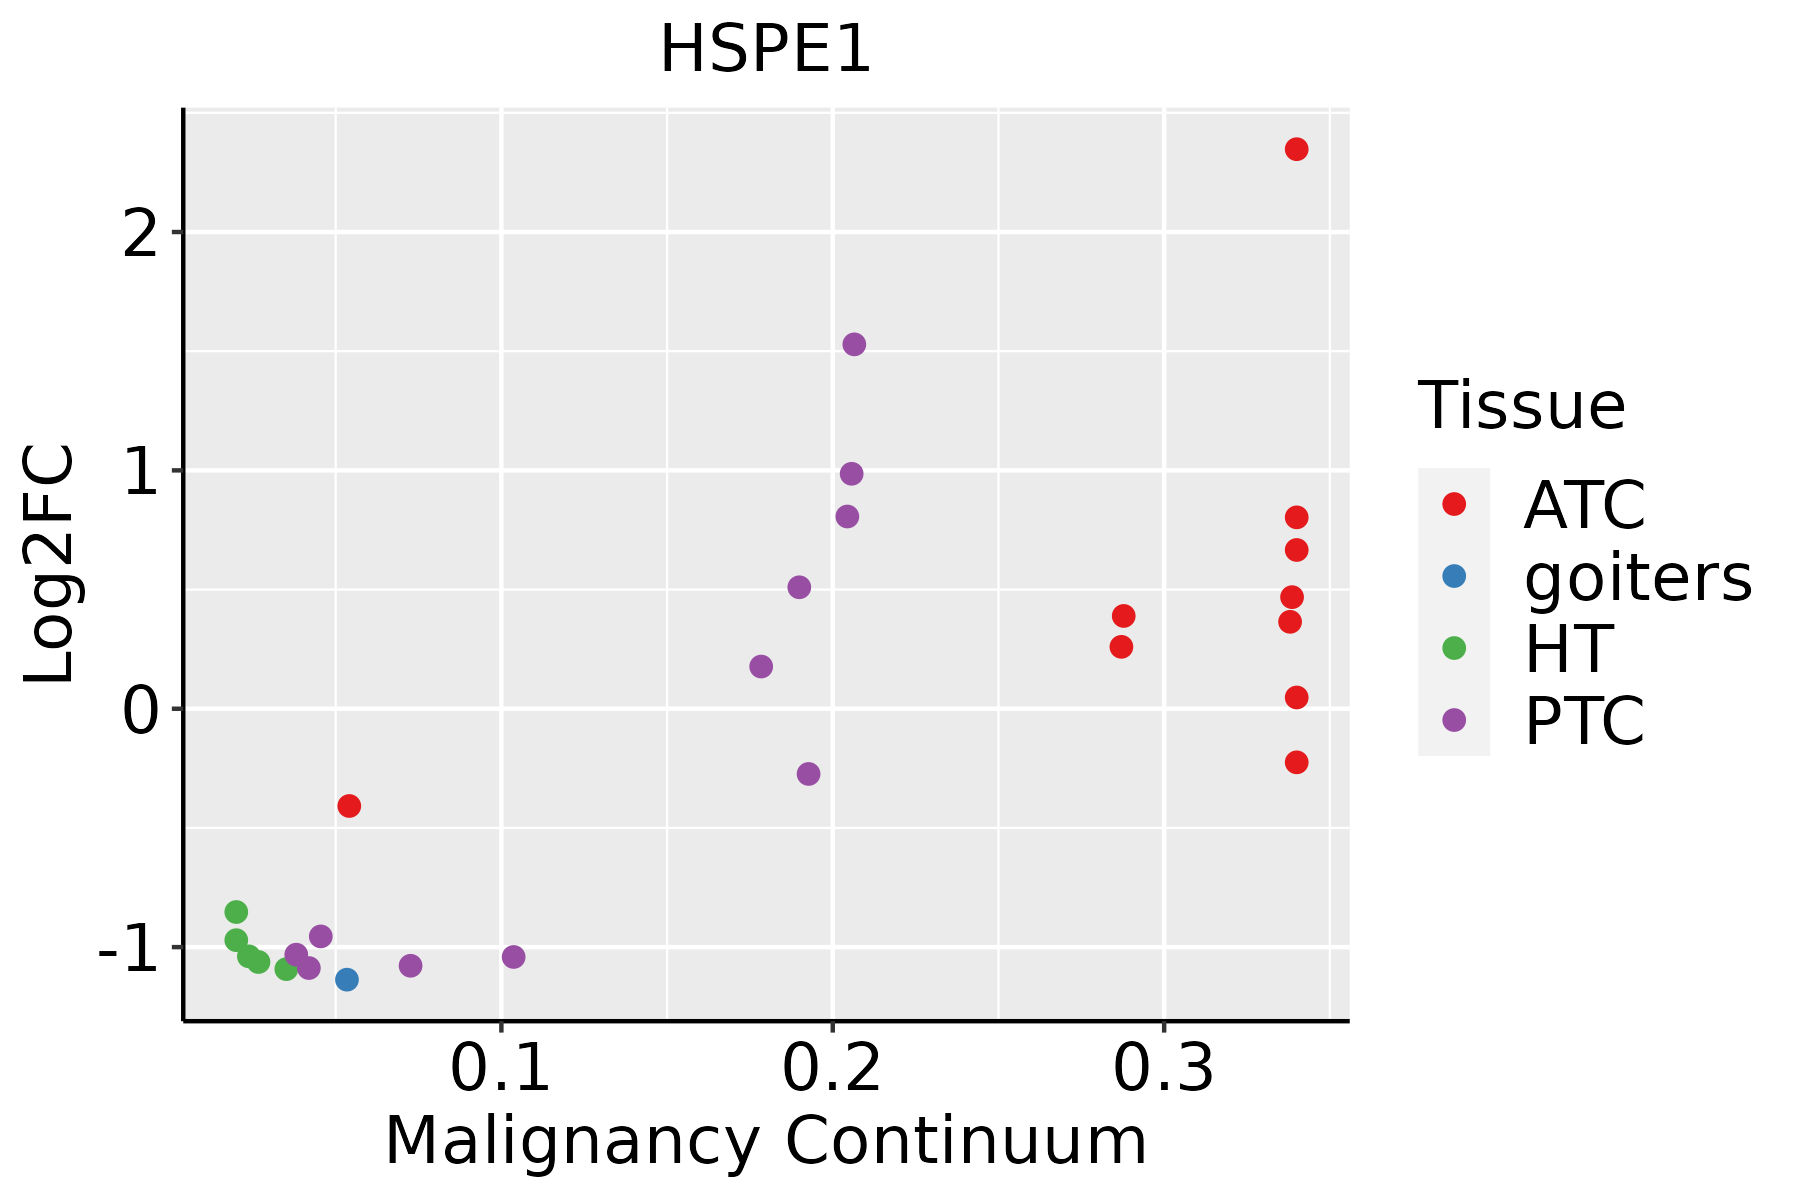 | ATC: Anaplastic thyroid cancer |
| HT: Hashimoto's thyroiditis | ||
| PTC: Papillary thyroid cancer |
| ∗log2FC in expression of this searched gene in stem-like cells from each diseased tissue sample relative to stem-like cells in normal samples in each tissue plotted against the malignancy continuum. Samples are colored based on if they are from different disease stage. |
Top |
Malignant transformation related pathway analysis |
| Find out the enriched GO biological processes and KEGG pathways involved in transition from healthy to precancer to cancer |
| Tissue | Disease Stage | Enriched GO biological Processes |
| Colorectum | AD |  |
| Colorectum | SER |  |
| Colorectum | MSS |  |
| Colorectum | MSI-H |  |
| Colorectum | FAP |  |
| ∗Top 15 enriched GO BP terms are showed in the bar plot of each disease state in each tissue. Each row represents a significant GO biological process which is colored according to the -log10(p.adjust). |
| Page: 1 2 3 4 5 6 7 8 9 |
| GO ID | Tissue | Disease Stage | Description | Gene Ratio | Bg Ratio | pvalue | p.adjust | Count |
| GO:00525479 | Breast | Precancer | regulation of peptidase activity | 71/1080 | 461/18723 | 2.72e-14 | 6.94e-12 | 71 |
| GO:00525489 | Breast | Precancer | regulation of endopeptidase activity | 67/1080 | 432/18723 | 1.06e-13 | 2.36e-11 | 67 |
| GO:00064578 | Breast | Precancer | protein folding | 43/1080 | 212/18723 | 3.48e-13 | 7.45e-11 | 43 |
| GO:20001169 | Breast | Precancer | regulation of cysteine-type endopeptidase activity | 43/1080 | 235/18723 | 1.30e-11 | 1.83e-09 | 43 |
| GO:00432819 | Breast | Precancer | regulation of cysteine-type endopeptidase activity involved in apoptotic process | 40/1080 | 209/18723 | 1.59e-11 | 2.07e-09 | 40 |
| GO:00064588 | Breast | Precancer | 'de novo' protein folding | 16/1080 | 43/18723 | 8.14e-10 | 6.92e-08 | 16 |
| GO:00069869 | Breast | Precancer | response to unfolded protein | 28/1080 | 137/18723 | 3.81e-09 | 3.00e-07 | 28 |
| GO:00610778 | Breast | Precancer | chaperone-mediated protein folding | 19/1080 | 67/18723 | 4.22e-09 | 3.28e-07 | 19 |
| GO:00458629 | Breast | Precancer | positive regulation of proteolysis | 51/1080 | 372/18723 | 7.77e-09 | 5.70e-07 | 51 |
| GO:00510848 | Breast | Precancer | 'de novo' posttranslational protein folding | 14/1080 | 39/18723 | 1.61e-08 | 1.12e-06 | 14 |
| GO:00510858 | Breast | Precancer | chaperone cofactor-dependent protein refolding | 13/1080 | 34/18723 | 2.17e-08 | 1.47e-06 | 13 |
| GO:00359669 | Breast | Precancer | response to topologically incorrect protein | 29/1080 | 159/18723 | 3.00e-08 | 1.89e-06 | 29 |
| GO:00109529 | Breast | Precancer | positive regulation of peptidase activity | 33/1080 | 197/18723 | 3.01e-08 | 1.89e-06 | 33 |
| GO:00432808 | Breast | Precancer | positive regulation of cysteine-type endopeptidase activity involved in apoptotic process | 24/1080 | 129/18723 | 3.13e-07 | 1.50e-05 | 24 |
| GO:00109509 | Breast | Precancer | positive regulation of endopeptidase activity | 29/1080 | 179/18723 | 4.23e-07 | 1.90e-05 | 29 |
| GO:20010568 | Breast | Precancer | positive regulation of cysteine-type endopeptidase activity | 25/1080 | 148/18723 | 1.19e-06 | 4.60e-05 | 25 |
| GO:00069193 | Breast | Precancer | activation of cysteine-type endopeptidase activity involved in apoptotic process | 14/1080 | 78/18723 | 1.33e-04 | 2.31e-03 | 14 |
| GO:00016496 | Breast | Precancer | osteoblast differentiation | 27/1080 | 229/18723 | 3.35e-04 | 4.73e-03 | 27 |
| GO:00015036 | Breast | Precancer | ossification | 36/1080 | 408/18723 | 7.53e-03 | 4.98e-02 | 36 |
| GO:005254714 | Breast | IDC | regulation of peptidase activity | 96/1434 | 461/18723 | 7.58e-20 | 6.15e-17 | 96 |
| Page: 1 2 3 4 5 6 7 8 9 10 11 12 13 14 15 16 17 18 19 20 21 22 23 24 25 26 27 28 29 30 |
| Pathway ID | Tissue | Disease Stage | Description | Gene Ratio | Bg Ratio | pvalue | p.adjust | qvalue | Count |
| Page: 1 |
Top |
Cell-cell communication analysis |
| Identification of potential cell-cell interactions between two cell types and their ligand-receptor pairs for different disease states |
| Ligand | Receptor | LRpair | Pathway | Tissue | Disease Stage |
| Page: 1 |
Top |
Single-cell gene regulatory network inference analysis |
| Find out the significant the regulons (TFs) and the target genes of each regulon across cell types for different disease states |
| TF | Cell Type | Tissue | Disease Stage | Target Gene | RSS | Regulon Activity |
| ∗The dot plots of a searched regulon are shown for all cell subpopulations in each disease state of each tissue based on the regulon specific score inferred using pySCENIC and by calculating the average expression. |
| Page: 1 |
Top |
Somatic mutation of malignant transformation related genes |
| Annotation of somatic variants for genes involved in malignant transformation |
| Hugo Symbol | Variant Class | Variant Classification | dbSNP RS | HGVSc | HGVSp | HGVSp Short | SWISSPROT | BIOTYPE | SIFT | PolyPhen | Tumor Sample Barcode | Tissue | Histology | Sex | Age | Stage | Therapy Types | Drugs | Outcome |
| HSPE1 | SNV | Missense_Mutation | c.4N>A | p.Ala2Thr | p.A2T | P61604 | protein_coding | deleterious(0.05) | benign(0.027) | TCGA-DM-A1HB-01 | Colorectum | colon adenocarcinoma | Male | >=65 | III/IV | Unknown | Unknown | SD | |
| HSPE1 | SNV | Missense_Mutation | c.175N>A | p.Glu59Lys | p.E59K | P61604 | protein_coding | tolerated(0.45) | benign(0.019) | TCGA-B5-A11E-01 | Endometrium | uterine corpus endometrioid carcinoma | Female | <65 | I/II | Unknown | Unknown | SD | |
| HSPE1 | SNV | Missense_Mutation | novel | c.212N>C | p.Val71Ala | p.V71A | P61604 | protein_coding | deleterious(0) | possibly_damaging(0.741) | TCGA-DI-A1BU-01 | Endometrium | uterine corpus endometrioid carcinoma | Female | <65 | I/II | Chemotherapy | paclitaxel | SD |
| HSPE1 | SNV | Missense_Mutation | novel | c.203N>C | p.Gly68Ala | p.G68A | P61604 | protein_coding | deleterious(0) | probably_damaging(0.936) | TCGA-P3-A5QF-01 | Oral cavity | head & neck squamous cell carcinoma | Male | <65 | I/II | Chemotherapy | cetuximab | PD |
| HSPE1 | SNV | Missense_Mutation | novel | c.70G>A | p.Glu24Lys | p.E24K | P61604 | protein_coding | tolerated(0.28) | benign(0.053) | TCGA-T2-A6WZ-01 | Oral cavity | head & neck squamous cell carcinoma | Male | <65 | III/IV | Chemotherapy | cetuximab | PD |
| Page: 1 |
Top |
Related drugs of malignant transformation related genes |
| Identification of chemicals and drugs interact with genes involved in malignant transfromation |
| (DGIdb 4.0) |
| Entrez ID | Symbol | Category | Interaction Types | Drug Claim Name | Drug Name | PMIDs |
| 3336 | HSPE1 | NA | XToll |
| Page: 1 |

Copyright 2023-Present -The University of Texas Health Science Center at Houston |