| Tissue | Expression Dynamics | Abbreviation |
| Colorectum (GSE201348) |  | FAP: Familial adenomatous polyposis |
| CRC: Colorectal cancer |
| Colorectum (HTA11) |  | AD: Adenomas |
| SER: Sessile serrated lesions |
| MSI-H: Microsatellite-high colorectal cancer |
| MSS: Microsatellite stable colorectal cancer |
| Esophagus | 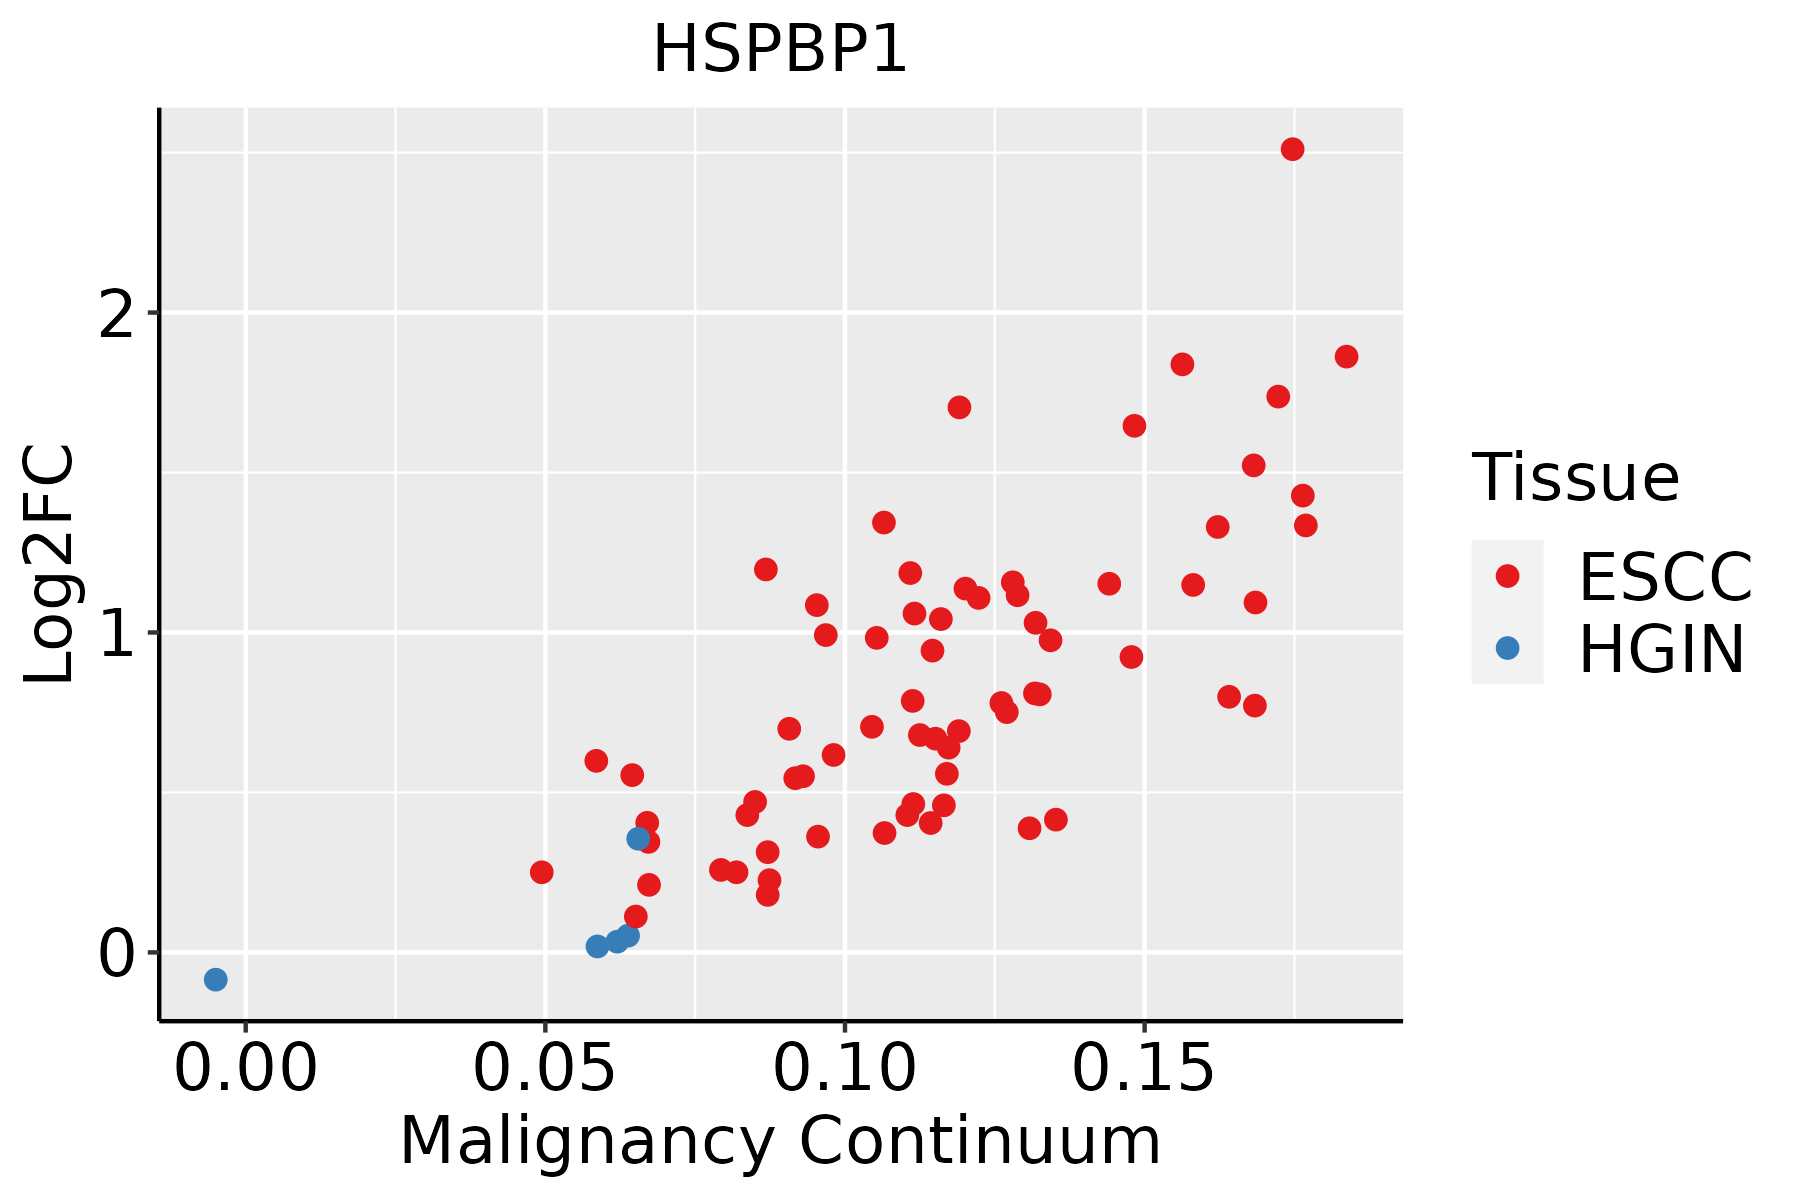 | ESCC: Esophageal squamous cell carcinoma |
| HGIN: High-grade intraepithelial neoplasias |
| LGIN: Low-grade intraepithelial neoplasias |
| Liver | 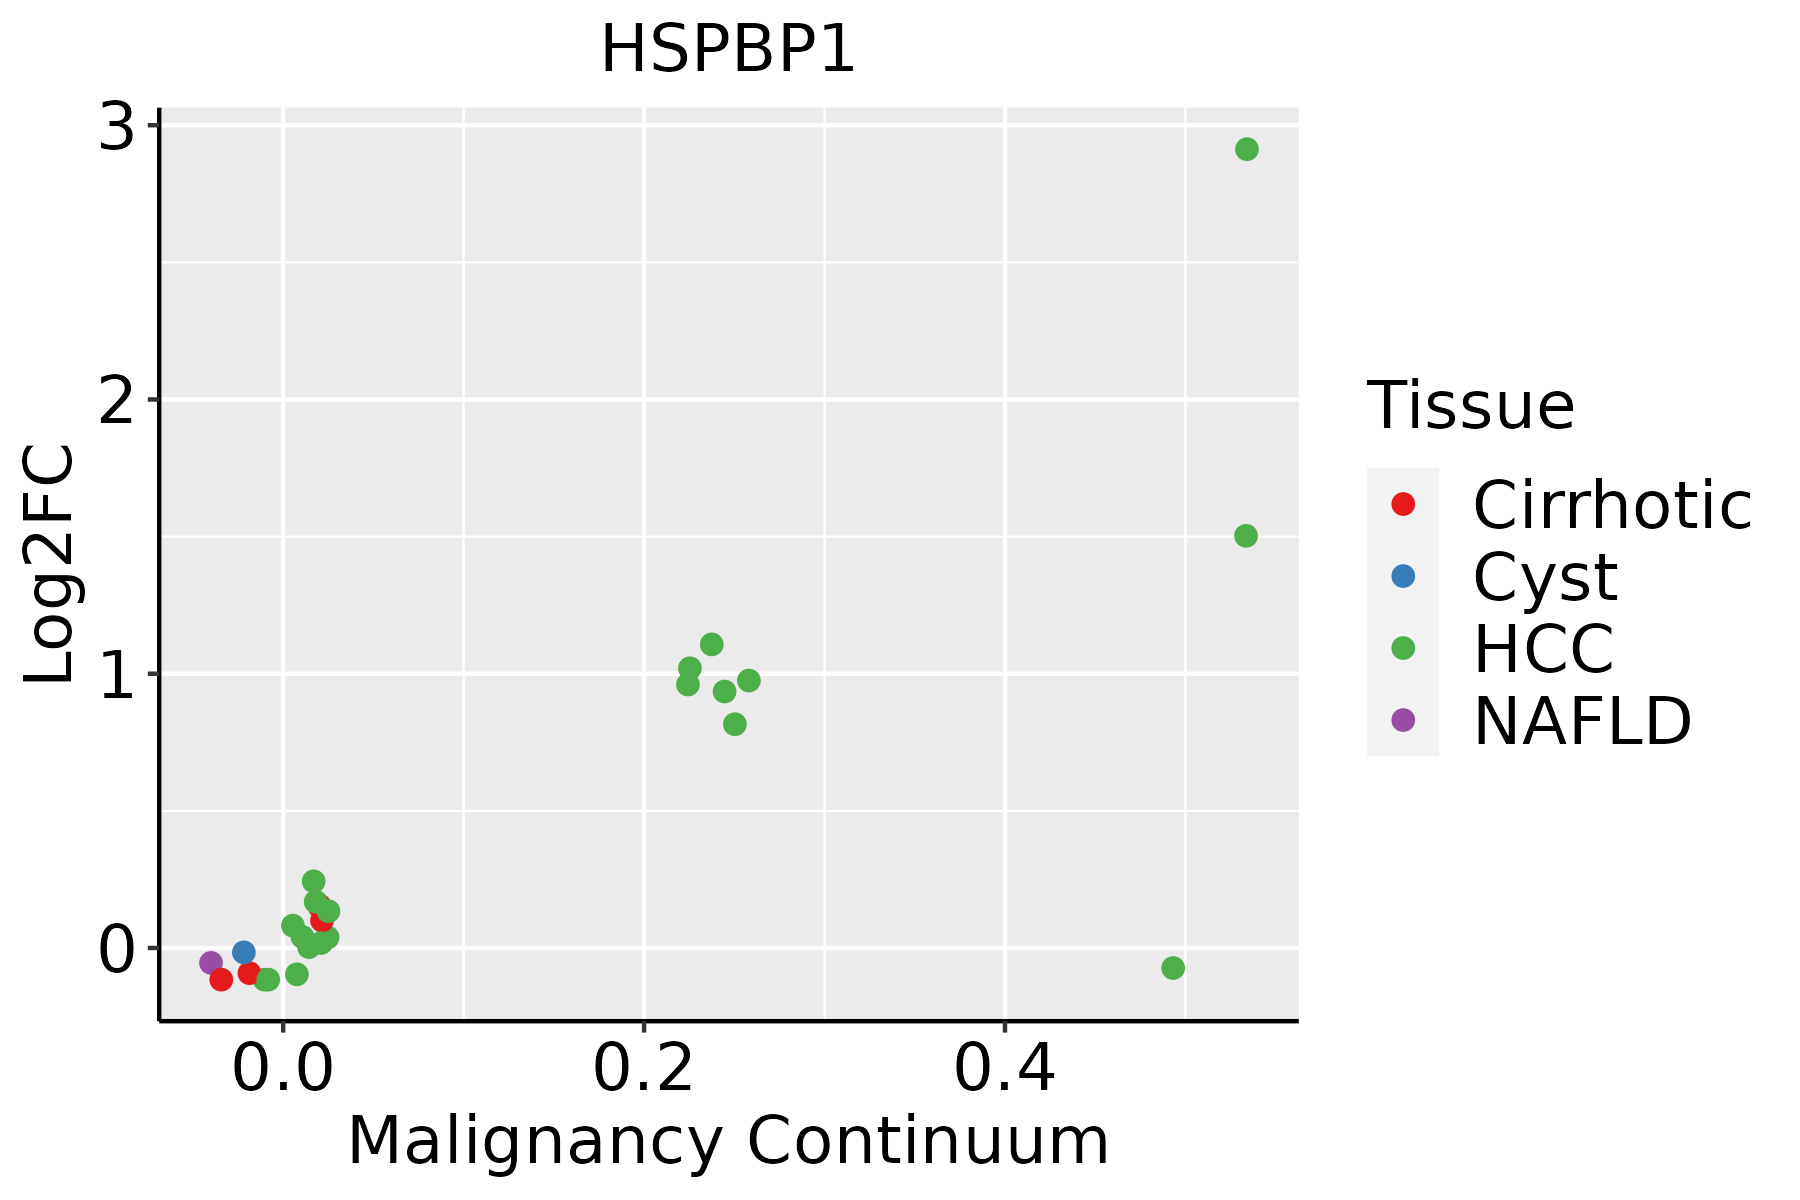 | HCC: Hepatocellular carcinoma |
| NAFLD: Non-alcoholic fatty liver disease |
| Oral Cavity |  | EOLP: Erosive Oral lichen planus |
| LP: leukoplakia |
| NEOLP: Non-erosive oral lichen planus |
| OSCC: Oral squamous cell carcinoma |
| Skin | 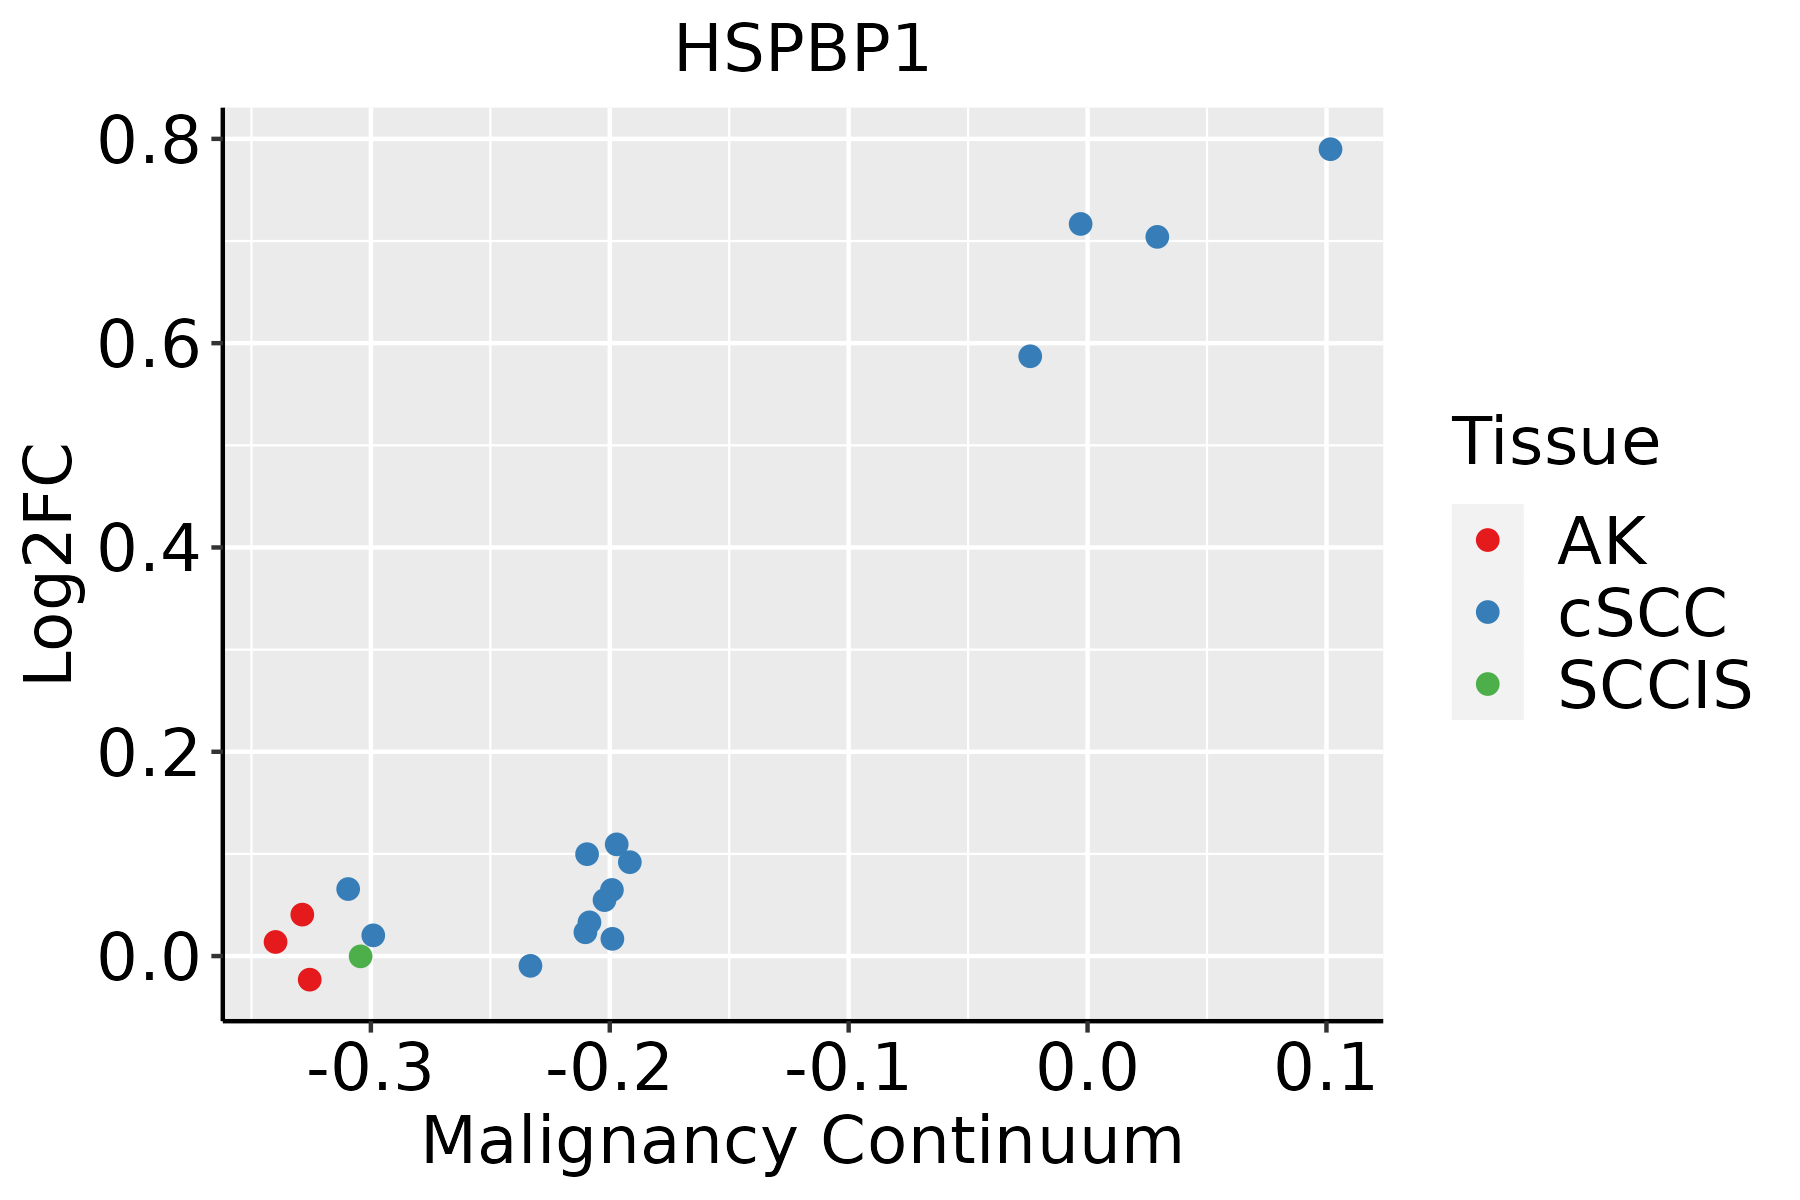 | AK: Actinic keratosis |
| cSCC: Cutaneous squamous cell carcinoma |
| SCCIS:squamous cell carcinoma in situ |
| Thyroid | 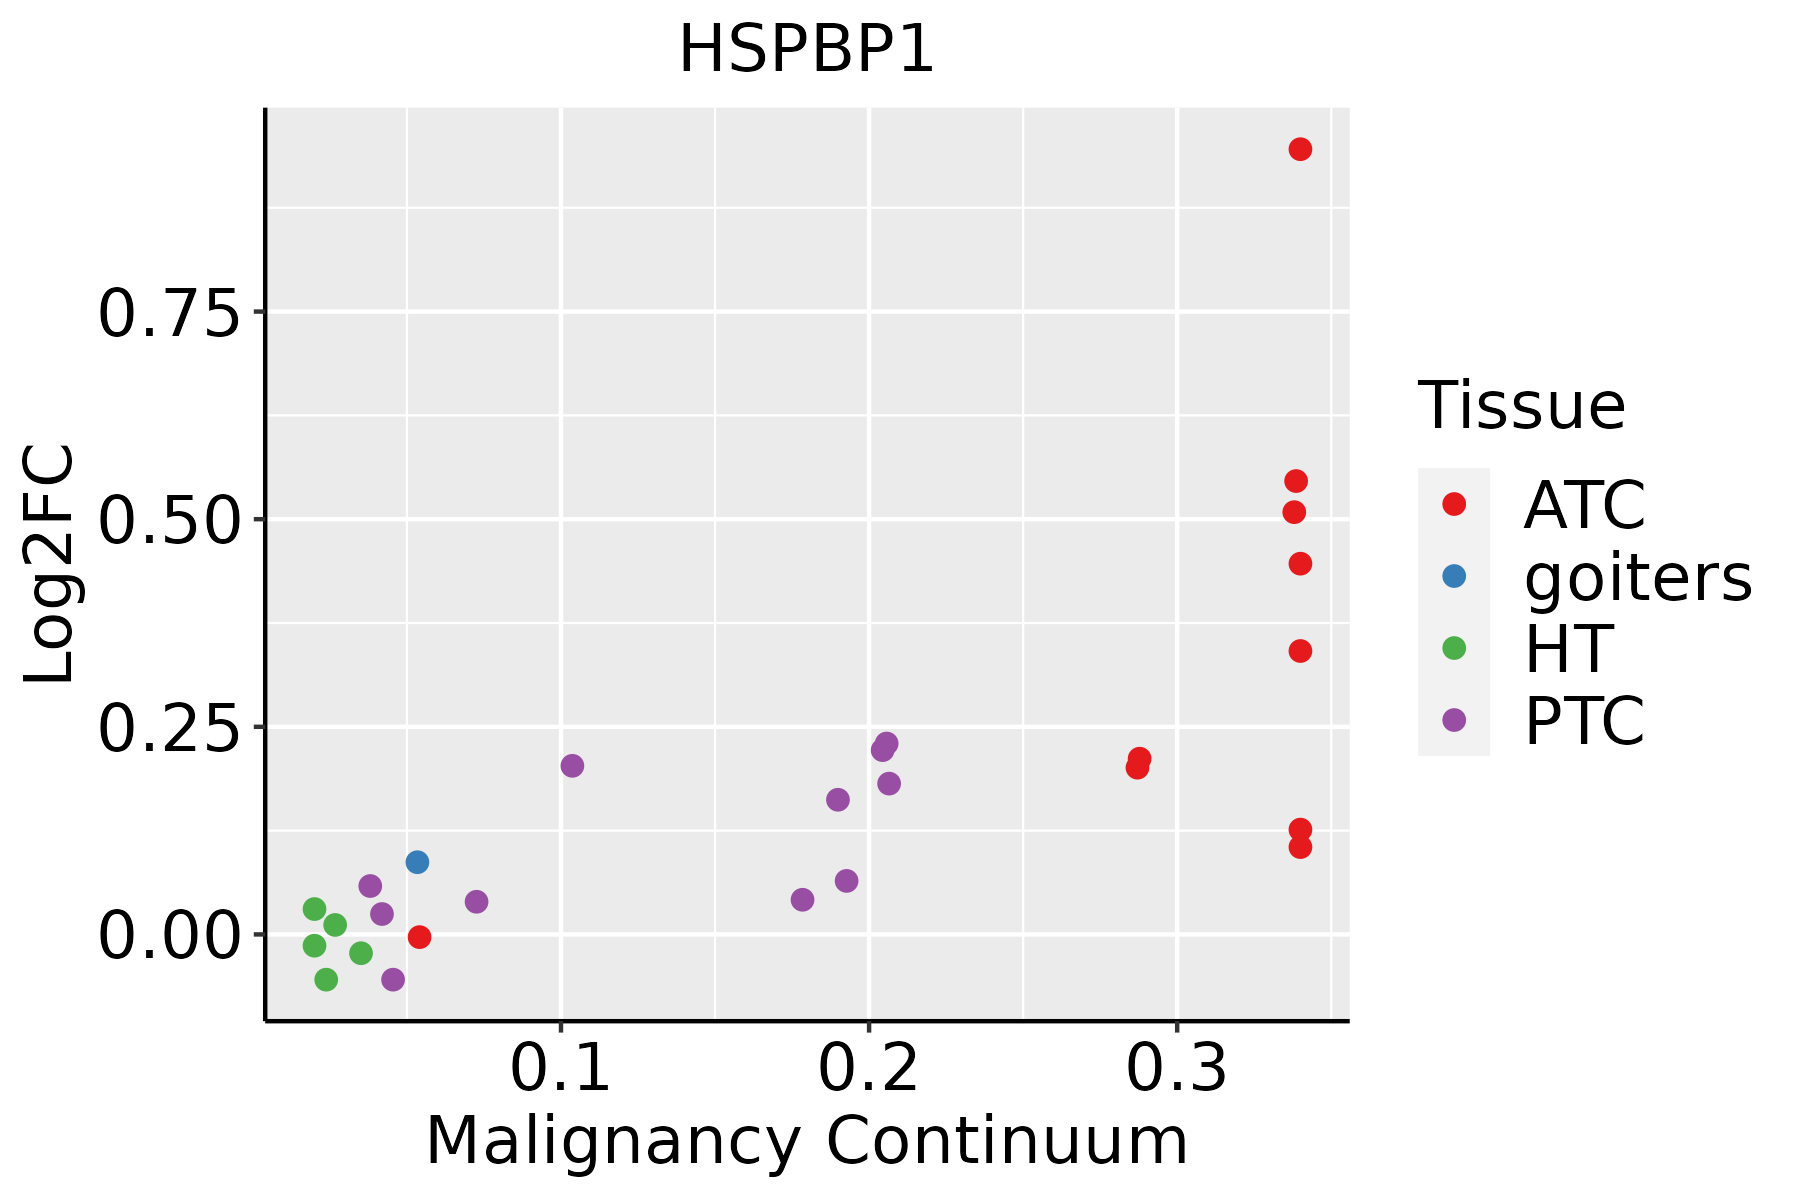 | ATC: Anaplastic thyroid cancer |
| HT: Hashimoto's thyroiditis |
| PTC: Papillary thyroid cancer |
| GO ID | Tissue | Disease Stage | Description | Gene Ratio | Bg Ratio | pvalue | p.adjust | Count |
| GO:0042176 | Colorectum | AD | regulation of protein catabolic process | 160/3918 | 391/18723 | 1.06e-19 | 7.34e-17 | 160 |
| GO:0009896 | Colorectum | AD | positive regulation of catabolic process | 180/3918 | 492/18723 | 4.33e-16 | 1.94e-13 | 180 |
| GO:1903362 | Colorectum | AD | regulation of cellular protein catabolic process | 109/3918 | 255/18723 | 2.14e-15 | 6.08e-13 | 109 |
| GO:0010498 | Colorectum | AD | proteasomal protein catabolic process | 174/3918 | 490/18723 | 3.18e-14 | 7.66e-12 | 174 |
| GO:0031331 | Colorectum | AD | positive regulation of cellular catabolic process | 156/3918 | 427/18723 | 4.68e-14 | 1.05e-11 | 156 |
| GO:1903050 | Colorectum | AD | regulation of proteolysis involved in cellular protein catabolic process | 92/3918 | 221/18723 | 2.04e-12 | 3.19e-10 | 92 |
| GO:0045732 | Colorectum | AD | positive regulation of protein catabolic process | 92/3918 | 231/18723 | 3.85e-11 | 4.47e-09 | 92 |
| GO:0043161 | Colorectum | AD | proteasome-mediated ubiquitin-dependent protein catabolic process | 141/3918 | 412/18723 | 1.77e-10 | 1.68e-08 | 141 |
| GO:0045862 | Colorectum | AD | positive regulation of proteolysis | 129/3918 | 372/18723 | 4.04e-10 | 3.46e-08 | 129 |
| GO:0061136 | Colorectum | AD | regulation of proteasomal protein catabolic process | 75/3918 | 187/18723 | 1.65e-09 | 1.20e-07 | 75 |
| GO:2000058 | Colorectum | AD | regulation of ubiquitin-dependent protein catabolic process | 68/3918 | 164/18723 | 1.82e-09 | 1.31e-07 | 68 |
| GO:1903364 | Colorectum | AD | positive regulation of cellular protein catabolic process | 62/3918 | 155/18723 | 4.66e-08 | 2.51e-06 | 62 |
| GO:1903320 | Colorectum | AD | regulation of protein modification by small protein conjugation or removal | 86/3918 | 242/18723 | 9.43e-08 | 4.65e-06 | 86 |
| GO:0032434 | Colorectum | AD | regulation of proteasomal ubiquitin-dependent protein catabolic process | 54/3918 | 134/18723 | 2.51e-07 | 1.02e-05 | 54 |
| GO:1903052 | Colorectum | AD | positive regulation of proteolysis involved in cellular protein catabolic process | 53/3918 | 133/18723 | 4.93e-07 | 1.85e-05 | 53 |
| GO:2000060 | Colorectum | AD | positive regulation of ubiquitin-dependent protein catabolic process | 44/3918 | 107/18723 | 1.65e-06 | 5.03e-05 | 44 |
| GO:0006457 | Colorectum | AD | protein folding | 73/3918 | 212/18723 | 3.24e-06 | 9.10e-05 | 73 |
| GO:0031396 | Colorectum | AD | regulation of protein ubiquitination | 72/3918 | 210/18723 | 4.50e-06 | 1.21e-04 | 72 |
| GO:1901800 | Colorectum | AD | positive regulation of proteasomal protein catabolic process | 44/3918 | 114/18723 | 1.18e-05 | 2.62e-04 | 44 |
| GO:0032436 | Colorectum | AD | positive regulation of proteasomal ubiquitin-dependent protein catabolic process | 36/3918 | 90/18723 | 2.89e-05 | 5.37e-04 | 36 |
| Pathway ID | Tissue | Disease Stage | Description | Gene Ratio | Bg Ratio | pvalue | p.adjust | qvalue | Count |
| hsa04141 | Colorectum | AD | Protein processing in endoplasmic reticulum | 80/2092 | 174/8465 | 5.96e-10 | 1.25e-08 | 7.96e-09 | 80 |
| hsa041411 | Colorectum | AD | Protein processing in endoplasmic reticulum | 80/2092 | 174/8465 | 5.96e-10 | 1.25e-08 | 7.96e-09 | 80 |
| hsa041412 | Colorectum | SER | Protein processing in endoplasmic reticulum | 60/1580 | 174/8465 | 4.20e-07 | 7.33e-06 | 5.32e-06 | 60 |
| hsa041413 | Colorectum | SER | Protein processing in endoplasmic reticulum | 60/1580 | 174/8465 | 4.20e-07 | 7.33e-06 | 5.32e-06 | 60 |
| hsa041414 | Colorectum | MSS | Protein processing in endoplasmic reticulum | 75/1875 | 174/8465 | 3.78e-10 | 8.44e-09 | 5.17e-09 | 75 |
| hsa041415 | Colorectum | MSS | Protein processing in endoplasmic reticulum | 75/1875 | 174/8465 | 3.78e-10 | 8.44e-09 | 5.17e-09 | 75 |
| hsa04141211 | Esophagus | ESCC | Protein processing in endoplasmic reticulum | 147/4205 | 174/8465 | 3.29e-22 | 1.10e-19 | 5.64e-20 | 147 |
| hsa04141310 | Esophagus | ESCC | Protein processing in endoplasmic reticulum | 147/4205 | 174/8465 | 3.29e-22 | 1.10e-19 | 5.64e-20 | 147 |
| hsa0414114 | Liver | Cirrhotic | Protein processing in endoplasmic reticulum | 114/2530 | 174/8465 | 1.16e-22 | 9.67e-21 | 5.96e-21 | 114 |
| hsa0414115 | Liver | Cirrhotic | Protein processing in endoplasmic reticulum | 114/2530 | 174/8465 | 1.16e-22 | 9.67e-21 | 5.96e-21 | 114 |
| hsa0414122 | Liver | HCC | Protein processing in endoplasmic reticulum | 146/4020 | 174/8465 | 7.34e-24 | 2.46e-21 | 1.37e-21 | 146 |
| hsa0414132 | Liver | HCC | Protein processing in endoplasmic reticulum | 146/4020 | 174/8465 | 7.34e-24 | 2.46e-21 | 1.37e-21 | 146 |
| hsa0414130 | Oral cavity | OSCC | Protein processing in endoplasmic reticulum | 143/3704 | 174/8465 | 6.82e-26 | 2.28e-23 | 1.16e-23 | 143 |
| hsa04141113 | Oral cavity | OSCC | Protein processing in endoplasmic reticulum | 143/3704 | 174/8465 | 6.82e-26 | 2.28e-23 | 1.16e-23 | 143 |
| hsa04141210 | Oral cavity | LP | Protein processing in endoplasmic reticulum | 113/2418 | 174/8465 | 8.74e-24 | 5.82e-22 | 3.76e-22 | 113 |
| hsa0414138 | Oral cavity | LP | Protein processing in endoplasmic reticulum | 113/2418 | 174/8465 | 8.74e-24 | 5.82e-22 | 3.76e-22 | 113 |
| Hugo Symbol | Variant Class | Variant Classification | dbSNP RS | HGVSc | HGVSp | HGVSp Short | SWISSPROT | BIOTYPE | SIFT | PolyPhen | Tumor Sample Barcode | Tissue | Histology | Sex | Age | Stage | Therapy Types | Drugs | Outcome |
| HSPBP1 | SNV | Missense_Mutation | rs764285622 | c.107C>T | p.Ser36Leu | p.S36L | Q9NZL4 | protein_coding | tolerated(0.08) | benign(0.206) | TCGA-C5-A2LZ-01 | Cervix | cervical & endocervical cancer | Female | >=65 | III/IV | Unknown | Unknown | PD |
| HSPBP1 | SNV | Missense_Mutation | novel | c.271N>C | p.Glu91Gln | p.E91Q | Q9NZL4 | protein_coding | tolerated(0.09) | benign(0.124) | TCGA-R2-A69V-01 | Cervix | cervical & endocervical cancer | Female | <65 | I/II | Chemotherapy | cisplatin | SD |
| HSPBP1 | deletion | Frame_Shift_Del | novel | c.37delN | p.Leu13TrpfsTer55 | p.L13Wfs*55 | Q9NZL4 | protein_coding | | | TCGA-MA-AA42-01 | Cervix | cervical & endocervical cancer | Female | >=65 | I/II | Unknown | Unknown | SD |
| HSPBP1 | SNV | Missense_Mutation | rs141743392 | c.512N>T | p.Thr171Met | p.T171M | Q9NZL4 | protein_coding | deleterious(0.01) | probably_damaging(0.976) | TCGA-WS-AB45-01 | Colorectum | colon adenocarcinoma | Female | <65 | I/II | Unknown | Unknown | SD |
| HSPBP1 | SNV | Missense_Mutation | | c.215N>A | p.Arg72His | p.R72H | Q9NZL4 | protein_coding | deleterious(0.01) | probably_damaging(0.999) | TCGA-EI-6882-01 | Colorectum | rectum adenocarcinoma | Male | <65 | I/II | Unknown | Unknown | SD |
| HSPBP1 | SNV | Missense_Mutation | rs755814307 | c.1063G>A | p.Asp355Asn | p.D355N | Q9NZL4 | protein_coding | tolerated(0.36) | possibly_damaging(0.736) | TCGA-AP-A0LM-01 | Endometrium | uterine corpus endometrioid carcinoma | Female | <65 | III/IV | Chemotherapy | cisplatin | SD |
| HSPBP1 | SNV | Missense_Mutation | | c.139G>T | p.Gly47Cys | p.G47C | Q9NZL4 | protein_coding | deleterious(0) | probably_damaging(0.976) | TCGA-AP-A0LM-01 | Endometrium | uterine corpus endometrioid carcinoma | Female | <65 | III/IV | Chemotherapy | cisplatin | SD |
| HSPBP1 | SNV | Missense_Mutation | novel | c.53C>T | p.Ala18Val | p.A18V | Q9NZL4 | protein_coding | tolerated_low_confidence(0.12) | benign(0.375) | TCGA-AP-A1DK-01 | Endometrium | uterine corpus endometrioid carcinoma | Female | <65 | I/II | Unknown | Unknown | SD |
| HSPBP1 | SNV | Missense_Mutation | novel | c.874N>T | p.Val292Leu | p.V292L | Q9NZL4 | protein_coding | tolerated(0.15) | benign(0.01) | TCGA-AP-A1E0-01 | Endometrium | uterine corpus endometrioid carcinoma | Female | <65 | III/IV | Chemotherapy | paclitaxel | SD |
| HSPBP1 | SNV | Missense_Mutation | | c.688G>A | p.Asp230Asn | p.D230N | Q9NZL4 | protein_coding | tolerated(0.09) | possibly_damaging(0.644) | TCGA-B5-A11U-01 | Endometrium | uterine corpus endometrioid carcinoma | Female | >=65 | III/IV | Unknown | Unknown | SD |


