
|
|||||
|
 | |
| |
| |
| |
| |
| |
|
Gene: HSPB8 |
Gene summary for HSPB8 |
| Gene information | Species | Human | Gene symbol | HSPB8 | Gene ID | 26353 |
| Gene name | heat shock protein family B (small) member 8 | |
| Gene Alias | CMT2L | |
| Cytomap | 12q24.23 | |
| Gene Type | protein-coding | GO ID | GO:0006914 | UniProtAcc | Q9UJY1 |
Top |
Malignant transformation analysis |
| Identification of the aberrant gene expression in precancerous and cancerous lesions by comparing the gene expression of stem-like cells in diseased tissues with normal stem cells |
| Entrez ID | Symbol | Replicates | Species | Organ | Tissue | Adj P-value | Log2FC | Malignancy |
| 26353 | HSPB8 | AEH-subject1 | Human | Endometrium | AEH | 1.50e-33 | 9.05e-01 | -0.3059 |
| 26353 | HSPB8 | AEH-subject2 | Human | Endometrium | AEH | 1.06e-07 | 3.57e-01 | -0.2525 |
| 26353 | HSPB8 | AEH-subject3 | Human | Endometrium | AEH | 1.23e-09 | 4.42e-01 | -0.2576 |
| 26353 | HSPB8 | AEH-subject4 | Human | Endometrium | AEH | 3.97e-02 | 2.43e-01 | -0.2657 |
| 26353 | HSPB8 | EEC-subject1 | Human | Endometrium | EEC | 1.19e-09 | 5.13e-01 | -0.2682 |
| 26353 | HSPB8 | EEC-subject2 | Human | Endometrium | EEC | 1.29e-03 | 2.69e-01 | -0.2607 |
| 26353 | HSPB8 | EEC-subject5 | Human | Endometrium | EEC | 7.46e-10 | 3.98e-01 | -0.249 |
| 26353 | HSPB8 | LZE4T | Human | Esophagus | ESCC | 1.11e-04 | -5.46e-01 | 0.0811 |
| 26353 | HSPB8 | LZE8T | Human | Esophagus | ESCC | 1.19e-02 | -1.71e-01 | 0.067 |
| 26353 | HSPB8 | P2T-E | Human | Esophagus | ESCC | 1.17e-06 | 5.55e-01 | 0.1177 |
| 26353 | HSPB8 | P4T-E | Human | Esophagus | ESCC | 1.07e-30 | 1.43e+00 | 0.1323 |
| 26353 | HSPB8 | P5T-E | Human | Esophagus | ESCC | 2.63e-24 | 1.15e+00 | 0.1327 |
| 26353 | HSPB8 | P8T-E | Human | Esophagus | ESCC | 1.96e-12 | 6.28e-01 | 0.0889 |
| 26353 | HSPB8 | P10T-E | Human | Esophagus | ESCC | 2.84e-04 | -4.28e-01 | 0.116 |
| 26353 | HSPB8 | P11T-E | Human | Esophagus | ESCC | 5.00e-12 | 1.92e+00 | 0.1426 |
| 26353 | HSPB8 | P12T-E | Human | Esophagus | ESCC | 2.11e-02 | -4.25e-01 | 0.1122 |
| 26353 | HSPB8 | P16T-E | Human | Esophagus | ESCC | 2.09e-14 | -4.75e-01 | 0.1153 |
| 26353 | HSPB8 | P19T-E | Human | Esophagus | ESCC | 1.07e-03 | 9.74e-01 | 0.1662 |
| 26353 | HSPB8 | P21T-E | Human | Esophagus | ESCC | 2.22e-05 | 4.61e-01 | 0.1617 |
| 26353 | HSPB8 | P22T-E | Human | Esophagus | ESCC | 2.85e-07 | -3.92e-01 | 0.1236 |
| Page: 1 2 3 |
| Tissue | Expression Dynamics | Abbreviation |
| Endometrium |  | AEH: Atypical endometrial hyperplasia |
| EEC: Endometrioid Cancer | ||
| Esophagus |  | ESCC: Esophageal squamous cell carcinoma |
| HGIN: High-grade intraepithelial neoplasias | ||
| LGIN: Low-grade intraepithelial neoplasias | ||
| Liver | 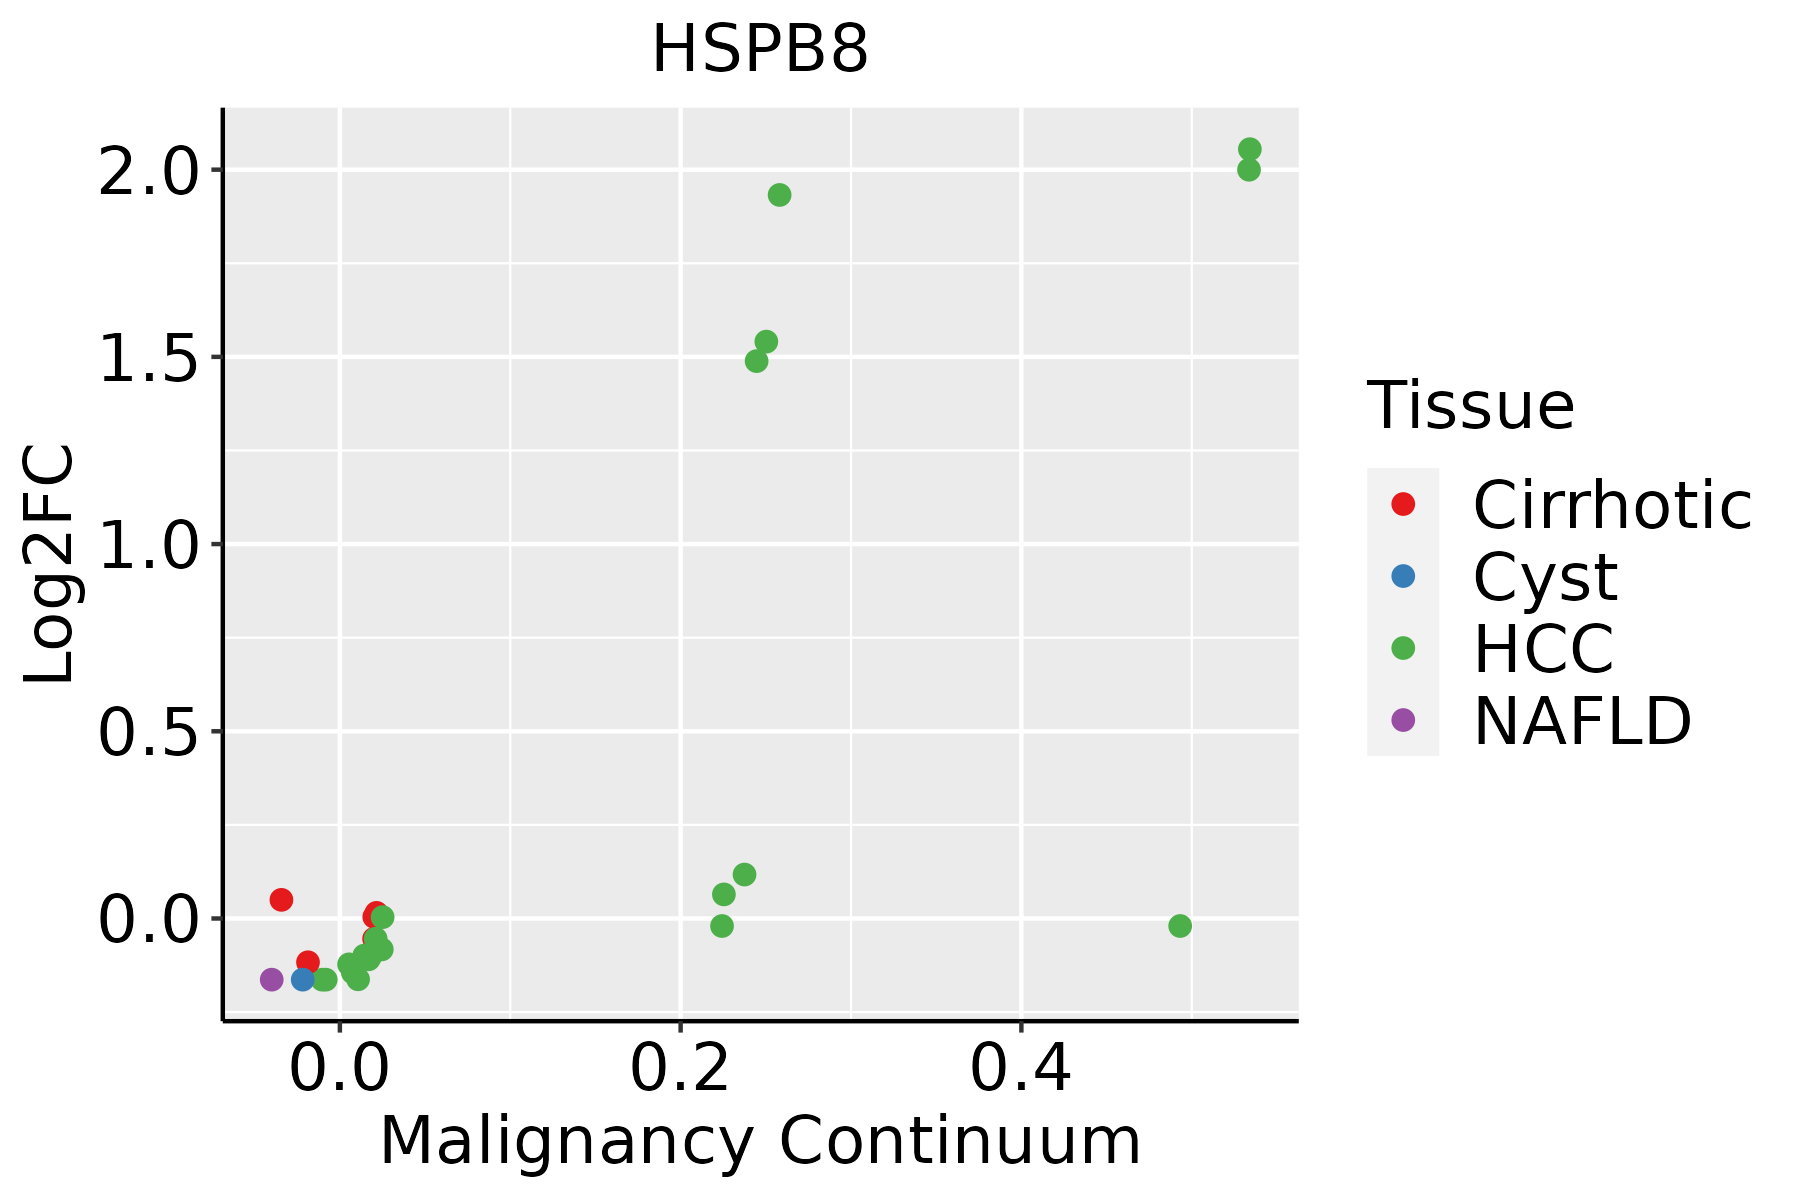 | HCC: Hepatocellular carcinoma |
| NAFLD: Non-alcoholic fatty liver disease | ||
| Oral Cavity |  | EOLP: Erosive Oral lichen planus |
| LP: leukoplakia | ||
| NEOLP: Non-erosive oral lichen planus | ||
| OSCC: Oral squamous cell carcinoma | ||
| Skin | 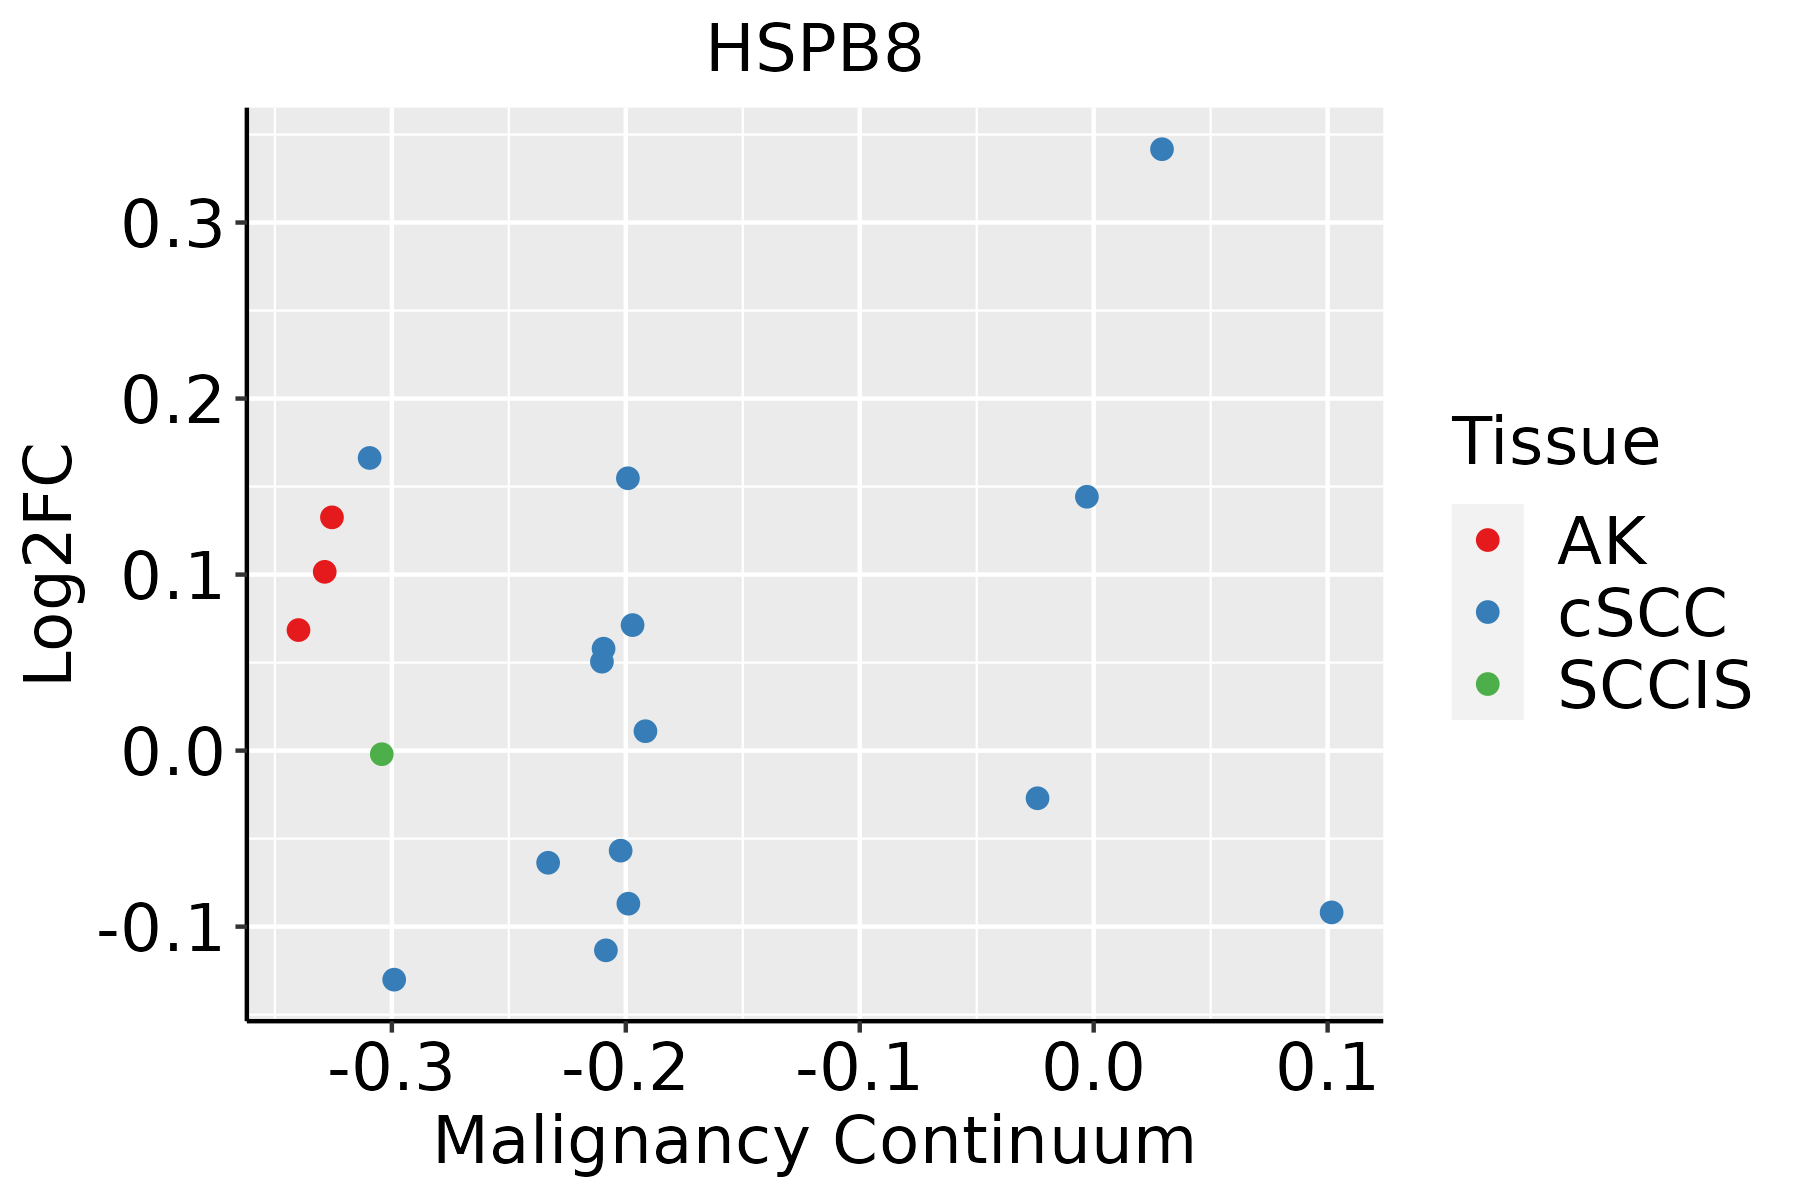 | AK: Actinic keratosis |
| cSCC: Cutaneous squamous cell carcinoma | ||
| SCCIS:squamous cell carcinoma in situ |
| ∗log2FC in expression of this searched gene in stem-like cells from each diseased tissue sample relative to stem-like cells in normal samples in each tissue plotted against the malignancy continuum. Samples are colored based on if they are from different disease stage. |
Top |
Malignant transformation related pathway analysis |
| Find out the enriched GO biological processes and KEGG pathways involved in transition from healthy to precancer to cancer |
| Tissue | Disease Stage | Enriched GO biological Processes |
| Colorectum | AD |  |
| Colorectum | SER |  |
| Colorectum | MSS |  |
| Colorectum | MSI-H |  |
| Colorectum | FAP |  |
| ∗Top 15 enriched GO BP terms are showed in the bar plot of each disease state in each tissue. Each row represents a significant GO biological process which is colored according to the -log10(p.adjust). |
| Page: 1 2 3 4 5 6 7 8 9 |
| GO ID | Tissue | Disease Stage | Description | Gene Ratio | Bg Ratio | pvalue | p.adjust | Count |
| GO:000989616 | Endometrium | AEH | positive regulation of catabolic process | 104/2100 | 492/18723 | 9.38e-11 | 1.10e-08 | 104 |
| GO:003133116 | Endometrium | AEH | positive regulation of cellular catabolic process | 91/2100 | 427/18723 | 9.15e-10 | 8.31e-08 | 91 |
| GO:003596616 | Endometrium | AEH | response to topologically incorrect protein | 39/2100 | 159/18723 | 1.69e-06 | 5.23e-05 | 39 |
| GO:000698616 | Endometrium | AEH | response to unfolded protein | 35/2100 | 137/18723 | 2.09e-06 | 6.28e-05 | 35 |
| GO:003462015 | Endometrium | AEH | cellular response to unfolded protein | 25/2100 | 96/18723 | 4.07e-05 | 6.97e-04 | 25 |
| GO:003596716 | Endometrium | AEH | cellular response to topologically incorrect protein | 28/2100 | 116/18723 | 6.38e-05 | 9.94e-04 | 28 |
| GO:00162368 | Endometrium | AEH | macroautophagy | 52/2100 | 291/18723 | 4.56e-04 | 4.80e-03 | 52 |
| GO:00619125 | Endometrium | AEH | selective autophagy | 17/2100 | 68/18723 | 1.10e-03 | 9.61e-03 | 17 |
| GO:00105068 | Endometrium | AEH | regulation of autophagy | 54/2100 | 317/18723 | 1.15e-03 | 9.97e-03 | 54 |
| GO:00105085 | Endometrium | AEH | positive regulation of autophagy | 26/2100 | 124/18723 | 1.17e-03 | 1.01e-02 | 26 |
| GO:000989617 | Endometrium | EEC | positive regulation of catabolic process | 108/2168 | 492/18723 | 2.55e-11 | 3.64e-09 | 108 |
| GO:003133117 | Endometrium | EEC | positive regulation of cellular catabolic process | 94/2168 | 427/18723 | 4.30e-10 | 4.45e-08 | 94 |
| GO:003596617 | Endometrium | EEC | response to topologically incorrect protein | 41/2168 | 159/18723 | 5.20e-07 | 2.00e-05 | 41 |
| GO:000698617 | Endometrium | EEC | response to unfolded protein | 37/2168 | 137/18723 | 5.40e-07 | 2.04e-05 | 37 |
| GO:003462016 | Endometrium | EEC | cellular response to unfolded protein | 26/2168 | 96/18723 | 2.38e-05 | 4.23e-04 | 26 |
| GO:003596717 | Endometrium | EEC | cellular response to topologically incorrect protein | 29/2168 | 116/18723 | 4.28e-05 | 7.09e-04 | 29 |
| GO:001623613 | Endometrium | EEC | macroautophagy | 53/2168 | 291/18723 | 5.40e-04 | 5.42e-03 | 53 |
| GO:001050613 | Endometrium | EEC | regulation of autophagy | 55/2168 | 317/18723 | 1.40e-03 | 1.14e-02 | 55 |
| GO:006191212 | Endometrium | EEC | selective autophagy | 17/2168 | 68/18723 | 1.56e-03 | 1.25e-02 | 17 |
| GO:001050813 | Endometrium | EEC | positive regulation of autophagy | 26/2168 | 124/18723 | 1.85e-03 | 1.43e-02 | 26 |
| Page: 1 2 3 4 5 6 |
| Pathway ID | Tissue | Disease Stage | Description | Gene Ratio | Bg Ratio | pvalue | p.adjust | qvalue | Count |
| Page: 1 |
Top |
Cell-cell communication analysis |
| Identification of potential cell-cell interactions between two cell types and their ligand-receptor pairs for different disease states |
| Ligand | Receptor | LRpair | Pathway | Tissue | Disease Stage |
| Page: 1 |
Top |
Single-cell gene regulatory network inference analysis |
| Find out the significant the regulons (TFs) and the target genes of each regulon across cell types for different disease states |
| TF | Cell Type | Tissue | Disease Stage | Target Gene | RSS | Regulon Activity |
| ∗The dot plots of a searched regulon are shown for all cell subpopulations in each disease state of each tissue based on the regulon specific score inferred using pySCENIC and by calculating the average expression. |
| Page: 1 |
Top |
Somatic mutation of malignant transformation related genes |
| Annotation of somatic variants for genes involved in malignant transformation |
| Hugo Symbol | Variant Class | Variant Classification | dbSNP RS | HGVSc | HGVSp | HGVSp Short | SWISSPROT | BIOTYPE | SIFT | PolyPhen | Tumor Sample Barcode | Tissue | Histology | Sex | Age | Stage | Therapy Types | Drugs | Outcome |
| HSPB8 | SNV | Missense_Mutation | novel | c.330N>C | p.Leu110Phe | p.L110F | Q9UJY1 | protein_coding | deleterious(0.04) | benign(0.376) | TCGA-AC-A5XS-01 | Breast | breast invasive carcinoma | Female | >=65 | I/II | Hormone Therapy | femara | SD |
| HSPB8 | SNV | Missense_Mutation | rs757293016 | c.250N>A | p.Glu84Lys | p.E84K | Q9UJY1 | protein_coding | tolerated(0.84) | benign(0.017) | TCGA-BI-A0VS-01 | Cervix | cervical & endocervical cancer | Female | <65 | I/II | Unknown | Unknown | SD |
| HSPB8 | SNV | Missense_Mutation | c.86N>A | p.Arg29His | p.R29H | Q9UJY1 | protein_coding | deleterious(0.04) | possibly_damaging(0.541) | TCGA-AG-3727-01 | Colorectum | rectum adenocarcinoma | Female | >=65 | III/IV | Unknown | Unknown | SD | |
| HSPB8 | SNV | Missense_Mutation | c.374N>T | p.His125Leu | p.H125L | Q9UJY1 | protein_coding | deleterious(0) | probably_damaging(0.95) | TCGA-EI-6513-01 | Colorectum | rectum adenocarcinoma | Male | <65 | III/IV | Unknown | Unknown | SD | |
| HSPB8 | SNV | Missense_Mutation | c.485N>A | p.Gly162Asp | p.G162D | Q9UJY1 | protein_coding | deleterious(0) | probably_damaging(1) | TCGA-EI-6882-01 | Colorectum | rectum adenocarcinoma | Male | <65 | I/II | Unknown | Unknown | SD | |
| HSPB8 | insertion | Frame_Shift_Ins | rs773017653 | c.259_260insC | p.Pro90ThrfsTer37 | p.P90Tfs*37 | Q9UJY1 | protein_coding | TCGA-A6-5665-01 | Colorectum | colon adenocarcinoma | Female | >=65 | I/II | Unknown | Unknown | PD | ||
| HSPB8 | insertion | Frame_Shift_Ins | rs773017653 | c.259_260insC | p.Pro90ThrfsTer37 | p.P90Tfs*37 | Q9UJY1 | protein_coding | TCGA-AA-3833-01 | Colorectum | colon adenocarcinoma | Female | <65 | I/II | Unknown | Unknown | SD | ||
| HSPB8 | insertion | Frame_Shift_Ins | rs773017653 | c.266dupC | p.Pro90ThrfsTer37 | p.P90Tfs*37 | Q9UJY1 | protein_coding | TCGA-AA-3947-01 | Colorectum | colon adenocarcinoma | Female | <65 | I/II | Unknown | Unknown | SD | ||
| HSPB8 | SNV | Missense_Mutation | novel | c.452C>T | p.Pro151Leu | p.P151L | Q9UJY1 | protein_coding | tolerated(0.28) | probably_damaging(0.976) | TCGA-A5-A1OF-01 | Endometrium | uterine corpus endometrioid carcinoma | Female | <65 | I/II | Unknown | Unknown | SD |
| HSPB8 | SNV | Missense_Mutation | c.215G>T | p.Gly72Val | p.G72V | Q9UJY1 | protein_coding | tolerated(0.57) | benign(0) | TCGA-AX-A1C4-01 | Endometrium | uterine corpus endometrioid carcinoma | Female | <65 | I/II | Unknown | Unknown | SD |
| Page: 1 2 3 4 |
Top |
Related drugs of malignant transformation related genes |
| Identification of chemicals and drugs interact with genes involved in malignant transfromation |
| (DGIdb 4.0) |
| Entrez ID | Symbol | Category | Interaction Types | Drug Claim Name | Drug Name | PMIDs |
| Page: 1 |

Copyright 2023-Present -The University of Texas Health Science Center at Houston |