
|
|||||
|
 | |
| |
| |
| |
| |
| |
|
Gene: HSPB6 |
Gene summary for HSPB6 |
| Gene information | Species | Human | Gene symbol | HSPB6 | Gene ID | 126393 |
| Gene name | heat shock protein family B (small) member 6 | |
| Gene Alias | HEL55 | |
| Cytomap | 19q13.12 | |
| Gene Type | protein-coding | GO ID | GO:0001525 | UniProtAcc | O14558 |
Top |
Malignant transformation analysis |
| Identification of the aberrant gene expression in precancerous and cancerous lesions by comparing the gene expression of stem-like cells in diseased tissues with normal stem cells |
| Entrez ID | Symbol | Replicates | Species | Organ | Tissue | Adj P-value | Log2FC | Malignancy |
| 126393 | HSPB6 | P9T-E | Human | Esophagus | ESCC | 1.05e-03 | 1.09e+00 | 0.1131 |
| 126393 | HSPB6 | P75T-E | Human | Esophagus | ESCC | 2.04e-06 | 1.50e-01 | 0.1125 |
| 126393 | HSPB6 | P79T-E | Human | Esophagus | ESCC | 1.64e-14 | 5.21e-01 | 0.1154 |
| 126393 | HSPB6 | P128T-E | Human | Esophagus | ESCC | 1.73e-02 | 9.23e-02 | 0.1241 |
| 126393 | HSPB6 | cirrhotic3 | Human | Liver | Cirrhotic | 2.51e-06 | 3.47e-01 | 0.0215 |
| 126393 | HSPB6 | S014 | Human | Liver | HCC | 3.43e-10 | 6.42e-01 | 0.2254 |
| 126393 | HSPB6 | S015 | Human | Liver | HCC | 2.66e-11 | 6.61e-01 | 0.2375 |
| 126393 | HSPB6 | S016 | Human | Liver | HCC | 6.26e-10 | 5.92e-01 | 0.2243 |
| 126393 | HSPB6 | ATC13 | Human | Thyroid | ATC | 3.31e-66 | 1.92e+00 | 0.34 |
| 126393 | HSPB6 | ATC5 | Human | Thyroid | ATC | 1.70e-83 | 2.10e+00 | 0.34 |
| Page: 1 |
| Tissue | Expression Dynamics | Abbreviation |
| Esophagus | 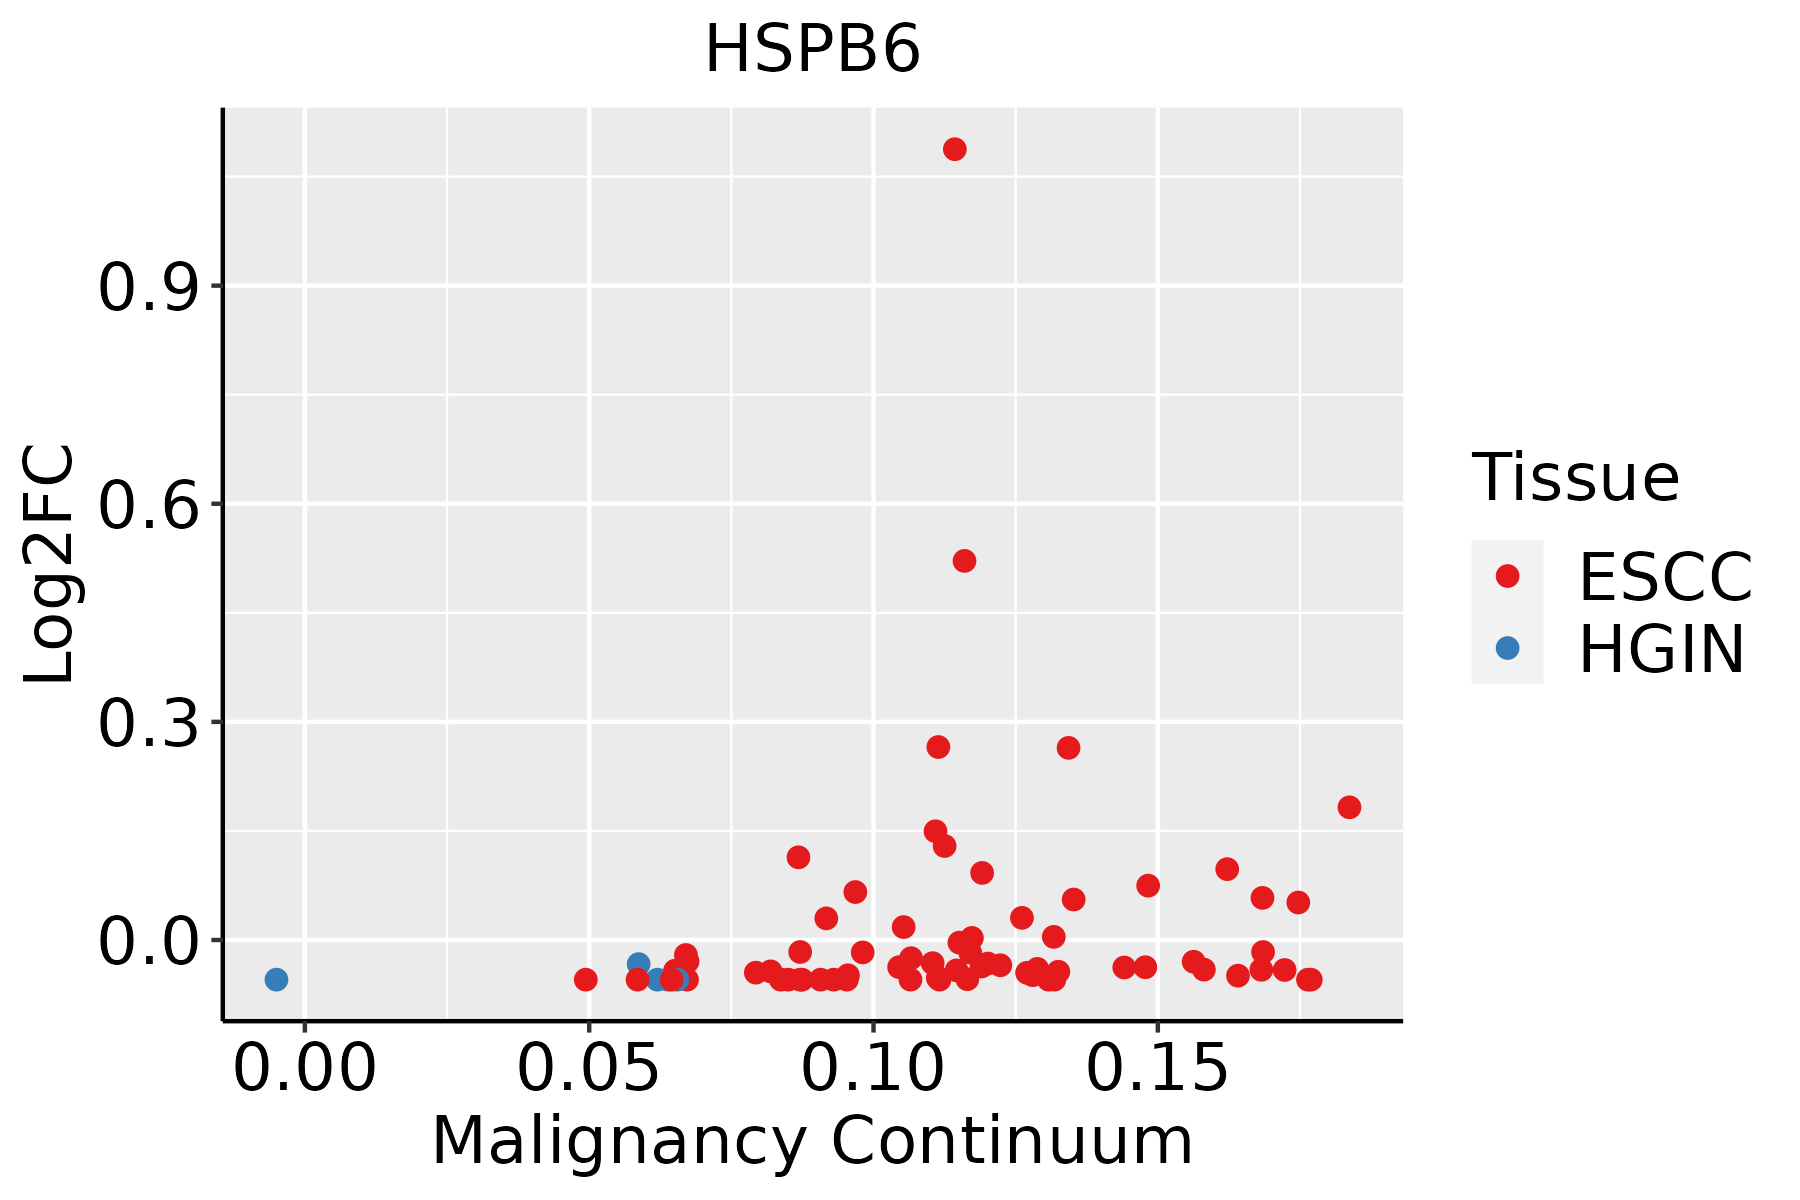 | ESCC: Esophageal squamous cell carcinoma |
| HGIN: High-grade intraepithelial neoplasias | ||
| LGIN: Low-grade intraepithelial neoplasias | ||
| Liver |  | HCC: Hepatocellular carcinoma |
| NAFLD: Non-alcoholic fatty liver disease | ||
| Thyroid | 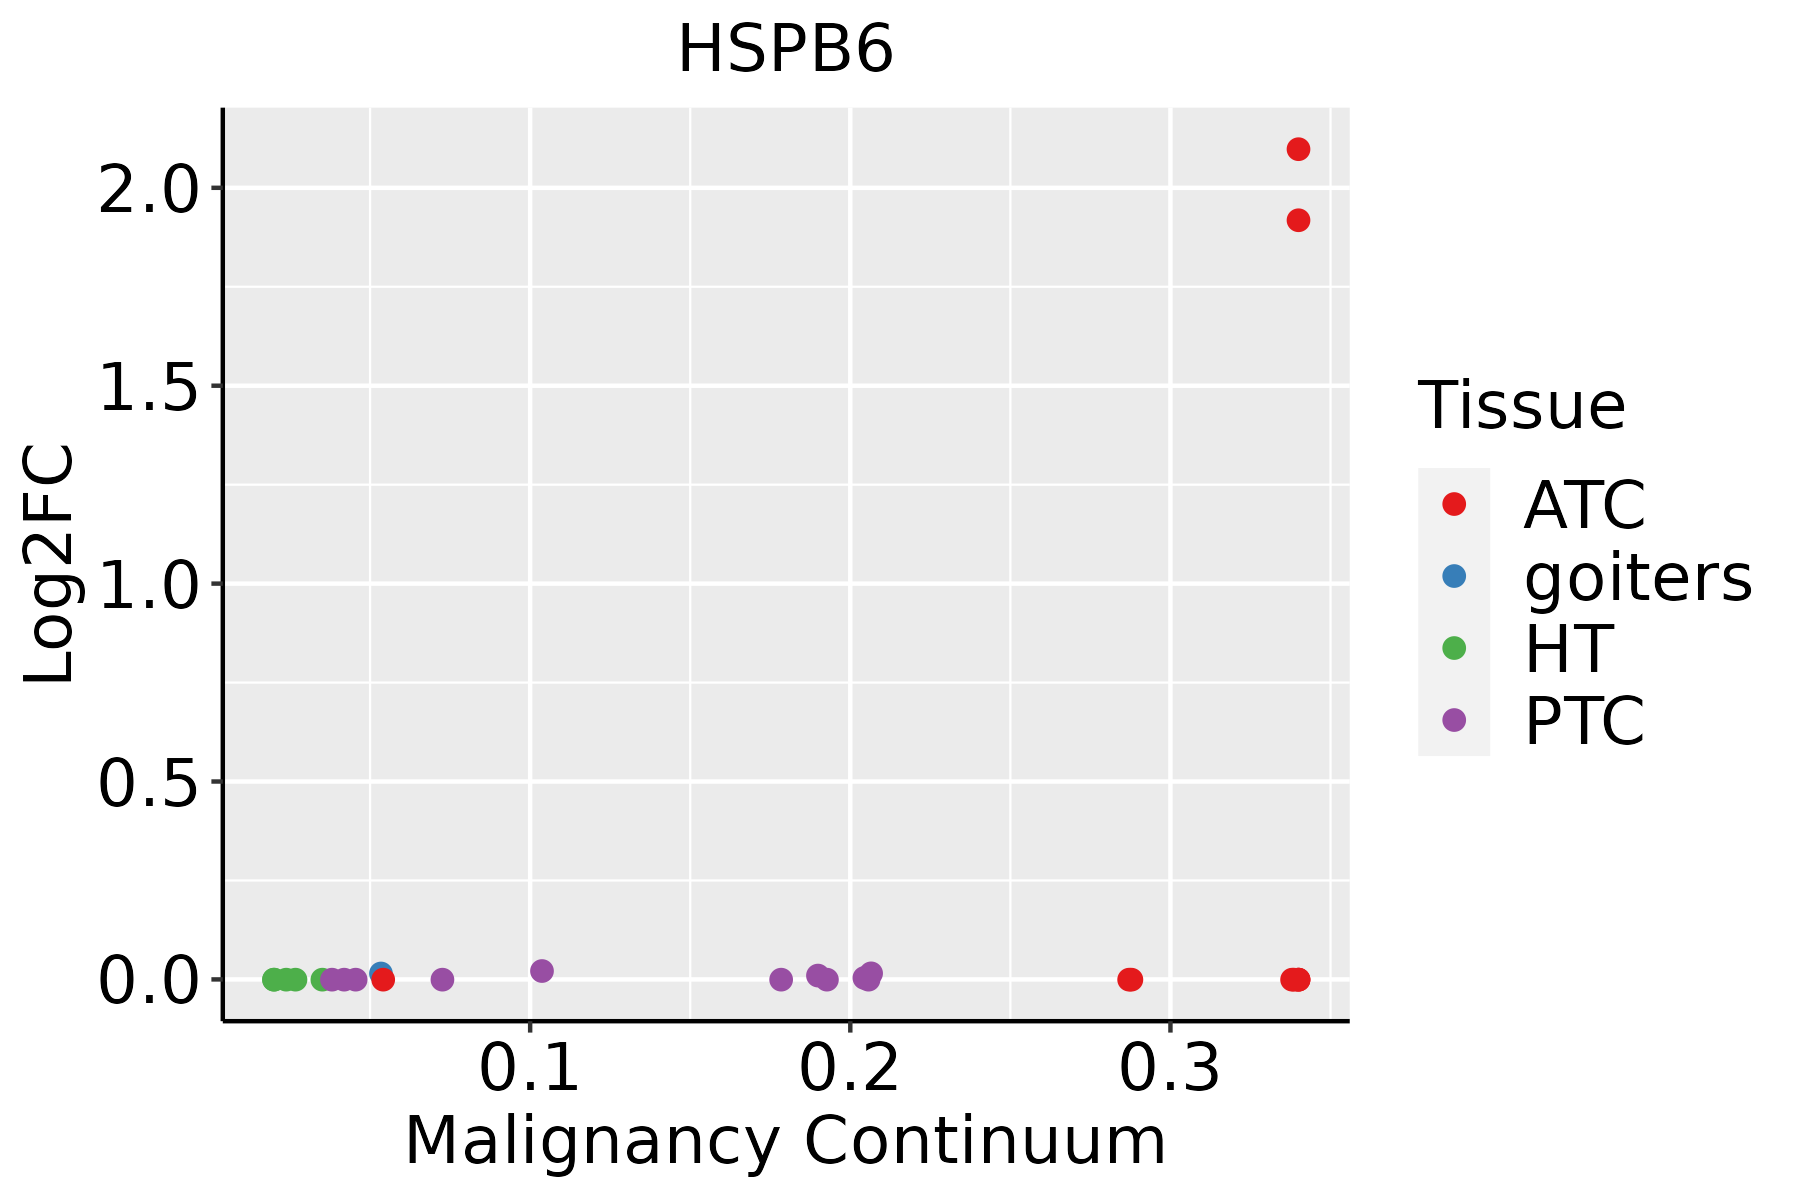 | ATC: Anaplastic thyroid cancer |
| HT: Hashimoto's thyroiditis | ||
| PTC: Papillary thyroid cancer |
| ∗log2FC in expression of this searched gene in stem-like cells from each diseased tissue sample relative to stem-like cells in normal samples in each tissue plotted against the malignancy continuum. Samples are colored based on if they are from different disease stage. |
Top |
Malignant transformation related pathway analysis |
| Find out the enriched GO biological processes and KEGG pathways involved in transition from healthy to precancer to cancer |
| Tissue | Disease Stage | Enriched GO biological Processes |
| Colorectum | AD |  |
| Colorectum | SER |  |
| Colorectum | MSS |  |
| Colorectum | MSI-H |  |
| Colorectum | FAP |  |
| ∗Top 15 enriched GO BP terms are showed in the bar plot of each disease state in each tissue. Each row represents a significant GO biological process which is colored according to the -log10(p.adjust). |
| Page: 1 2 3 4 5 6 7 8 9 |
| GO ID | Tissue | Disease Stage | Description | Gene Ratio | Bg Ratio | pvalue | p.adjust | Count |
| GO:0006457110 | Esophagus | ESCC | protein folding | 163/8552 | 212/18723 | 1.13e-20 | 1.74e-18 | 163 |
| GO:0061077110 | Esophagus | ESCC | chaperone-mediated protein folding | 56/8552 | 67/18723 | 1.52e-10 | 4.36e-09 | 56 |
| GO:00064577 | Liver | Cirrhotic | protein folding | 114/4634 | 212/18723 | 9.23e-20 | 2.31e-17 | 114 |
| GO:00610777 | Liver | Cirrhotic | chaperone-mediated protein folding | 40/4634 | 67/18723 | 1.24e-09 | 5.43e-08 | 40 |
| GO:000645712 | Liver | HCC | protein folding | 160/7958 | 212/18723 | 1.07e-22 | 1.88e-20 | 160 |
| GO:006107712 | Liver | HCC | chaperone-mediated protein folding | 56/7958 | 67/18723 | 4.86e-12 | 2.14e-10 | 56 |
| GO:000645733 | Thyroid | ATC | protein folding | 140/6293 | 212/18723 | 3.46e-22 | 8.09e-20 | 140 |
| GO:006107733 | Thyroid | ATC | chaperone-mediated protein folding | 47/6293 | 67/18723 | 1.05e-09 | 2.67e-08 | 47 |
| GO:004576621 | Thyroid | ATC | positive regulation of angiogenesis | 82/6293 | 181/18723 | 6.79e-04 | 3.83e-03 | 82 |
| GO:190401821 | Thyroid | ATC | positive regulation of vasculature development | 82/6293 | 181/18723 | 6.79e-04 | 3.83e-03 | 82 |
| GO:00457657 | Thyroid | ATC | regulation of angiogenesis | 141/6293 | 342/18723 | 1.80e-03 | 8.85e-03 | 141 |
| GO:19013427 | Thyroid | ATC | regulation of vasculature development | 143/6293 | 348/18723 | 1.95e-03 | 9.44e-03 | 143 |
| Page: 1 |
| Pathway ID | Tissue | Disease Stage | Description | Gene Ratio | Bg Ratio | pvalue | p.adjust | qvalue | Count |
| Page: 1 |
Top |
Cell-cell communication analysis |
| Identification of potential cell-cell interactions between two cell types and their ligand-receptor pairs for different disease states |
| Ligand | Receptor | LRpair | Pathway | Tissue | Disease Stage |
| Page: 1 |
Top |
Single-cell gene regulatory network inference analysis |
| Find out the significant the regulons (TFs) and the target genes of each regulon across cell types for different disease states |
| TF | Cell Type | Tissue | Disease Stage | Target Gene | RSS | Regulon Activity |
| ∗The dot plots of a searched regulon are shown for all cell subpopulations in each disease state of each tissue based on the regulon specific score inferred using pySCENIC and by calculating the average expression. |
| Page: 1 |
Top |
Somatic mutation of malignant transformation related genes |
| Annotation of somatic variants for genes involved in malignant transformation |
| Hugo Symbol | Variant Class | Variant Classification | dbSNP RS | HGVSc | HGVSp | HGVSp Short | SWISSPROT | BIOTYPE | SIFT | PolyPhen | Tumor Sample Barcode | Tissue | Histology | Sex | Age | Stage | Therapy Types | Drugs | Outcome |
| HSPB6 | deletion | Frame_Shift_Del | novel | c.248delN | p.Phe83SerfsTer50 | p.F83Sfs*50 | O14558 | protein_coding | TCGA-EW-A2FV-01 | Breast | breast invasive carcinoma | Female | <65 | III/IV | Chemotherapy | docetaxel | SD | ||
| HSPB6 | SNV | Missense_Mutation | novel | c.311N>C | p.Glu104Ala | p.E104A | O14558 | protein_coding | tolerated(0.09) | probably_damaging(0.926) | TCGA-5M-AATA-01 | Colorectum | colon adenocarcinoma | Unknown | Unknown | I/II | Unknown | Unknown | Unknown |
| HSPB6 | SNV | Missense_Mutation | novel | c.238G>A | p.Val80Met | p.V80M | O14558 | protein_coding | deleterious(0.02) | probably_damaging(0.999) | TCGA-CD-A4MJ-01 | Stomach | stomach adenocarcinoma | Male | <65 | I/II | Chemotherapy | cisplatin | CR |
| Page: 1 |
Top |
Related drugs of malignant transformation related genes |
| Identification of chemicals and drugs interact with genes involved in malignant transfromation |
| (DGIdb 4.0) |
| Entrez ID | Symbol | Category | Interaction Types | Drug Claim Name | Drug Name | PMIDs |
| 126393 | HSPB6 | NA | AZX-100 | AZX-100 |
| Page: 1 |

Copyright 2023-Present -The University of Texas Health Science Center at Houston |