
|
|||||
|
 | |
| |
| |
| |
| |
| |
|
Gene: HSPB3 |
Gene summary for HSPB3 |
| Gene information | Species | Human | Gene symbol | HSPB3 | Gene ID | 8988 |
| Gene name | heat shock protein family B (small) member 3 | |
| Gene Alias | DHMN2C | |
| Cytomap | 5q11.2 | |
| Gene Type | protein-coding | GO ID | GO:0006950 | UniProtAcc | Q12988 |
Top |
Malignant transformation analysis |
| Identification of the aberrant gene expression in precancerous and cancerous lesions by comparing the gene expression of stem-like cells in diseased tissues with normal stem cells |
| Entrez ID | Symbol | Replicates | Species | Organ | Tissue | Adj P-value | Log2FC | Malignancy |
| 8988 | HSPB3 | P5T-E | Human | Esophagus | ESCC | 3.75e-03 | 2.61e-01 | 0.1327 |
| 8988 | HSPB3 | P10T-E | Human | Esophagus | ESCC | 9.53e-09 | 2.42e-01 | 0.116 |
| 8988 | HSPB3 | P11T-E | Human | Esophagus | ESCC | 9.07e-04 | 3.36e-01 | 0.1426 |
| 8988 | HSPB3 | P22T-E | Human | Esophagus | ESCC | 1.59e-30 | 7.68e-01 | 0.1236 |
| 8988 | HSPB3 | P32T-E | Human | Esophagus | ESCC | 2.05e-07 | 2.22e-01 | 0.1666 |
| 8988 | HSPB3 | P74T-E | Human | Esophagus | ESCC | 2.66e-02 | 1.50e-01 | 0.1479 |
| 8988 | HSPB3 | P79T-E | Human | Esophagus | ESCC | 1.88e-11 | 4.04e-01 | 0.1154 |
| 8988 | HSPB3 | P107T-E | Human | Esophagus | ESCC | 1.00e-23 | 7.17e-01 | 0.171 |
| 8988 | HSPB3 | P130T-E | Human | Esophagus | ESCC | 8.96e-45 | 1.34e+00 | 0.1676 |
| 8988 | HSPB3 | C30 | Human | Oral cavity | OSCC | 8.54e-25 | 1.76e+00 | 0.3055 |
| 8988 | HSPB3 | C38 | Human | Oral cavity | OSCC | 1.12e-03 | 9.04e-01 | 0.172 |
| 8988 | HSPB3 | C51 | Human | Oral cavity | OSCC | 1.05e-02 | 1.77e-01 | 0.2674 |
| 8988 | HSPB3 | SYSMH1 | Human | Oral cavity | OSCC | 1.12e-06 | 2.83e-01 | 0.1127 |
| 8988 | HSPB3 | SYSMH2 | Human | Oral cavity | OSCC | 3.20e-03 | 2.60e-01 | 0.2326 |
| 8988 | HSPB3 | SYSMH5 | Human | Oral cavity | OSCC | 1.59e-04 | 7.50e-01 | 0.0647 |
| Page: 1 |
| Tissue | Expression Dynamics | Abbreviation |
| Esophagus |  | ESCC: Esophageal squamous cell carcinoma |
| HGIN: High-grade intraepithelial neoplasias | ||
| LGIN: Low-grade intraepithelial neoplasias | ||
| Oral Cavity | 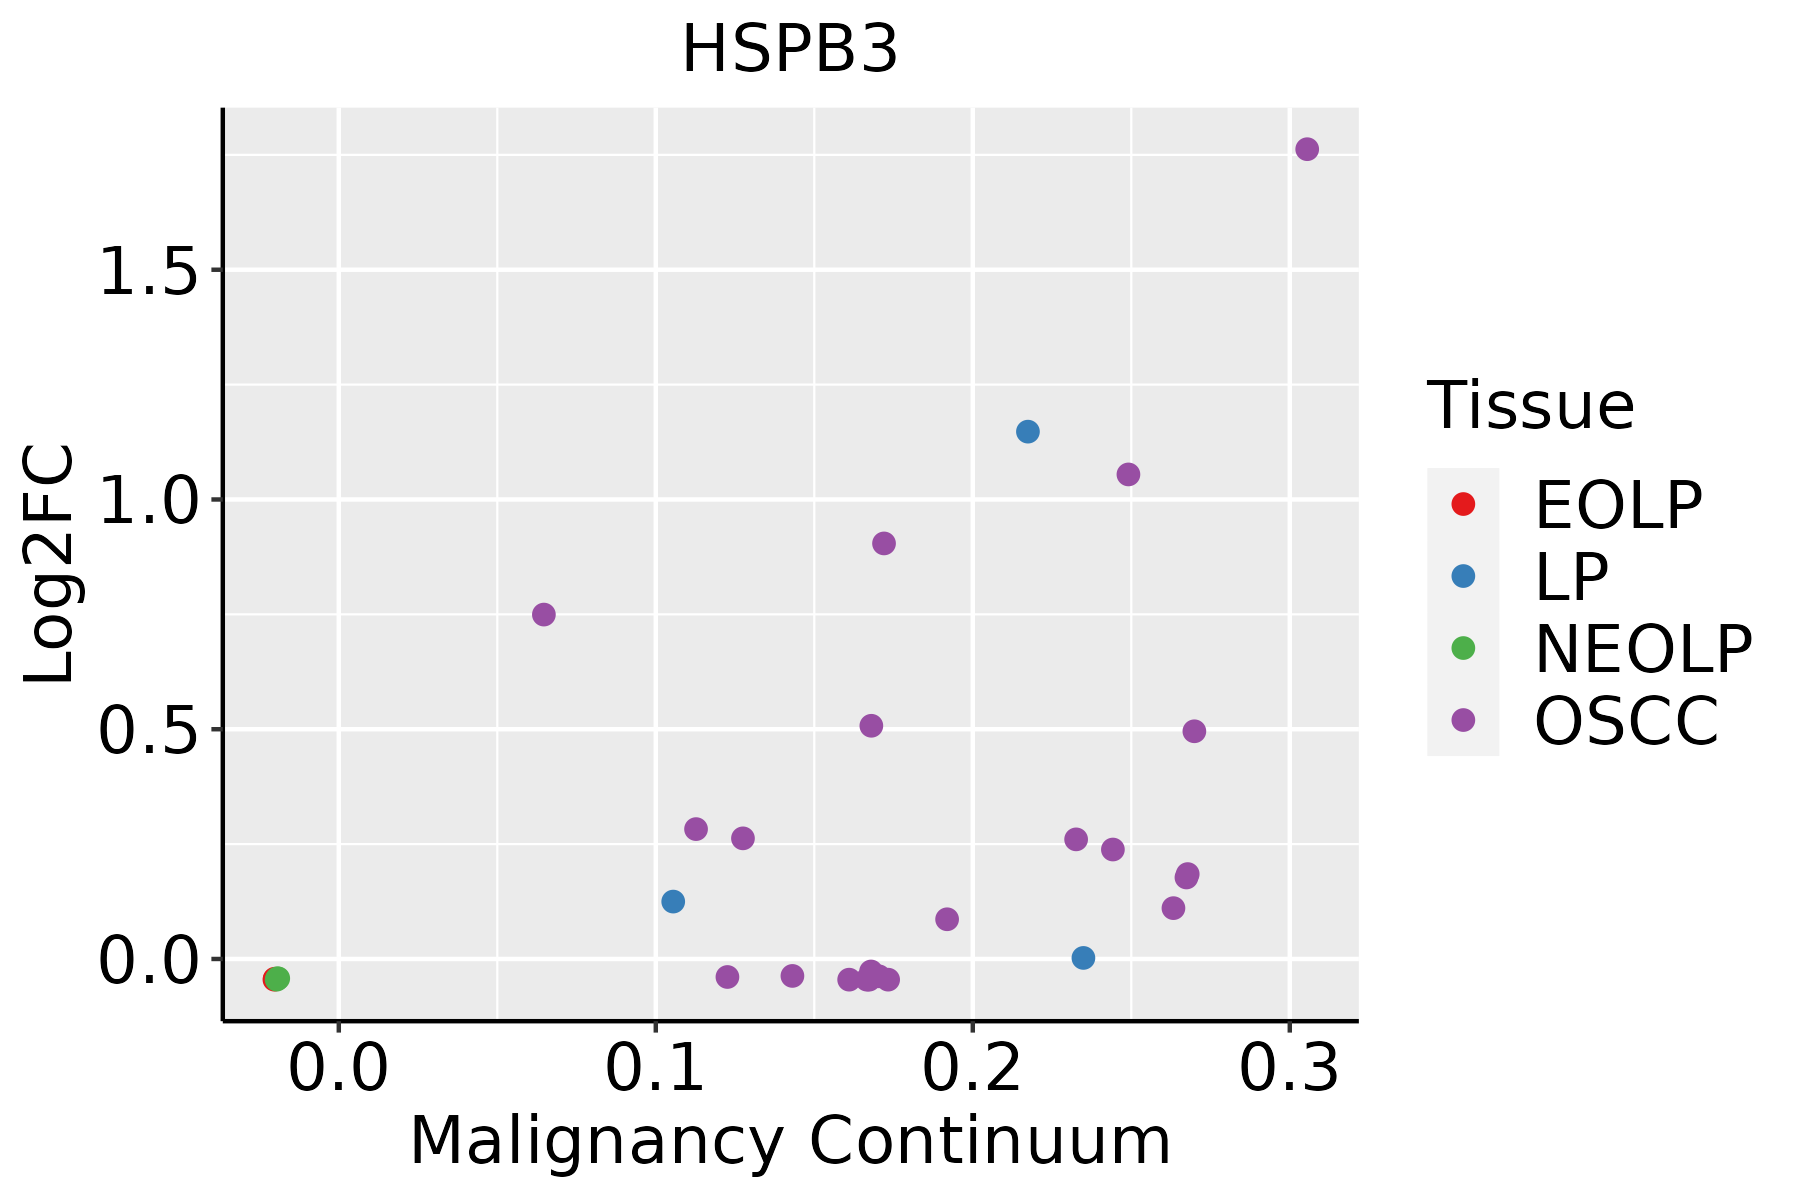 | EOLP: Erosive Oral lichen planus |
| LP: leukoplakia | ||
| NEOLP: Non-erosive oral lichen planus | ||
| OSCC: Oral squamous cell carcinoma |
| ∗log2FC in expression of this searched gene in stem-like cells from each diseased tissue sample relative to stem-like cells in normal samples in each tissue plotted against the malignancy continuum. Samples are colored based on if they are from different disease stage. |
Top |
Malignant transformation related pathway analysis |
| Find out the enriched GO biological processes and KEGG pathways involved in transition from healthy to precancer to cancer |
| Tissue | Disease Stage | Enriched GO biological Processes |
| Colorectum | AD |  |
| Colorectum | SER |  |
| Colorectum | MSS |  |
| Colorectum | MSI-H |  |
| Colorectum | FAP |  |
| ∗Top 15 enriched GO BP terms are showed in the bar plot of each disease state in each tissue. Each row represents a significant GO biological process which is colored according to the -log10(p.adjust). |
| Page: 1 2 3 4 5 6 7 8 9 |
| GO ID | Tissue | Disease Stage | Description | Gene Ratio | Bg Ratio | pvalue | p.adjust | Count |
| GO:0035966111 | Esophagus | ESCC | response to topologically incorrect protein | 125/8552 | 159/18723 | 1.44e-17 | 1.27e-15 | 125 |
| GO:0006986111 | Esophagus | ESCC | response to unfolded protein | 107/8552 | 137/18723 | 7.01e-15 | 3.87e-13 | 107 |
| GO:003596620 | Oral cavity | OSCC | response to topologically incorrect protein | 117/7305 | 159/18723 | 6.93e-19 | 8.60e-17 | 117 |
| GO:000698620 | Oral cavity | OSCC | response to unfolded protein | 103/7305 | 137/18723 | 6.47e-18 | 6.50e-16 | 103 |
| Page: 1 |
| Pathway ID | Tissue | Disease Stage | Description | Gene Ratio | Bg Ratio | pvalue | p.adjust | qvalue | Count |
| Page: 1 |
Top |
Cell-cell communication analysis |
| Identification of potential cell-cell interactions between two cell types and their ligand-receptor pairs for different disease states |
| Ligand | Receptor | LRpair | Pathway | Tissue | Disease Stage |
| Page: 1 |
Top |
Single-cell gene regulatory network inference analysis |
| Find out the significant the regulons (TFs) and the target genes of each regulon across cell types for different disease states |
| TF | Cell Type | Tissue | Disease Stage | Target Gene | RSS | Regulon Activity |
| ∗The dot plots of a searched regulon are shown for all cell subpopulations in each disease state of each tissue based on the regulon specific score inferred using pySCENIC and by calculating the average expression. |
| Page: 1 |
Top |
Somatic mutation of malignant transformation related genes |
| Annotation of somatic variants for genes involved in malignant transformation |
| Hugo Symbol | Variant Class | Variant Classification | dbSNP RS | HGVSc | HGVSp | HGVSp Short | SWISSPROT | BIOTYPE | SIFT | PolyPhen | Tumor Sample Barcode | Tissue | Histology | Sex | Age | Stage | Therapy Types | Drugs | Outcome |
| HSPB3 | SNV | Missense_Mutation | novel | c.58T>A | p.Phe20Ile | p.F20I | Q12988 | protein_coding | tolerated(0.09) | possibly_damaging(0.802) | TCGA-A2-A0EQ-01 | Breast | breast invasive carcinoma | Female | <65 | I/II | Chemotherapy | adriamycin | SD |
| HSPB3 | SNV | Missense_Mutation | c.5N>T | p.Ala2Val | p.A2V | Q12988 | protein_coding | deleterious_low_confidence(0.03) | benign(0.261) | TCGA-B6-A0IJ-01 | Breast | breast invasive carcinoma | Female | <65 | I/II | Unknown | Unknown | SD | |
| HSPB3 | SNV | Missense_Mutation | novel | c.364G>A | p.Asp122Asn | p.D122N | Q12988 | protein_coding | tolerated(0.38) | benign(0.292) | TCGA-C8-A8HP-01 | Breast | breast invasive carcinoma | Female | <65 | III/IV | Chemotherapy | 5-fluorouracil | CR |
| HSPB3 | SNV | Missense_Mutation | c.112N>T | p.Pro38Ser | p.P38S | Q12988 | protein_coding | deleterious(0) | probably_damaging(0.999) | TCGA-E2-A14W-01 | Breast | breast invasive carcinoma | Male | >=65 | I/II | Chemotherapy | cytoxan | SD | |
| HSPB3 | insertion | In_Frame_Ins | novel | c.56_57insCCGCACCTGGCCTCACCCAGATATTTTTCAAATACCATTTTC | p.Glu19delinsAspArgThrTrpProHisProAspIlePheGlnIleProPheSer | p.E19delinsDRTWPHPDIFQIPFS | Q12988 | protein_coding | TCGA-A2-A0EQ-01 | Breast | breast invasive carcinoma | Female | <65 | I/II | Chemotherapy | adriamycin | SD | ||
| HSPB3 | insertion | In_Frame_Ins | novel | c.304_305insTGCTCT | p.Thr102delinsMetLeuSer | p.T102delinsMLS | Q12988 | protein_coding | TCGA-AR-A0U0-01 | Breast | breast invasive carcinoma | Female | >=65 | I/II | Unknown | Unknown | SD | ||
| HSPB3 | SNV | Missense_Mutation | novel | c.232N>A | p.Val78Ile | p.V78I | Q12988 | protein_coding | tolerated(0.11) | probably_damaging(0.936) | TCGA-EA-A3HU-01 | Cervix | cervical & endocervical cancer | Female | <65 | I/II | Unknown | Unknown | SD |
| HSPB3 | SNV | Missense_Mutation | rs371683736 | c.194N>A | p.Arg65Gln | p.R65Q | Q12988 | protein_coding | tolerated(0.47) | benign(0) | TCGA-AA-A010-01 | Colorectum | colon adenocarcinoma | Female | <65 | I/II | Chemotherapy | folinic | CR |
| HSPB3 | SNV | Missense_Mutation | c.432N>T | p.Lys144Asn | p.K144N | Q12988 | protein_coding | tolerated(0.08) | probably_damaging(0.999) | TCGA-QG-A5Z2-01 | Colorectum | colon adenocarcinoma | Male | <65 | I/II | Unknown | Unknown | SD | |
| HSPB3 | SNV | Missense_Mutation | novel | c.8N>C | p.Lys3Thr | p.K3T | Q12988 | protein_coding | tolerated_low_confidence(0.09) | benign(0.081) | TCGA-F5-6814-01 | Colorectum | rectum adenocarcinoma | Male | <65 | I/II | Unknown | Unknown | SD |
| Page: 1 2 3 |
Top |
Related drugs of malignant transformation related genes |
| Identification of chemicals and drugs interact with genes involved in malignant transfromation |
| (DGIdb 4.0) |
| Entrez ID | Symbol | Category | Interaction Types | Drug Claim Name | Drug Name | PMIDs |
| Page: 1 |

Copyright 2023-Present -The University of Texas Health Science Center at Houston |