
|
|||||
|
 | |
| |
| |
| |
| |
| |
|
Gene: HSPB2 |
Gene summary for HSPB2 |
| Gene information | Species | Human | Gene symbol | HSPB2 | Gene ID | 3316 |
| Gene name | heat shock protein family B (small) member 2 | |
| Gene Alias | HSP27 | |
| Cytomap | 11q23.1 | |
| Gene Type | protein-coding | GO ID | GO:0006950 | UniProtAcc | A8KAH6 |
Top |
Malignant transformation analysis |
| Identification of the aberrant gene expression in precancerous and cancerous lesions by comparing the gene expression of stem-like cells in diseased tissues with normal stem cells |
| Entrez ID | Symbol | Replicates | Species | Organ | Tissue | Adj P-value | Log2FC | Malignancy |
| 3316 | HSPB2 | C43 | Human | Oral cavity | OSCC | 3.50e-02 | -1.43e-01 | 0.1704 |
| 3316 | HSPB2 | C09 | Human | Oral cavity | OSCC | 8.01e-07 | 5.09e-01 | 0.1431 |
| 3316 | HSPB2 | NEOLP-2 | Human | Oral cavity | NEOLP | 2.29e-02 | 8.20e-02 | -0.0196 |
| Page: 1 |
| Tissue | Expression Dynamics | Abbreviation |
| Oral Cavity | 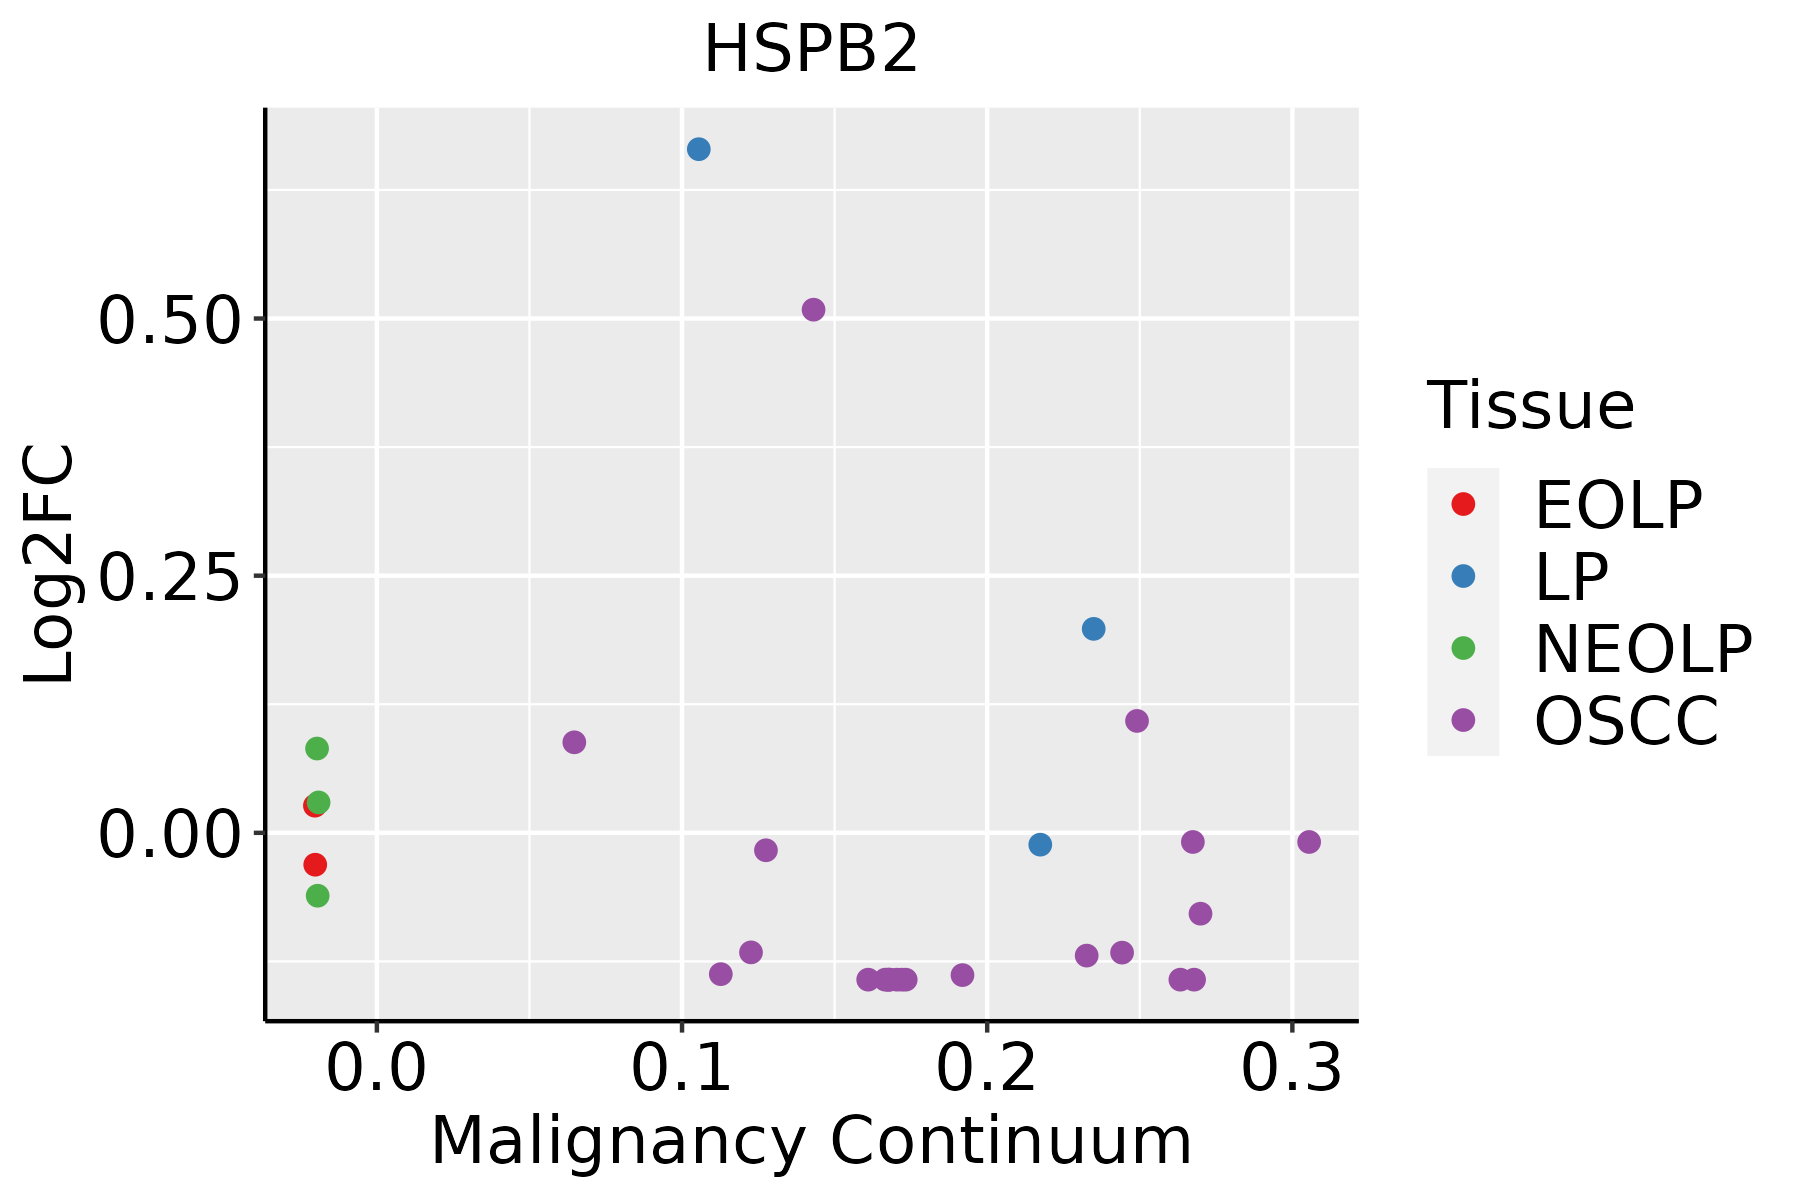 | EOLP: Erosive Oral lichen planus |
| LP: leukoplakia | ||
| NEOLP: Non-erosive oral lichen planus | ||
| OSCC: Oral squamous cell carcinoma |
| ∗log2FC in expression of this searched gene in stem-like cells from each diseased tissue sample relative to stem-like cells in normal samples in each tissue plotted against the malignancy continuum. Samples are colored based on if they are from different disease stage. |
Top |
Malignant transformation related pathway analysis |
| Find out the enriched GO biological processes and KEGG pathways involved in transition from healthy to precancer to cancer |
| Tissue | Disease Stage | Enriched GO biological Processes |
| Colorectum | AD |  |
| Colorectum | SER |  |
| Colorectum | MSS |  |
| Colorectum | MSI-H |  |
| Colorectum | FAP |  |
| ∗Top 15 enriched GO BP terms are showed in the bar plot of each disease state in each tissue. Each row represents a significant GO biological process which is colored according to the -log10(p.adjust). |
| Page: 1 2 3 4 5 6 7 8 9 |
| GO ID | Tissue | Disease Stage | Description | Gene Ratio | Bg Ratio | pvalue | p.adjust | Count |
| GO:003596620 | Oral cavity | OSCC | response to topologically incorrect protein | 117/7305 | 159/18723 | 6.93e-19 | 8.60e-17 | 117 |
| GO:000698620 | Oral cavity | OSCC | response to unfolded protein | 103/7305 | 137/18723 | 6.47e-18 | 6.50e-16 | 103 |
| GO:003596632 | Oral cavity | NEOLP | response to topologically incorrect protein | 38/2005 | 159/18723 | 1.46e-06 | 3.68e-05 | 38 |
| GO:000698632 | Oral cavity | NEOLP | response to unfolded protein | 34/2005 | 137/18723 | 2.08e-06 | 4.87e-05 | 34 |
| Page: 1 |
| Pathway ID | Tissue | Disease Stage | Description | Gene Ratio | Bg Ratio | pvalue | p.adjust | qvalue | Count |
| hsa0520526 | Oral cavity | OSCC | Proteoglycans in cancer | 128/3704 | 205/8465 | 4.00e-08 | 3.12e-07 | 1.59e-07 | 128 |
| hsa05205111 | Oral cavity | OSCC | Proteoglycans in cancer | 128/3704 | 205/8465 | 4.00e-08 | 3.12e-07 | 1.59e-07 | 128 |
| hsa0520562 | Oral cavity | NEOLP | Proteoglycans in cancer | 56/1112 | 205/8465 | 3.49e-08 | 5.85e-07 | 3.68e-07 | 56 |
| hsa0520572 | Oral cavity | NEOLP | Proteoglycans in cancer | 56/1112 | 205/8465 | 3.49e-08 | 5.85e-07 | 3.68e-07 | 56 |
| Page: 1 |
Top |
Cell-cell communication analysis |
| Identification of potential cell-cell interactions between two cell types and their ligand-receptor pairs for different disease states |
| Ligand | Receptor | LRpair | Pathway | Tissue | Disease Stage |
| Page: 1 |
Top |
Single-cell gene regulatory network inference analysis |
| Find out the significant the regulons (TFs) and the target genes of each regulon across cell types for different disease states |
| TF | Cell Type | Tissue | Disease Stage | Target Gene | RSS | Regulon Activity |
| ∗The dot plots of a searched regulon are shown for all cell subpopulations in each disease state of each tissue based on the regulon specific score inferred using pySCENIC and by calculating the average expression. |
| Page: 1 |
Top |
Somatic mutation of malignant transformation related genes |
| Annotation of somatic variants for genes involved in malignant transformation |
| Hugo Symbol | Variant Class | Variant Classification | dbSNP RS | HGVSc | HGVSp | HGVSp Short | SWISSPROT | BIOTYPE | SIFT | PolyPhen | Tumor Sample Barcode | Tissue | Histology | Sex | Age | Stage | Therapy Types | Drugs | Outcome |
| HSPB2 | SNV | Missense_Mutation | c.449G>A | p.Gly150Asp | p.G150D | Q16082 | protein_coding | tolerated(0.16) | probably_damaging(0.966) | TCGA-AA-3833-01 | Colorectum | colon adenocarcinoma | Female | <65 | I/II | Unknown | Unknown | SD | |
| HSPB2 | SNV | Missense_Mutation | novel | c.67N>T | p.Arg23Cys | p.R23C | Q16082 | protein_coding | deleterious(0) | possibly_damaging(0.586) | TCGA-D5-6535-01 | Colorectum | colon adenocarcinoma | Female | >=65 | III/IV | Unknown | Unknown | SD |
| HSPB2 | SNV | Missense_Mutation | c.196N>A | p.Glu66Lys | p.E66K | Q16082 | protein_coding | tolerated(0.42) | possibly_damaging(0.541) | TCGA-AG-A002-01 | Colorectum | rectum adenocarcinoma | Male | <65 | I/II | Unknown | Unknown | SD | |
| HSPB2 | SNV | Missense_Mutation | novel | c.184N>A | p.Ala62Thr | p.A62T | Q16082 | protein_coding | tolerated(0.57) | benign(0.063) | TCGA-AP-A059-01 | Endometrium | uterine corpus endometrioid carcinoma | Female | >=65 | I/II | Unknown | Unknown | SD |
| HSPB2 | SNV | Missense_Mutation | c.317G>A | p.Arg106His | p.R106H | Q16082 | protein_coding | deleterious(0) | probably_damaging(0.997) | TCGA-AP-A0LM-01 | Endometrium | uterine corpus endometrioid carcinoma | Female | <65 | III/IV | Chemotherapy | cisplatin | SD | |
| HSPB2 | SNV | Missense_Mutation | novel | c.109G>C | p.Glu37Gln | p.E37Q | Q16082 | protein_coding | tolerated(0.11) | possibly_damaging(0.514) | TCGA-AX-A2H2-01 | Endometrium | uterine corpus endometrioid carcinoma | Female | >=65 | I/II | Unknown | Unknown | SD |
| HSPB2 | SNV | Missense_Mutation | novel | c.136N>A | p.Gly46Ser | p.G46S | Q16082 | protein_coding | tolerated(0.27) | benign(0.075) | TCGA-B5-A11E-01 | Endometrium | uterine corpus endometrioid carcinoma | Female | <65 | I/II | Unknown | Unknown | SD |
| HSPB2 | SNV | Missense_Mutation | novel | c.419N>T | p.Gly140Val | p.G140V | Q16082 | protein_coding | deleterious(0) | probably_damaging(1) | TCGA-B5-A3FC-01 | Endometrium | uterine corpus endometrioid carcinoma | Female | <65 | I/II | Unknown | Unknown | SD |
| HSPB2 | SNV | Missense_Mutation | novel | c.382N>A | p.Asp128Asn | p.D128N | Q16082 | protein_coding | tolerated(0.1) | benign(0.122) | TCGA-E6-A1LX-01 | Endometrium | uterine corpus endometrioid carcinoma | Female | <65 | I/II | Unknown | Unknown | SD |
| HSPB2 | SNV | Missense_Mutation | rs587739341 | c.392G>A | p.Arg131Gln | p.R131Q | Q16082 | protein_coding | tolerated(0.59) | possibly_damaging(0.661) | TCGA-EO-A22U-01 | Endometrium | uterine corpus endometrioid carcinoma | Female | >=65 | I/II | Unknown | Unknown | SD |
| Page: 1 2 |
Top |
Related drugs of malignant transformation related genes |
| Identification of chemicals and drugs interact with genes involved in malignant transfromation |
| (DGIdb 4.0) |
| Entrez ID | Symbol | Category | Interaction Types | Drug Claim Name | Drug Name | PMIDs |
| 3316 | HSPB2 | KINASE | PS-341 | BORTEZOMIB | 15004512 | |
| 3316 | HSPB2 | KINASE | PROTEASOME INHIBITOR | 15004512 | ||
| 3316 | HSPB2 | KINASE | MTX | METHOTREXATE | 15519494 | |
| 3316 | HSPB2 | KINASE | ANTINEOPLASTIC | 11174852 | ||
| 3316 | HSPB2 | KINASE | IL-10 | INTERLEUKIN-10 | 11034403 | |
| 3316 | HSPB2 | KINASE | CSA | CYCLOSPORINE | 10076049 | |
| 3316 | HSPB2 | KINASE | DIFFERENTIATION INDUCER | 9332492 | ||
| 3316 | HSPB2 | KINASE | TAMOXIFEN | TAMOXIFEN | 9607585 | |
| 3316 | HSPB2 | KINASE | HERCEPTIN | HERCEPTIN | 16048908 | |
| 3316 | HSPB2 | KINASE | PROPRANOLOL | PROPRANOLOL | 11368160 |
| Page: 1 2 |

Copyright 2023-Present -The University of Texas Health Science Center at Houston |