Schematic overview of the cellular and molecular mechanisms involved in the cancer progression, including the proposed cellular and molecular mechanisms in cancer cells trajectory. AT1: alveolar type 1 cells; AT2: alveolar type 2 cells; AAH: atypical adenomatous hyperplasia; AIS: adenocarcinoma in situ; MIA: minimally invasive adenocarcinoma; IA: invasive adenocarcinoma; EMT: epithelial-mesenchymal transition

Home

Download

Statistics

Help

Contact

Center for Computational Systems Medicine
leaf

Gene summary

leaf

Malignant transformation analysis

leaf

Malignant transformation related pathway analysis

leaf

Cell-cell communication analysis

leaf

Single-cell gene regulatory network inference analysis

leaf

Somatic mutation of malignant transformation related genes

leaf

Related drugs of malignant transformation related genes

Gene: HSPB11

Gene summary for HSPB11

check button Gene summary.

Gene informationSpeciesHuman
Gene symbol

HSPB11

Gene ID

51668

Gene nameheat shock protein family B (small) member 11
Gene AliasC1orf41
Cytomap1p32.3
Gene Typeprotein-coding
GO ID

GO:0000003

UniProtAcc

Q9Y547


Top

Malignant transformation analysis

check button Identification of the aberrant gene expression in precancerous and cancerous lesions by comparing the gene expression of stem-like cells in diseased tissues with normal stem cells
check button Malignant transformation involving gene list.
Entrez IDSymbolReplicatesSpeciesOrganTissueAdj P-valueLog2FCMalignancy
51668HSPB11GSM4909281HumanBreastIDC1.73e-124.73e-010.21
51668HSPB11GSM4909282HumanBreastIDC7.42e-488.77e-01-0.0288
51668HSPB11GSM4909285HumanBreastIDC9.58e-215.45e-010.21
51668HSPB11GSM4909287HumanBreastIDC1.18e-053.88e-010.2057
51668HSPB11GSM4909296HumanBreastIDC7.34e-09-1.62e-020.1524
51668HSPB11GSM4909297HumanBreastIDC4.81e-04-2.58e-020.1517
51668HSPB11GSM4909311HumanBreastIDC6.01e-16-1.13e-010.1534
51668HSPB11GSM4909312HumanBreastIDC5.21e-093.72e-020.1552
51668HSPB11GSM4909319HumanBreastIDC1.87e-21-1.13e-010.1563
51668HSPB11GSM4909320HumanBreastIDC2.40e-022.10e-020.1575
51668HSPB11GSM4909321HumanBreastIDC2.87e-06-6.42e-020.1559
51668HSPB11NCCBC5HumanBreastDCIS9.15e-056.08e-020.2046
51668HSPB11P1HumanBreastIDC4.67e-07-1.35e-010.1527
51668HSPB11DCIS2HumanBreastDCIS1.51e-521.10e-010.0085
51668HSPB11LZE4THumanEsophagusESCC8.80e-082.66e-010.0811
51668HSPB11LZE5THumanEsophagusESCC1.50e-036.89e-010.0514
51668HSPB11LZE7THumanEsophagusESCC2.32e-077.28e-010.0667
51668HSPB11LZE8THumanEsophagusESCC8.62e-103.70e-010.067
51668HSPB11LZE20THumanEsophagusESCC7.44e-074.79e-010.0662
51668HSPB11LZE22THumanEsophagusESCC6.60e-068.10e-010.068
Page: 1 2 3 4 5 6 7 8 

check button Transcriptomic changes along malignancy continuum.
TissueExpression DynamicsAbbreviation
BreastThe image shows the transcriptomic changes along malignancy continuum.log2FC in expression of this searched gene in stem-like cells from each diseased tissue sample relative to stem-like cells in normal samples in each tissue plotted against the malignancy continuum. Samples are colored based on if they are from different disease stage.IDC: Invasive ductal carcinoma
DCIS: Ductal carcinoma in situ
Precancer(BRCA1-mut): Precancerous lesion from BRCA1 mutation carriers
EsophagusThe image shows the transcriptomic changes along malignancy continuum.log2FC in expression of this searched gene in stem-like cells from each diseased tissue sample relative to stem-like cells in normal samples in each tissue plotted against the malignancy continuum. Samples are colored based on if they are from different disease stage.
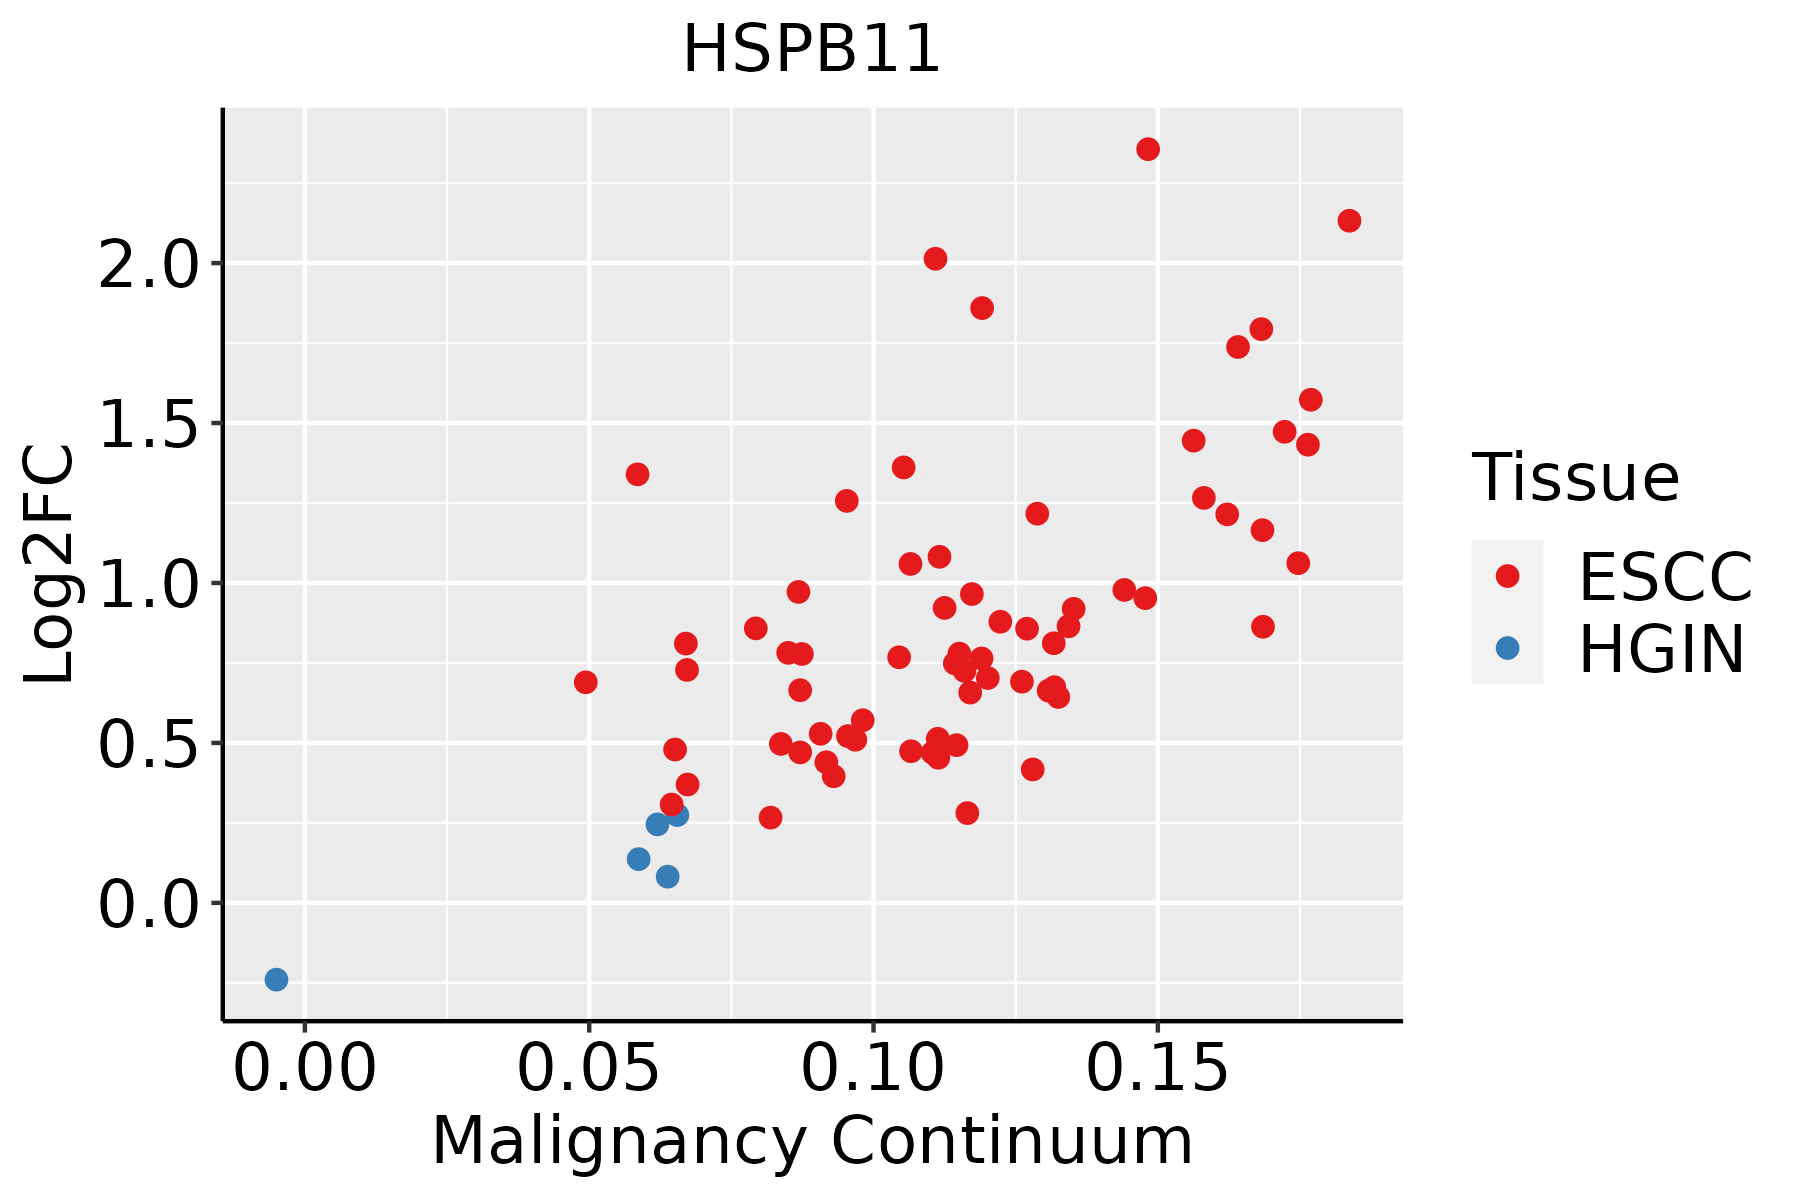
ESCC: Esophageal squamous cell carcinoma
HGIN: High-grade intraepithelial neoplasias
LGIN: Low-grade intraepithelial neoplasias
LiverThe image shows the transcriptomic changes along malignancy continuum.log2FC in expression of this searched gene in stem-like cells from each diseased tissue sample relative to stem-like cells in normal samples in each tissue plotted against the malignancy continuum. Samples are colored based on if they are from different disease stage.
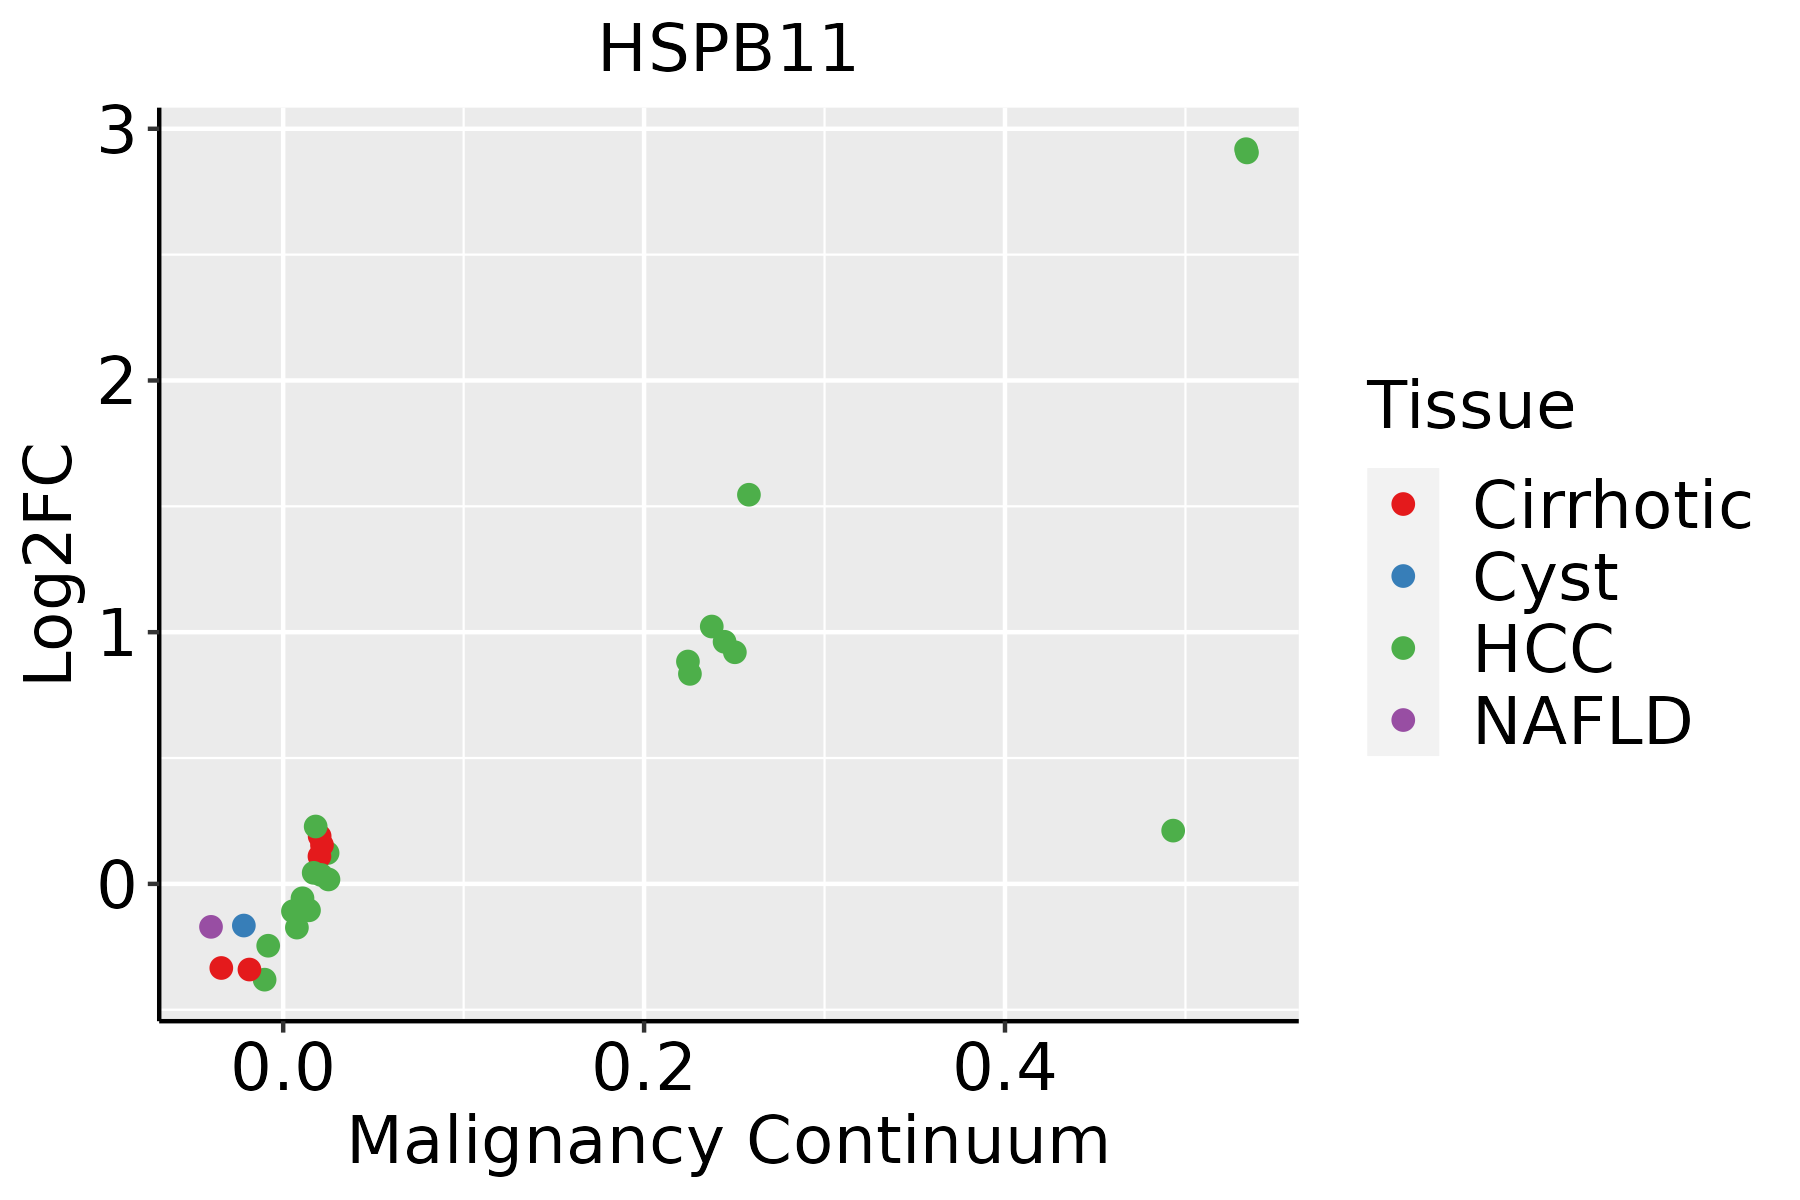
HCC: Hepatocellular carcinoma
NAFLD: Non-alcoholic fatty liver disease
Oral CavityThe image shows the transcriptomic changes along malignancy continuum.log2FC in expression of this searched gene in stem-like cells from each diseased tissue sample relative to stem-like cells in normal samples in each tissue plotted against the malignancy continuum. Samples are colored based on if they are from different disease stage.
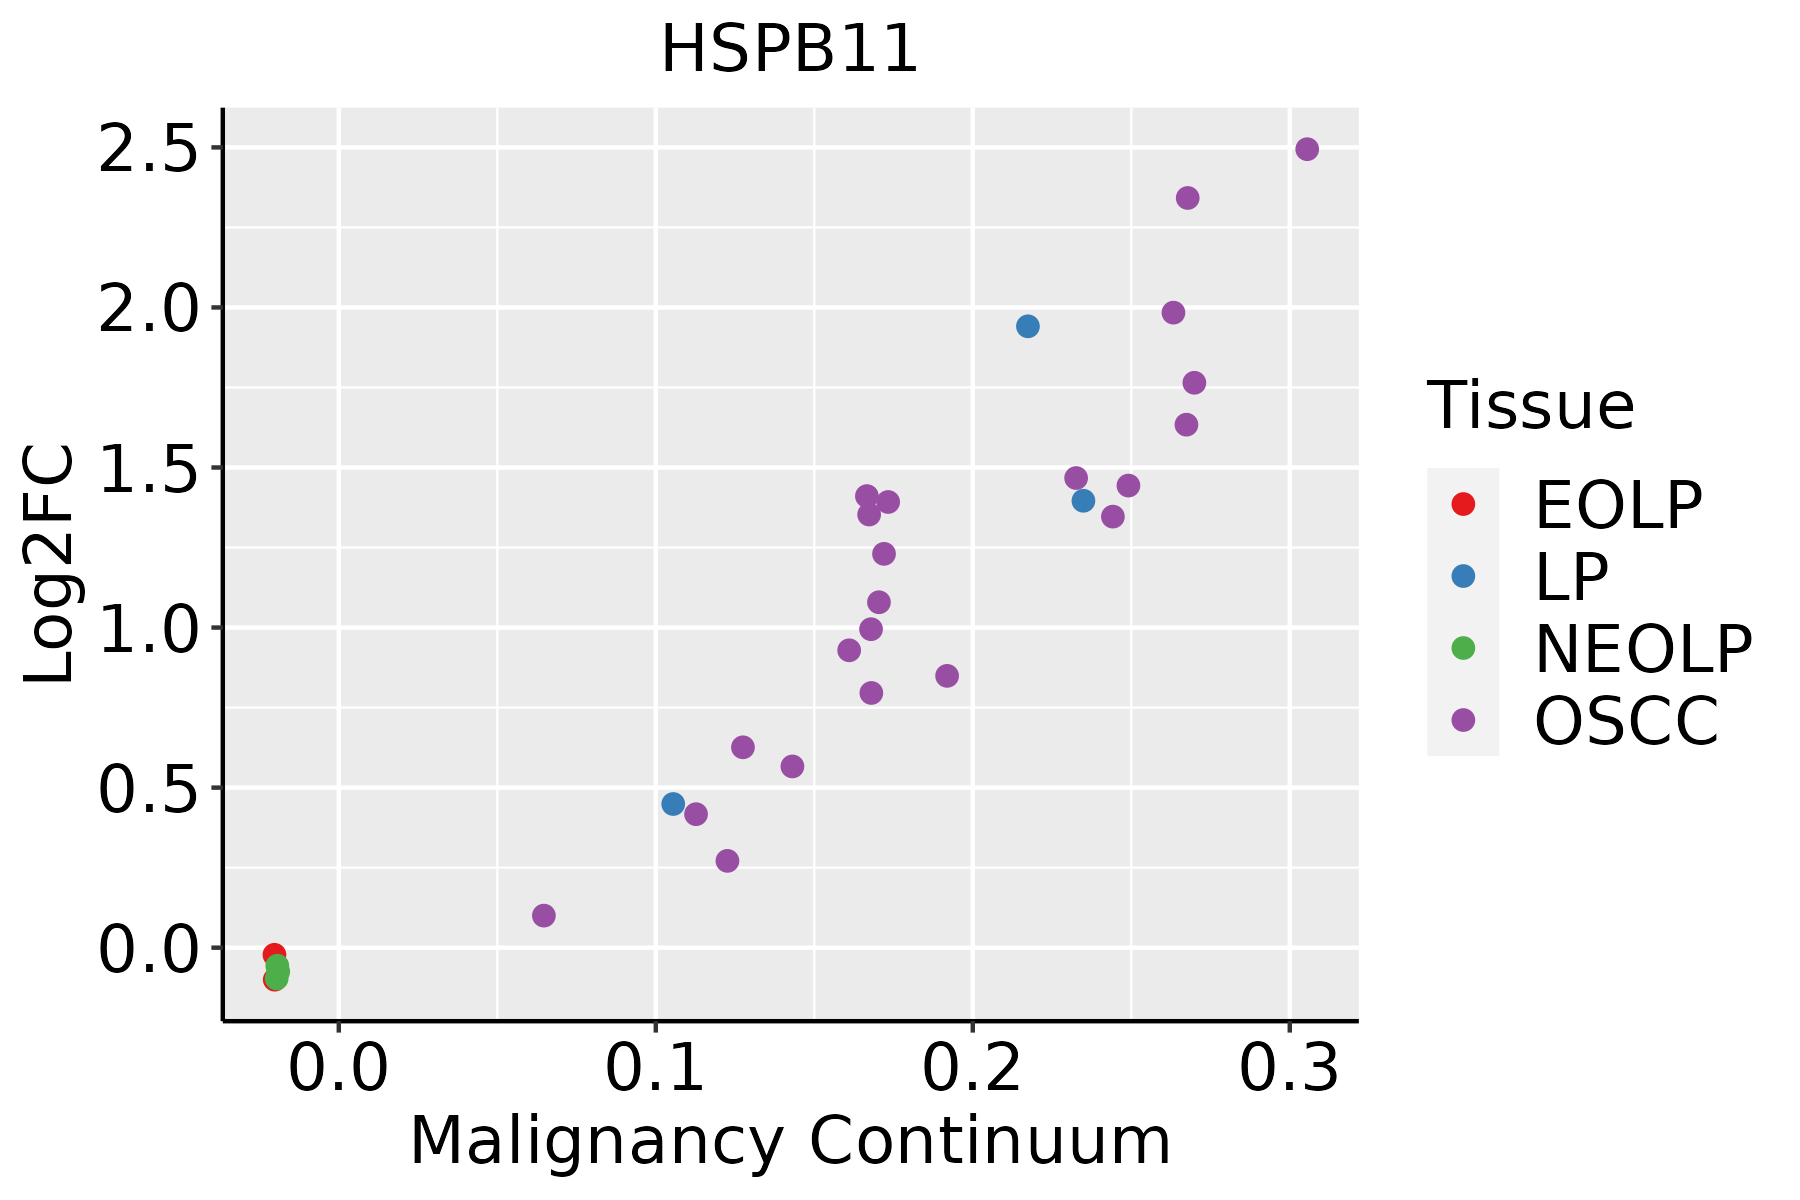
EOLP: Erosive Oral lichen planus
LP: leukoplakia
NEOLP: Non-erosive oral lichen planus
OSCC: Oral squamous cell carcinoma
ProstateThe image shows the transcriptomic changes along malignancy continuum.log2FC in expression of this searched gene in stem-like cells from each diseased tissue sample relative to stem-like cells in normal samples in each tissue plotted against the malignancy continuum. Samples are colored based on if they are from different disease stage.BPH: Benign Prostatic Hyperplasia
SkinThe image shows the transcriptomic changes along malignancy continuum.log2FC in expression of this searched gene in stem-like cells from each diseased tissue sample relative to stem-like cells in normal samples in each tissue plotted against the malignancy continuum. Samples are colored based on if they are from different disease stage.
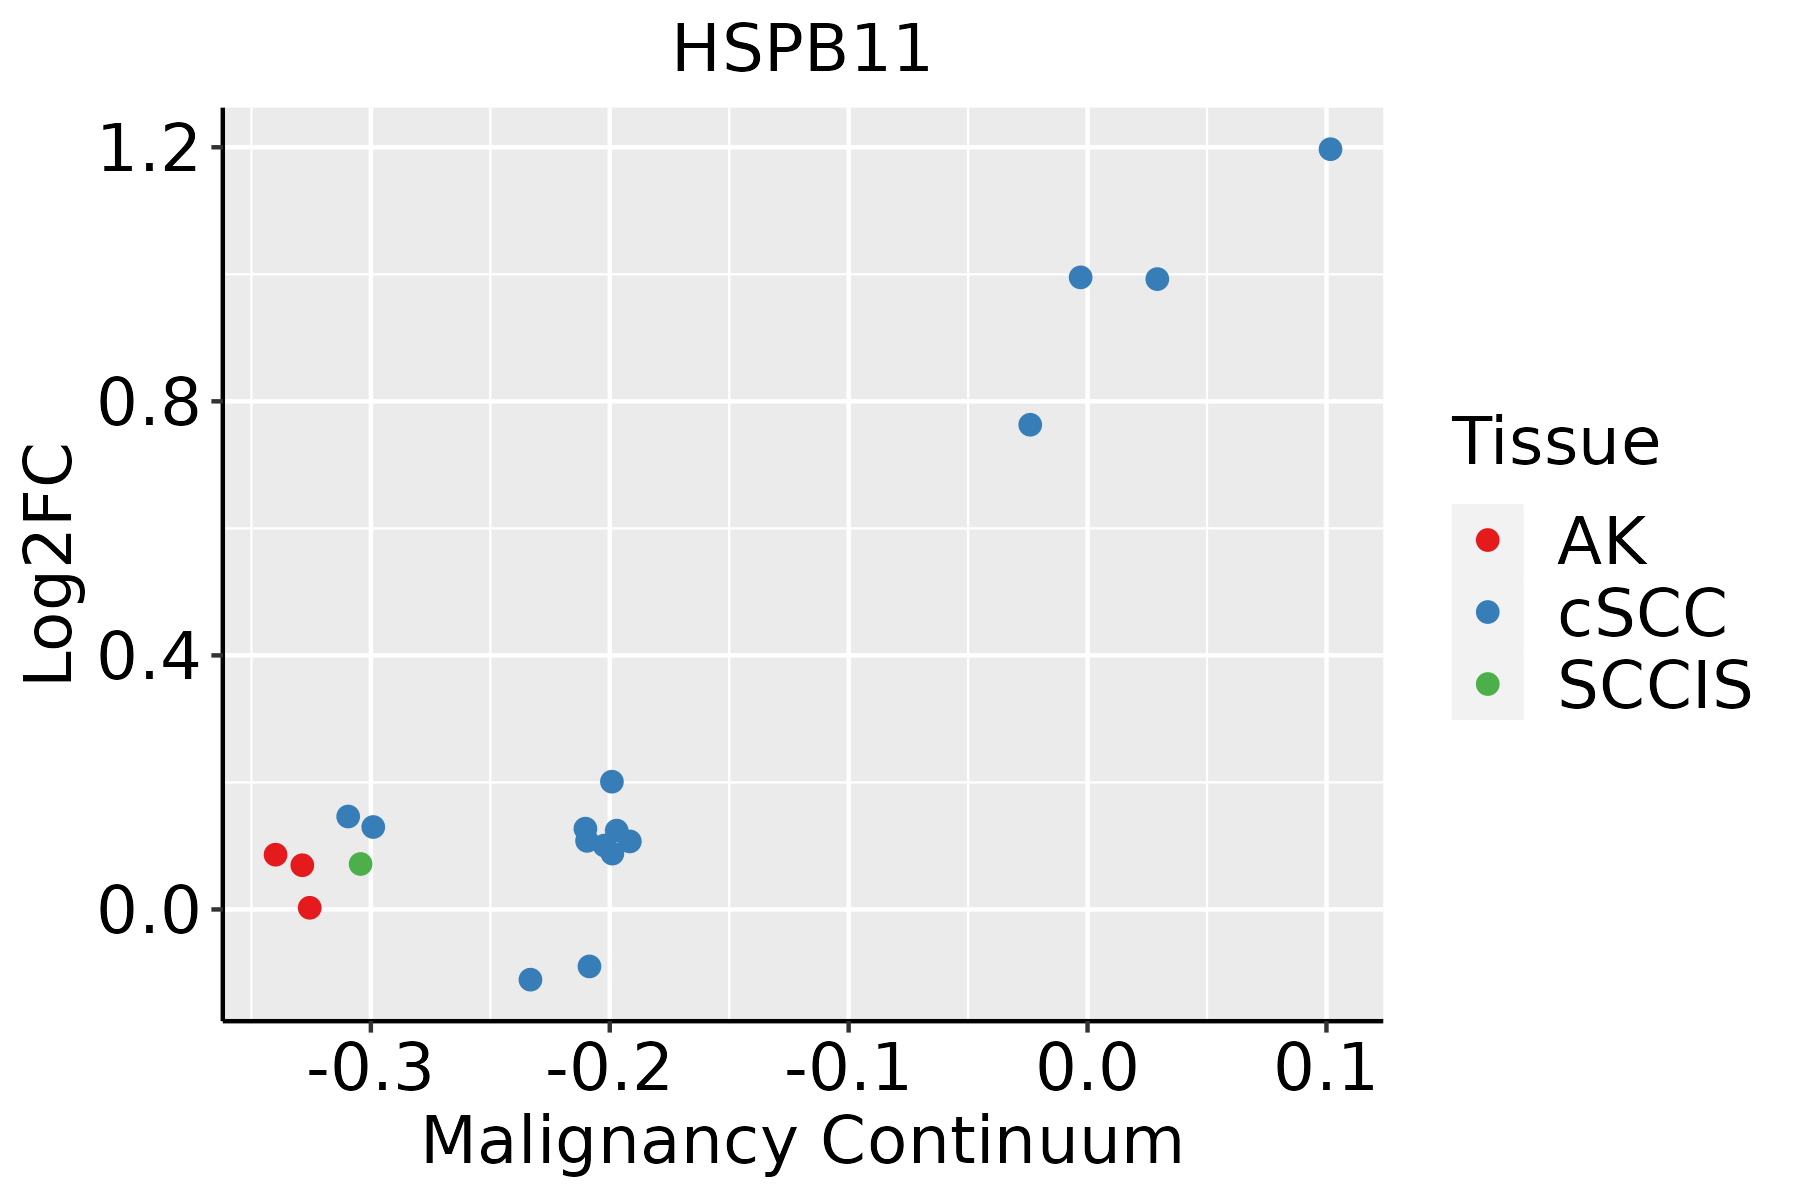
AK: Actinic keratosis
cSCC: Cutaneous squamous cell carcinoma
SCCIS:squamous cell carcinoma in situ
ThyroidThe image shows the transcriptomic changes along malignancy continuum.log2FC in expression of this searched gene in stem-like cells from each diseased tissue sample relative to stem-like cells in normal samples in each tissue plotted against the malignancy continuum. Samples are colored based on if they are from different disease stage.ATC: Anaplastic thyroid cancer
HT: Hashimoto's thyroiditis
PTC: Papillary thyroid cancer
∗log2FC in expression of this searched gene in stem-like cells from each diseased tissue sample relative to stem-like cells in normal samples in each tissue plotted against the malignancy continuum. Samples are colored based on if they are from different disease stage.

Top

Malignant transformation related pathway analysis

check buttonFind out the enriched GO biological processes and KEGG pathways involved in transition from healthy to precancer to cancer
check button Figure of enriched GO biological processes.
TissueDisease StageEnriched GO biological Processes
ColorectumADGO analysis - Figure of enriched GO biological processes: Top 15 enriched GO BP terms are showed in the bar plot of each disease state in each tissue. Each row represents a significant GO biological process which is colored according to the -log10(p.adjust).
ColorectumSERGO analysis - Figure of enriched GO biological processes: Top 15 enriched GO BP terms are showed in the bar plot of each disease state in each tissue. Each row represents a significant GO biological process which is colored according to the -log10(p.adjust).
ColorectumMSSGO analysis - Figure of enriched GO biological processes: Top 15 enriched GO BP terms are showed in the bar plot of each disease state in each tissue. Each row represents a significant GO biological process which is colored according to the -log10(p.adjust).
ColorectumMSI-HGO analysis - Figure of enriched GO biological processes: Top 15 enriched GO BP terms are showed in the bar plot of each disease state in each tissue. Each row represents a significant GO biological process which is colored according to the -log10(p.adjust).
ColorectumFAPGO analysis - Figure of enriched GO biological processes: Top 15 enriched GO BP terms are showed in the bar plot of each disease state in each tissue. Each row represents a significant GO biological process which is colored according to the -log10(p.adjust).
∗Top 15 enriched GO BP terms are showed in the bar plot of each disease state in each tissue. Each row represents a significant GO biological process which is colored according to the -log10(p.adjust).
Page: 1 2 3 4 5 6 7 8 9 

check button Enriched GO biological processes.
GO IDTissueDisease StageDescriptionGene RatioBg Ratiopvaluep.adjustCount
GO:00303244BreastIDClung development28/1434177/187231.90e-043.15e-0328
GO:00303234BreastIDCrespiratory tube development28/1434181/187232.78e-044.26e-0328
GO:00605412BreastIDCrespiratory system development30/1434203/187233.85e-045.40e-0330
GO:00016555BreastIDCurogenital system development39/1434338/187236.75e-034.68e-0239
GO:003032413BreastDCISlung development27/1390177/187232.73e-044.09e-0327
GO:003032313BreastDCISrespiratory tube development27/1390181/187233.93e-045.41e-0327
GO:006054111BreastDCISrespiratory system development28/1390203/187231.10e-031.19e-0228
GO:003070518EsophagusESCCcytoskeleton-dependent intracellular transport133/8552195/187231.48e-104.27e-09133
GO:001097013EsophagusESCCtransport along microtubule107/8552155/187233.17e-096.80e-08107
GO:003150314EsophagusESCCprotein-containing complex localization139/8552220/187231.14e-071.85e-06139
GO:00303239EsophagusESCCrespiratory tube development112/8552181/187237.82e-067.69e-05112
GO:00605417EsophagusESCCrespiratory system development123/8552203/187231.26e-051.15e-04123
GO:00303249EsophagusESCClung development109/8552177/187231.40e-051.27e-04109
GO:00991114EsophagusESCCmicrotubule-based transport115/8552190/187232.54e-052.15e-04115
GO:00016559EsophagusESCCurogenital system development177/8552338/187237.51e-032.69e-02177
GO:00303242LiverCirrhoticlung development65/4634177/187232.49e-042.25e-0365
GO:00303232LiverCirrhoticrespiratory tube development66/4634181/187232.82e-042.49e-0366
GO:003070511LiverCirrhoticcytoskeleton-dependent intracellular transport68/4634195/187239.54e-046.77e-0368
GO:0031503LiverCirrhoticprotein-containing complex localization75/4634220/187231.13e-037.73e-0375
GO:00605411LiverCirrhoticrespiratory system development67/4634203/187234.81e-032.52e-0267
Page: 1 2 3 4 5 

check button Enriched KEGG pathways.
Pathway IDTissueDisease StageDescriptionGene RatioBg Ratiopvaluep.adjustqvalueCount
Page: 1 

Top

Cell-cell communication analysis

check buttonIdentification of potential cell-cell interactions between two cell types and their ligand-receptor pairs for different disease states
LigandReceptorLRpairPathwayTissueDisease Stage
Page: 1 

Top

Single-cell gene regulatory network inference analysis

check buttonFind out the significant the regulons (TFs) and the target genes of each regulon across cell types for different disease states
TFCell TypeTissueDisease StageTarget GeneRSSRegulon Activity
∗The dot plots of a searched regulon are shown for all cell subpopulations in each disease state of each tissue based on the regulon specific score inferred using pySCENIC and by calculating the average expression.
Page: 1 

Top

Somatic mutation of malignant transformation related genes

check buttonAnnotation of somatic variants for genes involved in malignant transformation
Hugo SymbolVariant ClassVariant ClassificationdbSNP RSHGVScHGVSpHGVSp ShortSWISSPROTBIOTYPESIFTPolyPhenTumor Sample BarcodeTissueHistologySexAgeStageTherapy TypesDrugsOutcome
HSPB11SNVMissense_Mutationrs751666876c.379N>Tp.Ala127Serp.A127SQ9Y547protein_codingdeleterious(0.01)benign(0.363)TCGA-AR-A5QQ-01Breastbreast invasive carcinomaFemale>=65III/IVChemotherapycarboplatinPD
HSPB11SNVMissense_Mutationc.332N>Gp.Ser111Cysp.S111CQ9Y547protein_codingtolerated(0.05)benign(0.251)TCGA-IR-A3LH-01Cervixcervical & endocervical cancerFemale<65I/IIChemotherapycisplatinCR
HSPB11SNVMissense_Mutationc.31G>Ap.Glu11Lysp.E11KQ9Y547protein_codingtolerated(0.34)benign(0.29)TCGA-CK-4951-01Colorectumcolon adenocarcinomaFemale>=65I/IIUnknownUnknownPD
HSPB11SNVMissense_Mutationc.338C>Gp.Thr113Serp.T113SQ9Y547protein_codingtolerated(0.17)benign(0.116)TCGA-CM-6674-01Colorectumcolon adenocarcinomaMale<65I/IIUnknownUnknownSD
HSPB11SNVMissense_Mutationnovelc.9N>Cp.Lys3Asnp.K3NQ9Y547protein_codingtolerated_low_confidence(0.4)benign(0)TCGA-AP-A1DV-01Endometriumuterine corpus endometrioid carcinomaFemale<65I/IIUnknownUnknownSD
HSPB11SNVMissense_Mutationrs769134105c.110C>Tp.Thr37Metp.T37MQ9Y547protein_codingdeleterious(0)probably_damaging(0.999)TCGA-B5-A11Y-01Endometriumuterine corpus endometrioid carcinomaFemale<65I/IIUnknownUnknownSD
HSPB11SNVMissense_Mutationrs746875573c.394N>Ap.Val132Ilep.V132IQ9Y547protein_codingtolerated(0.36)benign(0.01)TCGA-D1-A16X-01Endometriumuterine corpus endometrioid carcinomaFemale<65I/IIUnknownUnknownSD
HSPB11SNVMissense_Mutationc.262N>Cp.Trp88Argp.W88RQ9Y547protein_codingtolerated(0.19)benign(0.015)TCGA-D1-A17R-01Endometriumuterine corpus endometrioid carcinomaFemale<65I/IIUnknownUnknownSD
HSPB11SNVMissense_Mutationc.174N>Tp.Arg58Serp.R58SQ9Y547protein_codingtolerated(0.14)benign(0.001)TCGA-33-4566-01Lunglung squamous cell carcinomaMale<65I/IIUnknownUnknownSD
HSPB11SNVMissense_Mutationnovelc.176T>Ap.Ile59Asnp.I59NQ9Y547protein_codingdeleterious(0)probably_damaging(0.994)TCGA-94-8490-01Lunglung squamous cell carcinomaMale>=65I/IIUnknownUnknownSD
Page: 1 2 

Top

Related drugs of malignant transformation related genes

check buttonIdentification of chemicals and drugs interact with genes involved in malignant transfromation
(DGIdb 4.0)
Entrez IDSymbolCategoryInteraction TypesDrug Claim NameDrug NamePMIDs
Page: 1