
|
|||||
|
 | |
| |
| |
| |
| |
| |
|
Gene: HSPB1 |
Gene summary for HSPB1 |
| Gene information | Species | Human | Gene symbol | HSPB1 | Gene ID | 3315 |
| Gene name | heat shock protein family B (small) member 1 | |
| Gene Alias | CMT2F | |
| Cytomap | 7q11.23 | |
| Gene Type | protein-coding | GO ID | GO:0001525 | UniProtAcc | P04792 |
Top |
Malignant transformation analysis |
| Identification of the aberrant gene expression in precancerous and cancerous lesions by comparing the gene expression of stem-like cells in diseased tissues with normal stem cells |
| Entrez ID | Symbol | Replicates | Species | Organ | Tissue | Adj P-value | Log2FC | Malignancy |
| 3315 | HSPB1 | GSM4909280 | Human | Breast | Precancer | 7.43e-04 | 4.23e-01 | 0.0305 |
| 3315 | HSPB1 | GSM4909281 | Human | Breast | IDC | 1.58e-04 | 1.35e-01 | 0.21 |
| 3315 | HSPB1 | GSM4909282 | Human | Breast | IDC | 3.02e-72 | 9.71e-01 | -0.0288 |
| 3315 | HSPB1 | GSM4909285 | Human | Breast | IDC | 1.58e-11 | 2.57e-01 | 0.21 |
| 3315 | HSPB1 | GSM4909286 | Human | Breast | IDC | 1.06e-15 | -7.60e-01 | 0.1081 |
| 3315 | HSPB1 | GSM4909288 | Human | Breast | IDC | 4.70e-02 | -4.58e-01 | 0.0988 |
| 3315 | HSPB1 | GSM4909290 | Human | Breast | IDC | 2.40e-08 | -6.55e-01 | 0.2096 |
| 3315 | HSPB1 | GSM4909291 | Human | Breast | IDC | 2.59e-77 | 1.30e+00 | 0.1753 |
| 3315 | HSPB1 | GSM4909293 | Human | Breast | IDC | 1.22e-04 | 2.69e-02 | 0.1581 |
| 3315 | HSPB1 | GSM4909296 | Human | Breast | IDC | 4.74e-57 | 9.63e-01 | 0.1524 |
| 3315 | HSPB1 | GSM4909297 | Human | Breast | IDC | 5.80e-12 | 4.31e-01 | 0.1517 |
| 3315 | HSPB1 | GSM4909298 | Human | Breast | IDC | 4.33e-10 | 3.05e-01 | 0.1551 |
| 3315 | HSPB1 | GSM4909301 | Human | Breast | IDC | 2.70e-110 | 1.16e+00 | 0.1577 |
| 3315 | HSPB1 | GSM4909302 | Human | Breast | IDC | 4.70e-20 | 6.65e-01 | 0.1545 |
| 3315 | HSPB1 | GSM4909304 | Human | Breast | IDC | 2.30e-59 | 8.19e-01 | 0.1636 |
| 3315 | HSPB1 | GSM4909306 | Human | Breast | IDC | 3.03e-49 | 7.89e-01 | 0.1564 |
| 3315 | HSPB1 | GSM4909307 | Human | Breast | IDC | 2.44e-42 | 7.99e-01 | 0.1569 |
| 3315 | HSPB1 | GSM4909308 | Human | Breast | IDC | 2.68e-71 | 1.01e+00 | 0.158 |
| 3315 | HSPB1 | GSM4909309 | Human | Breast | IDC | 2.02e-03 | 4.21e-01 | 0.0483 |
| 3315 | HSPB1 | GSM4909311 | Human | Breast | IDC | 1.10e-18 | 3.19e-01 | 0.1534 |
| Page: 1 2 3 4 5 6 7 8 9 10 11 12 13 14 15 16 17 18 |
| Tissue | Expression Dynamics | Abbreviation |
| Breast | 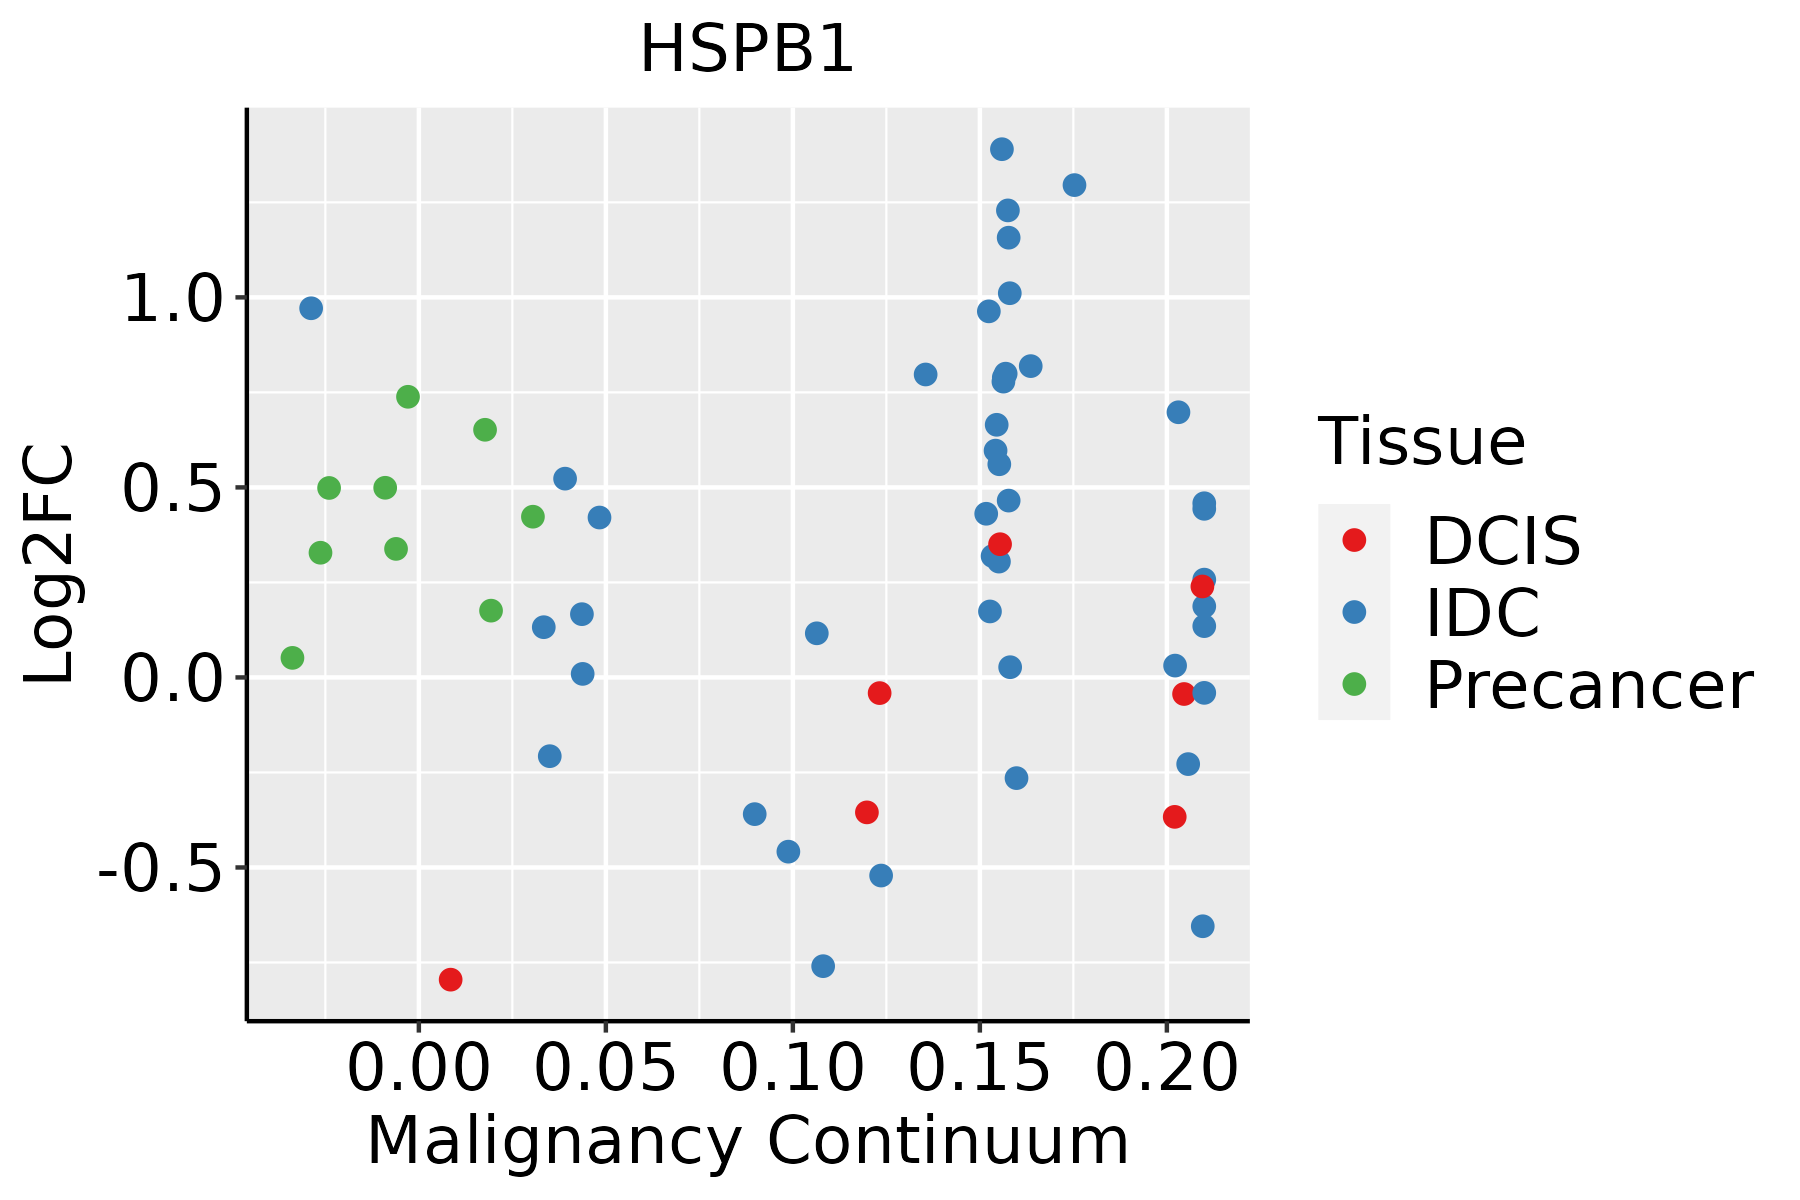 | IDC: Invasive ductal carcinoma |
| DCIS: Ductal carcinoma in situ | ||
| Precancer(BRCA1-mut): Precancerous lesion from BRCA1 mutation carriers | ||
| Cervix |  | CC: Cervix cancer |
| HSIL_HPV: HPV-infected high-grade squamous intraepithelial lesions | ||
| N_HPV: HPV-infected normal cervix | ||
| Colorectum (GSE201348) |  | FAP: Familial adenomatous polyposis |
| CRC: Colorectal cancer | ||
| Colorectum (HTA11) |  | AD: Adenomas |
| SER: Sessile serrated lesions | ||
| MSI-H: Microsatellite-high colorectal cancer | ||
| MSS: Microsatellite stable colorectal cancer | ||
| Endometrium |  | AEH: Atypical endometrial hyperplasia |
| EEC: Endometrioid Cancer | ||
| Esophagus |  | ESCC: Esophageal squamous cell carcinoma |
| HGIN: High-grade intraepithelial neoplasias | ||
| LGIN: Low-grade intraepithelial neoplasias | ||
| GC | 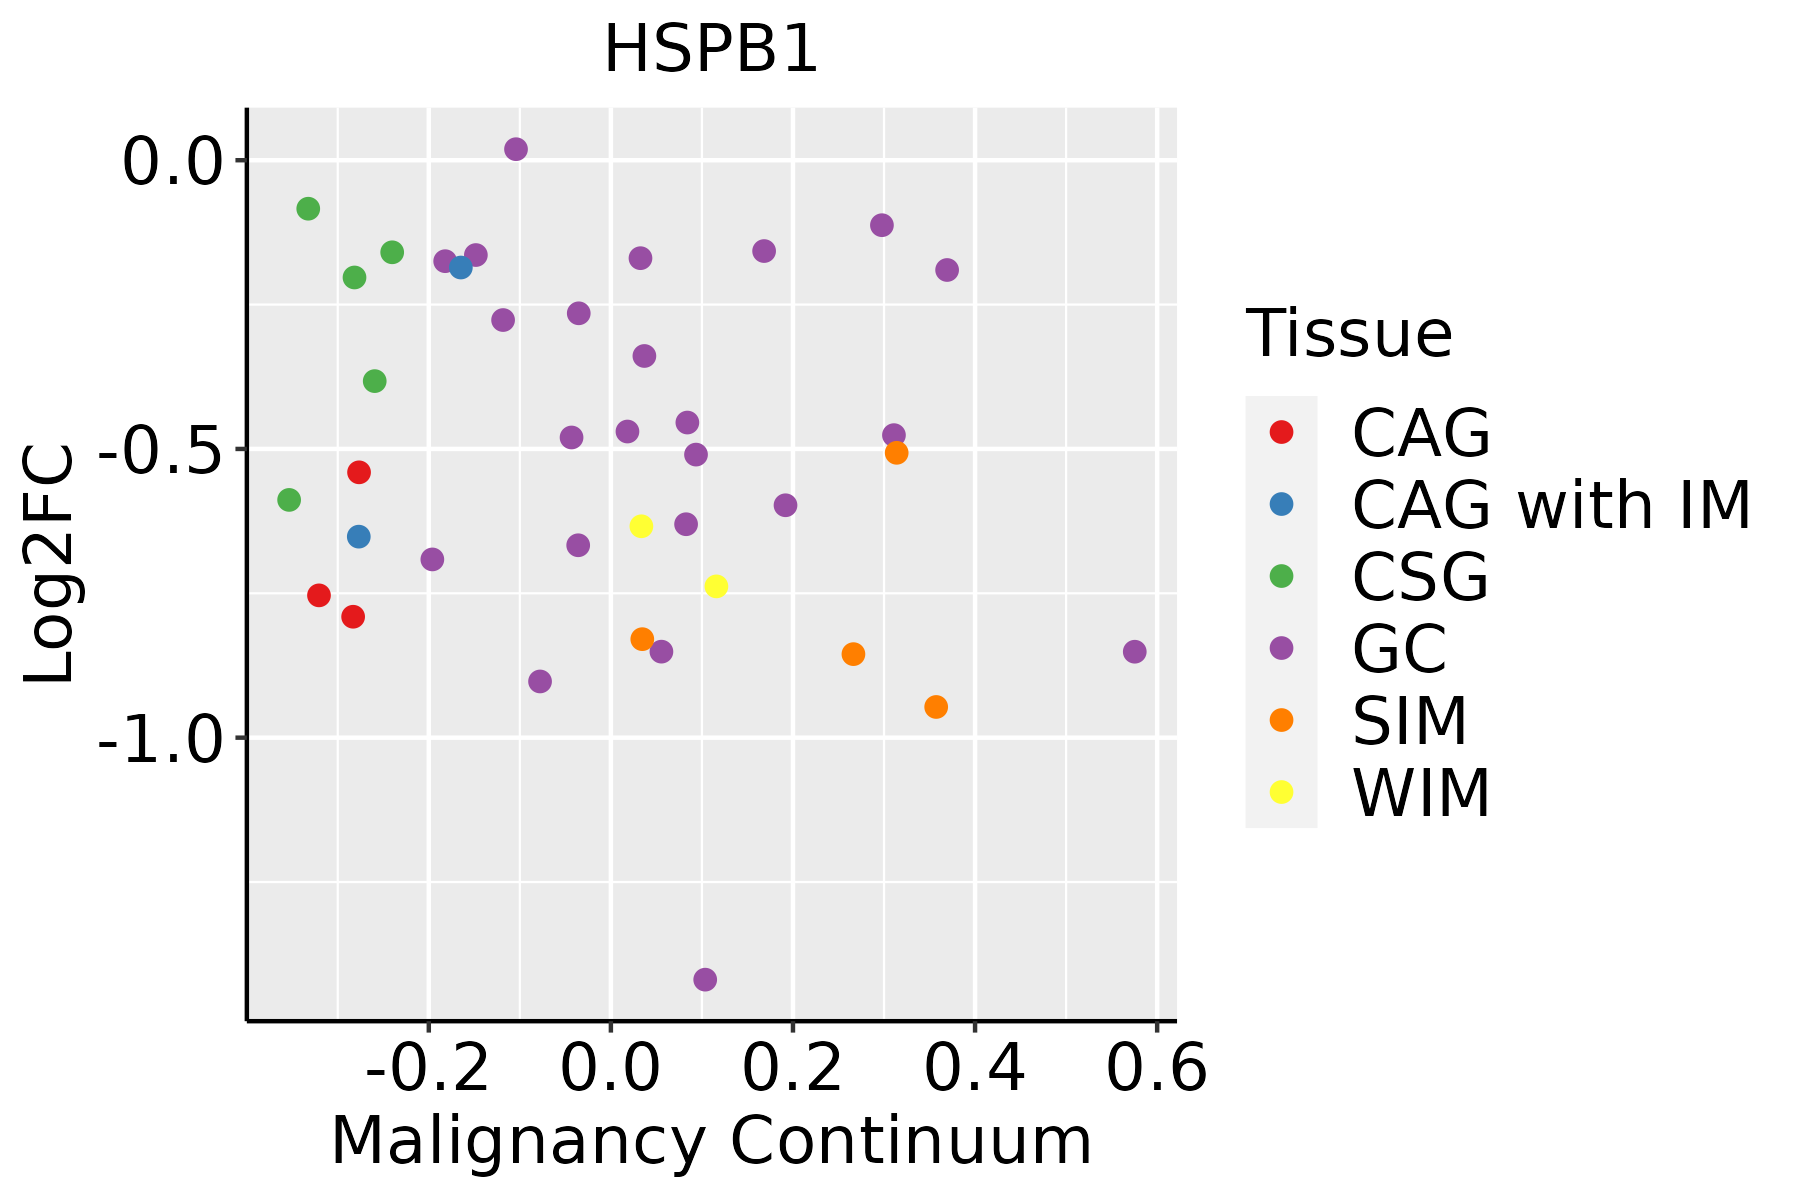 | CAG: Chronic atrophic gastritis |
| CAG with IM: Chronic atrophic gastritis with intestinal metaplasia | ||
| CSG: Chronic superficial gastritis | ||
| GC: Gastric cancer | ||
| SIM: Severe intestinal metaplasia | ||
| WIM: Wild intestinal metaplasia | ||
| Liver |  | HCC: Hepatocellular carcinoma |
| NAFLD: Non-alcoholic fatty liver disease | ||
| Lung | 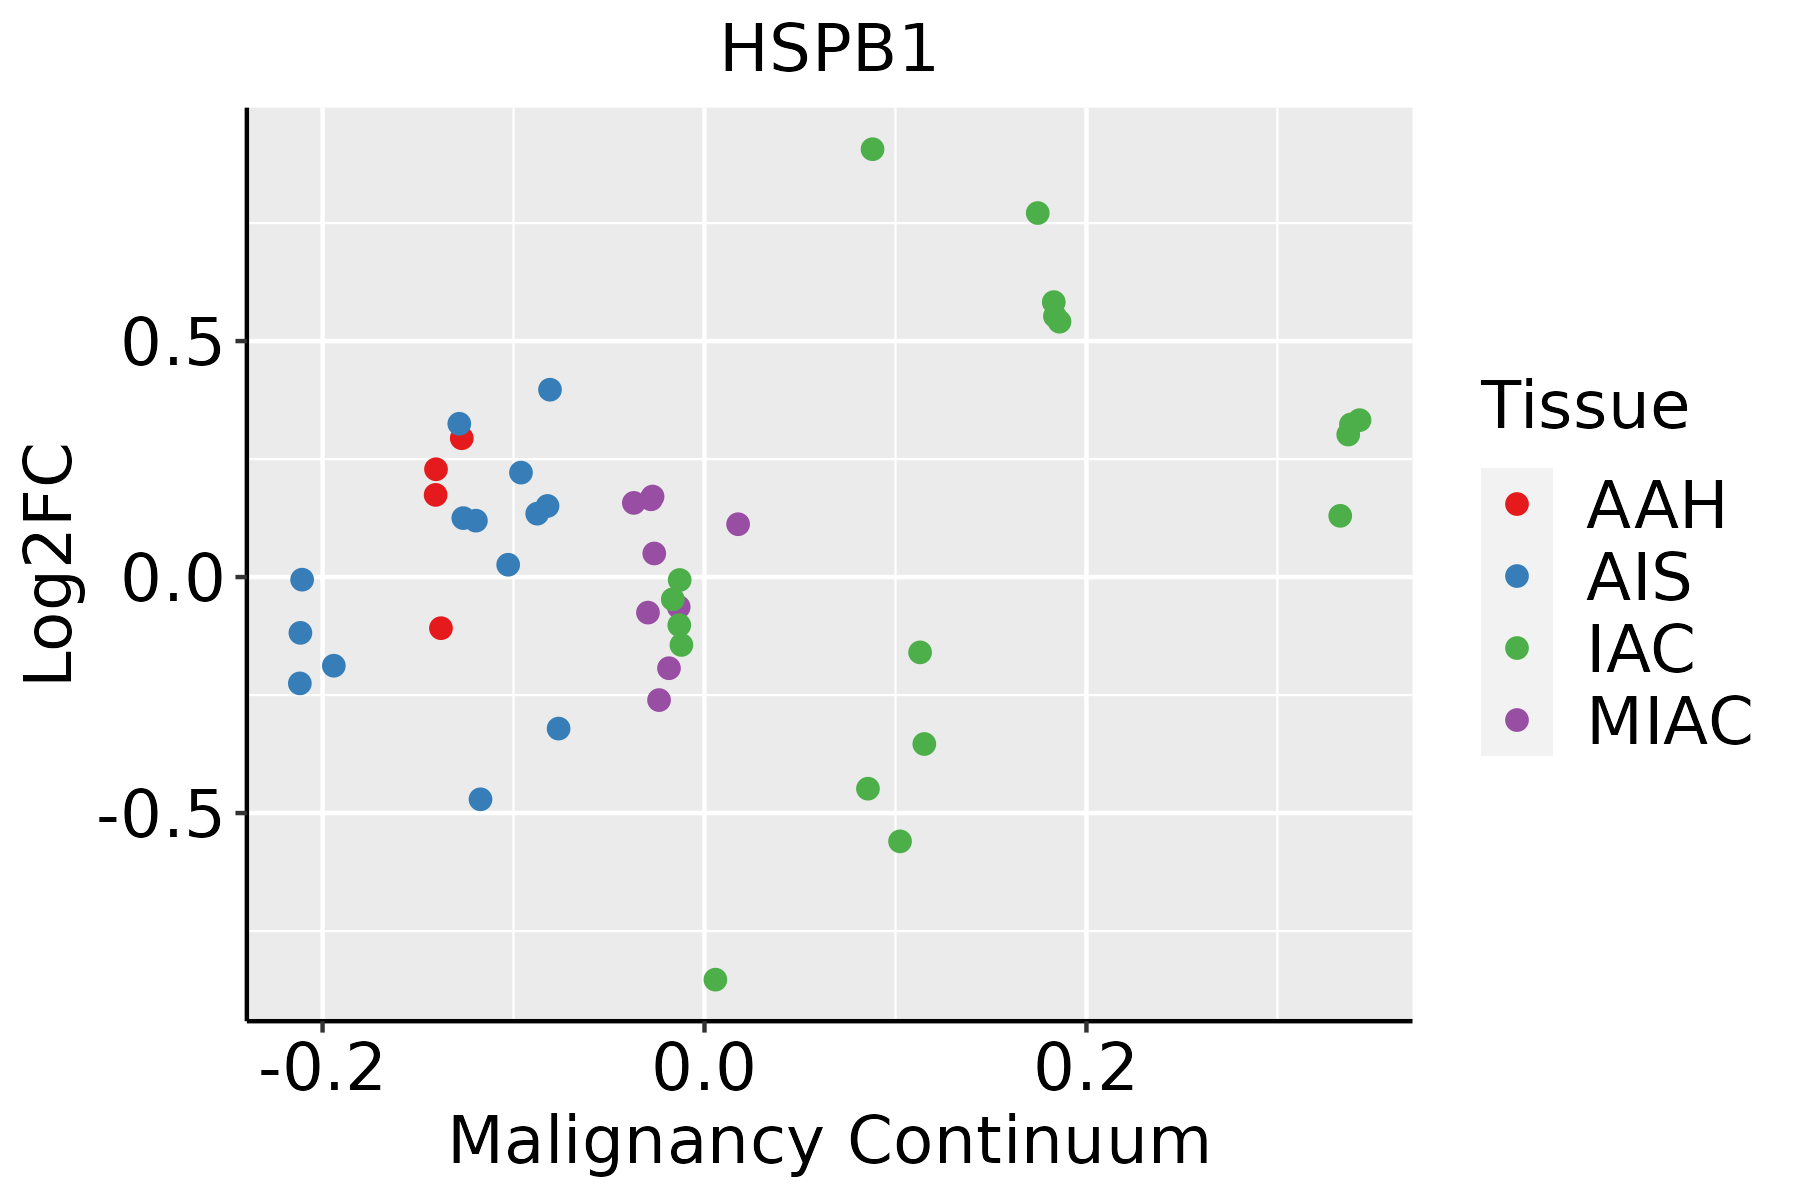 | AAH: Atypical adenomatous hyperplasia |
| AIS: Adenocarcinoma in situ | ||
| IAC: Invasive lung adenocarcinoma | ||
| MIA: Minimally invasive adenocarcinoma | ||
| Oral Cavity | 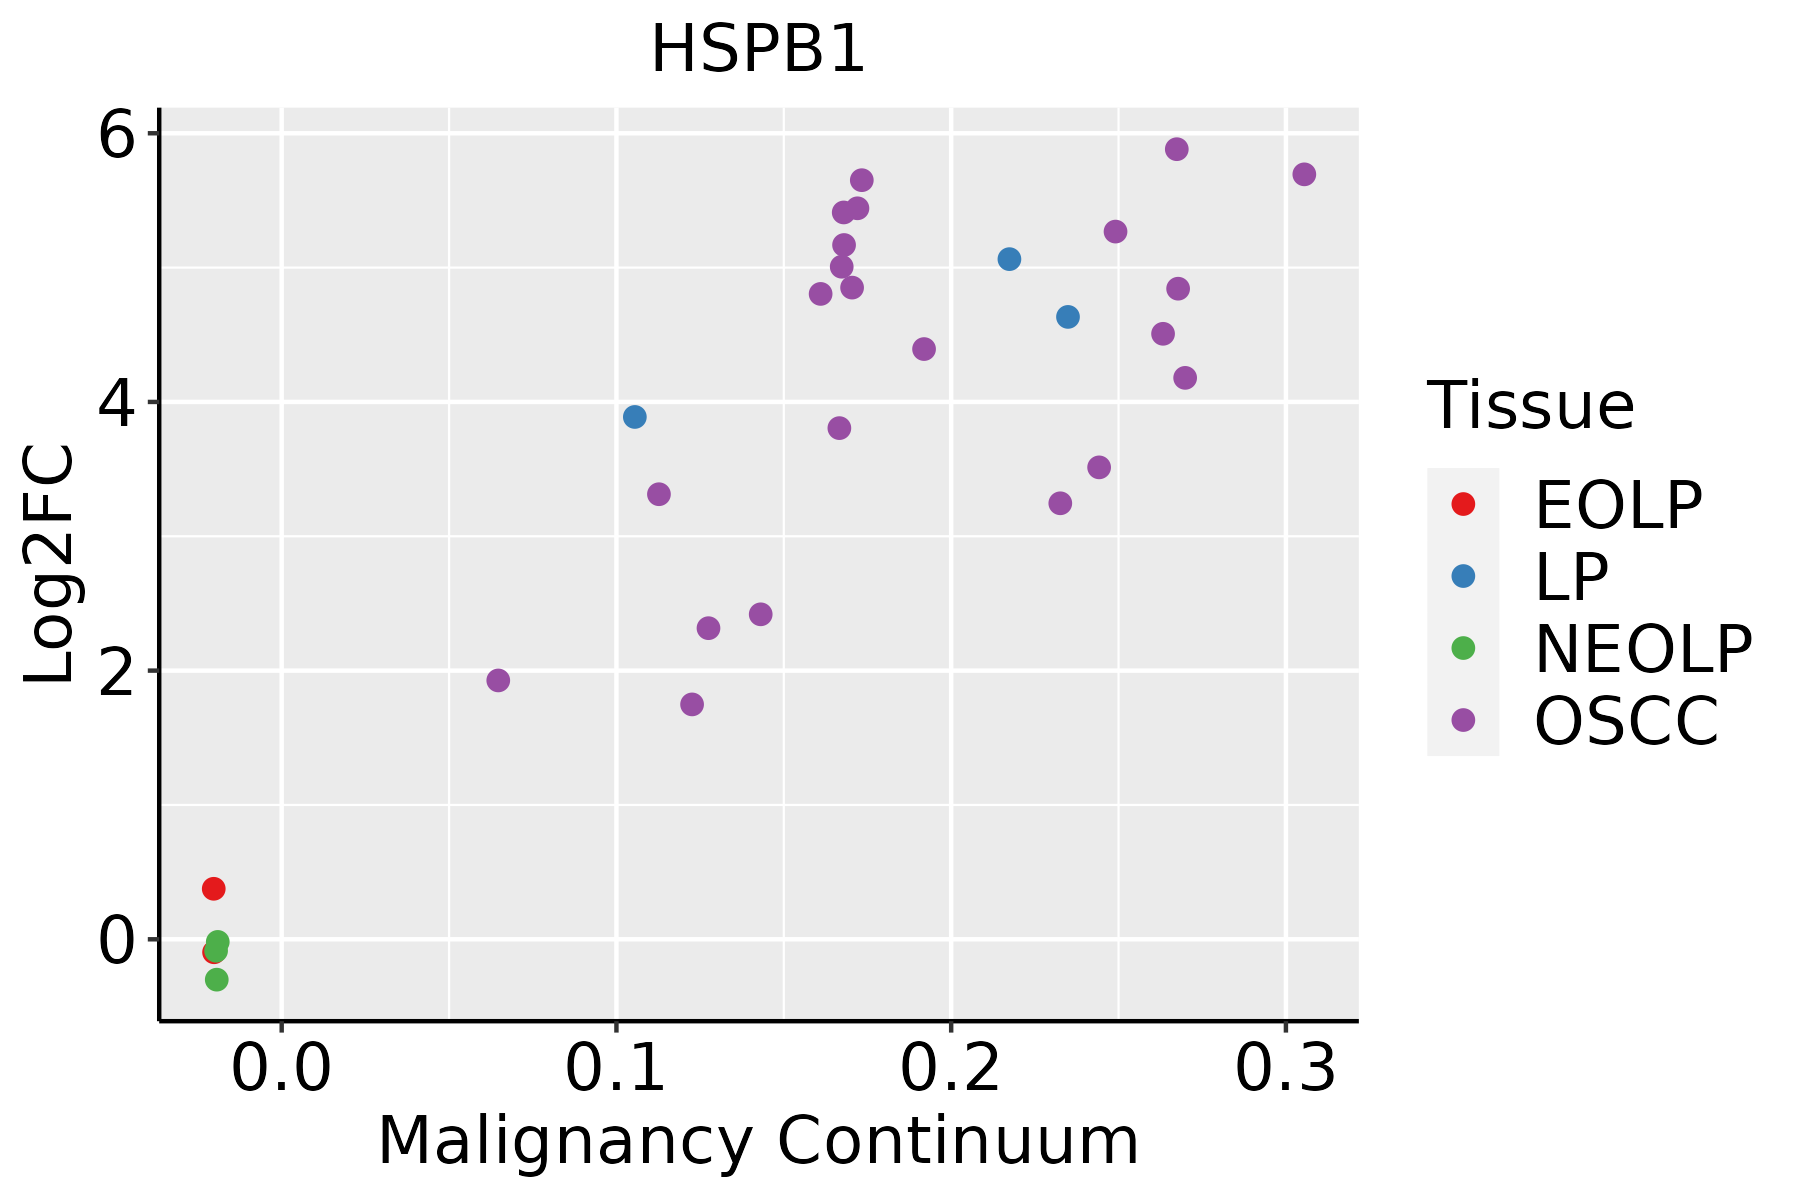 | EOLP: Erosive Oral lichen planus |
| LP: leukoplakia | ||
| NEOLP: Non-erosive oral lichen planus | ||
| OSCC: Oral squamous cell carcinoma | ||
| Prostate | 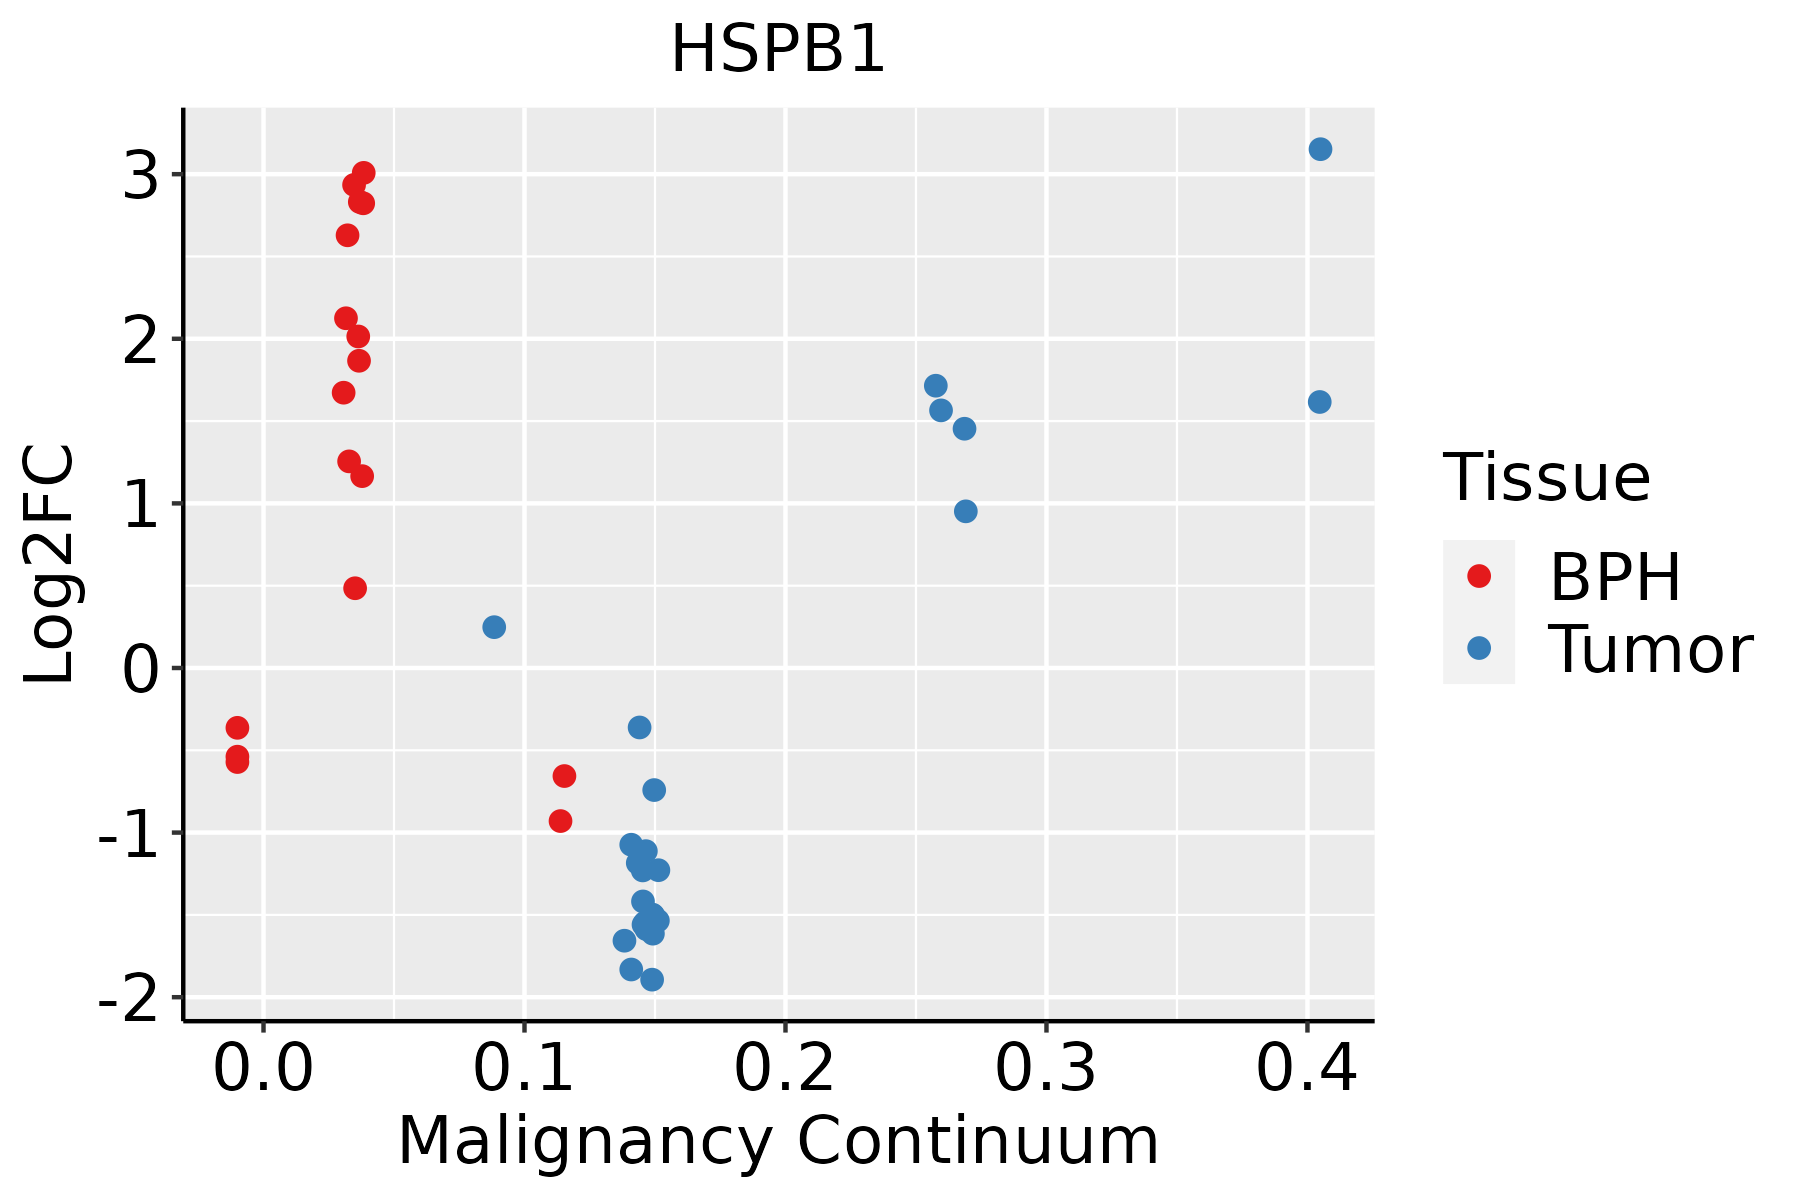 | BPH: Benign Prostatic Hyperplasia |
| Skin | 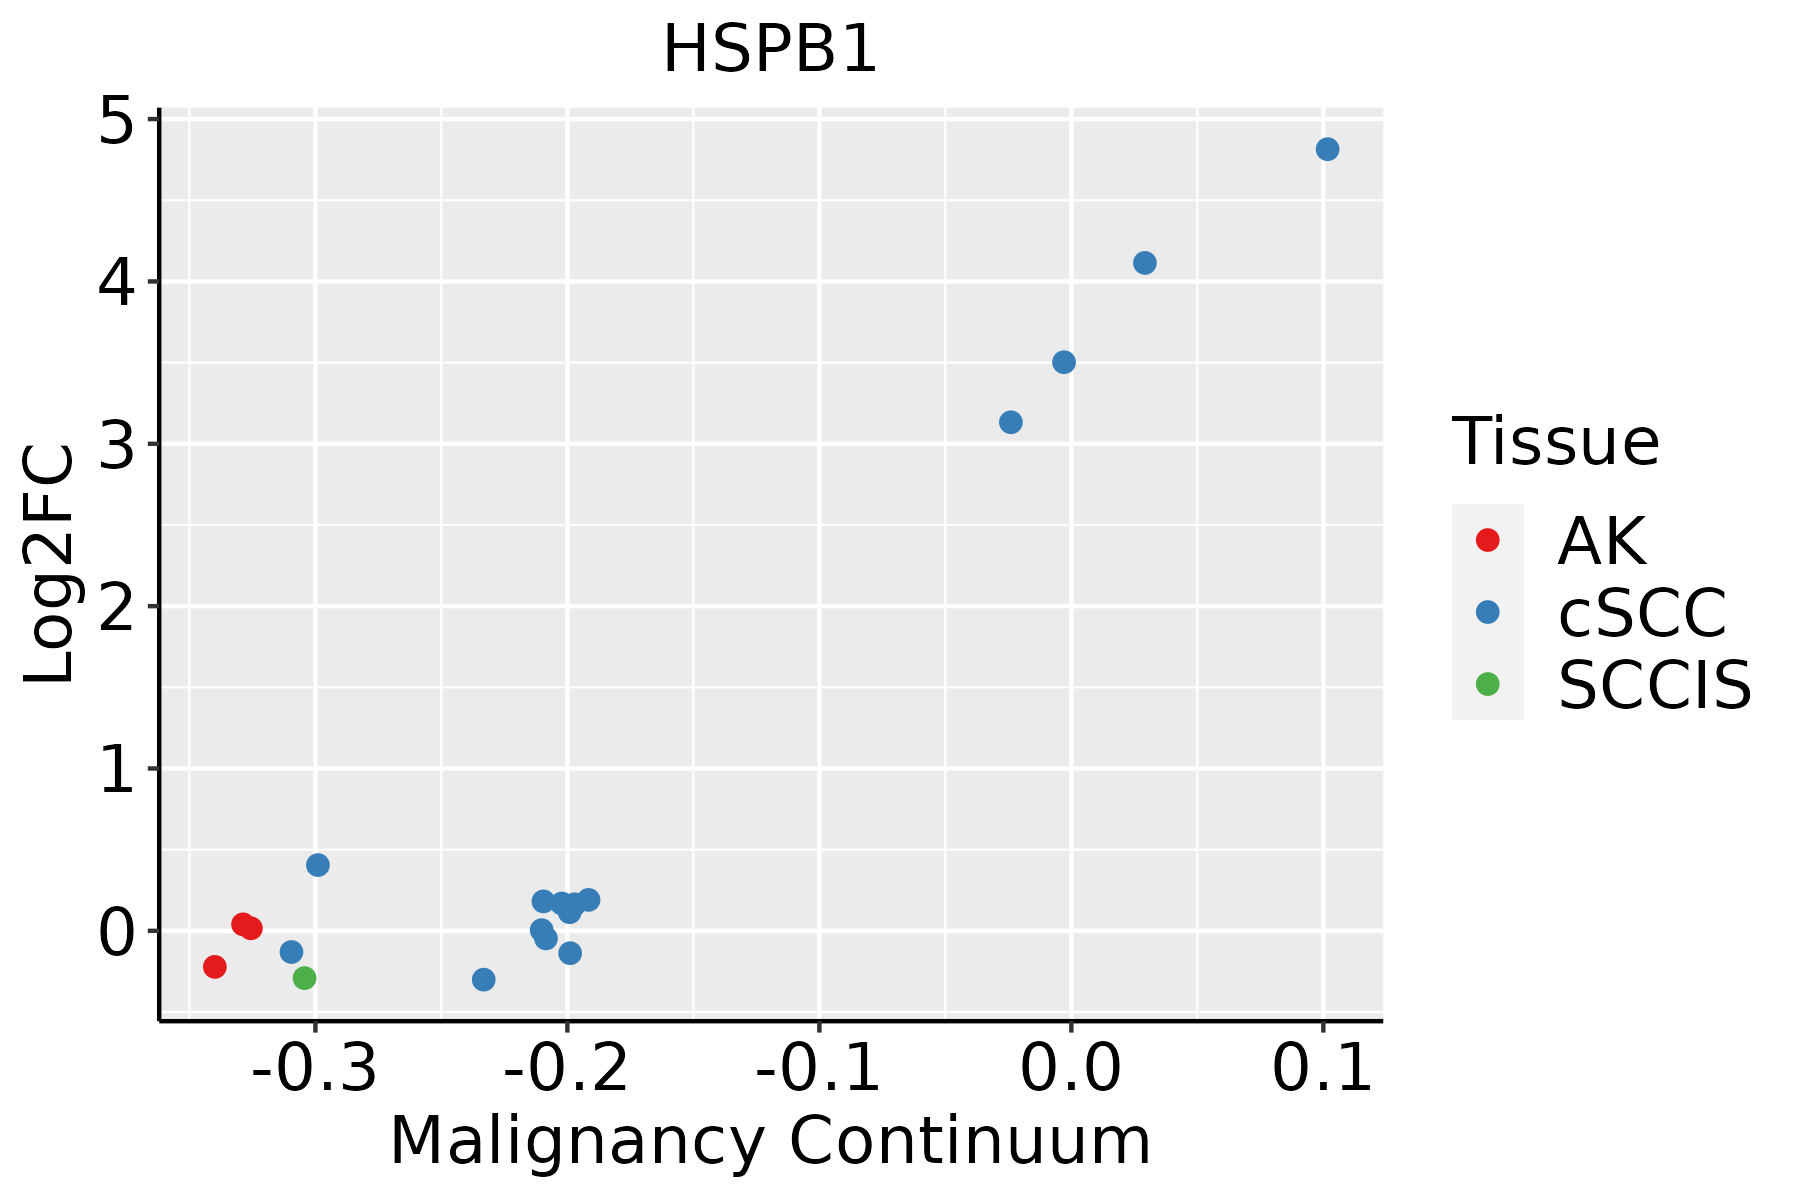 | AK: Actinic keratosis |
| cSCC: Cutaneous squamous cell carcinoma | ||
| SCCIS:squamous cell carcinoma in situ | ||
| Thyroid | 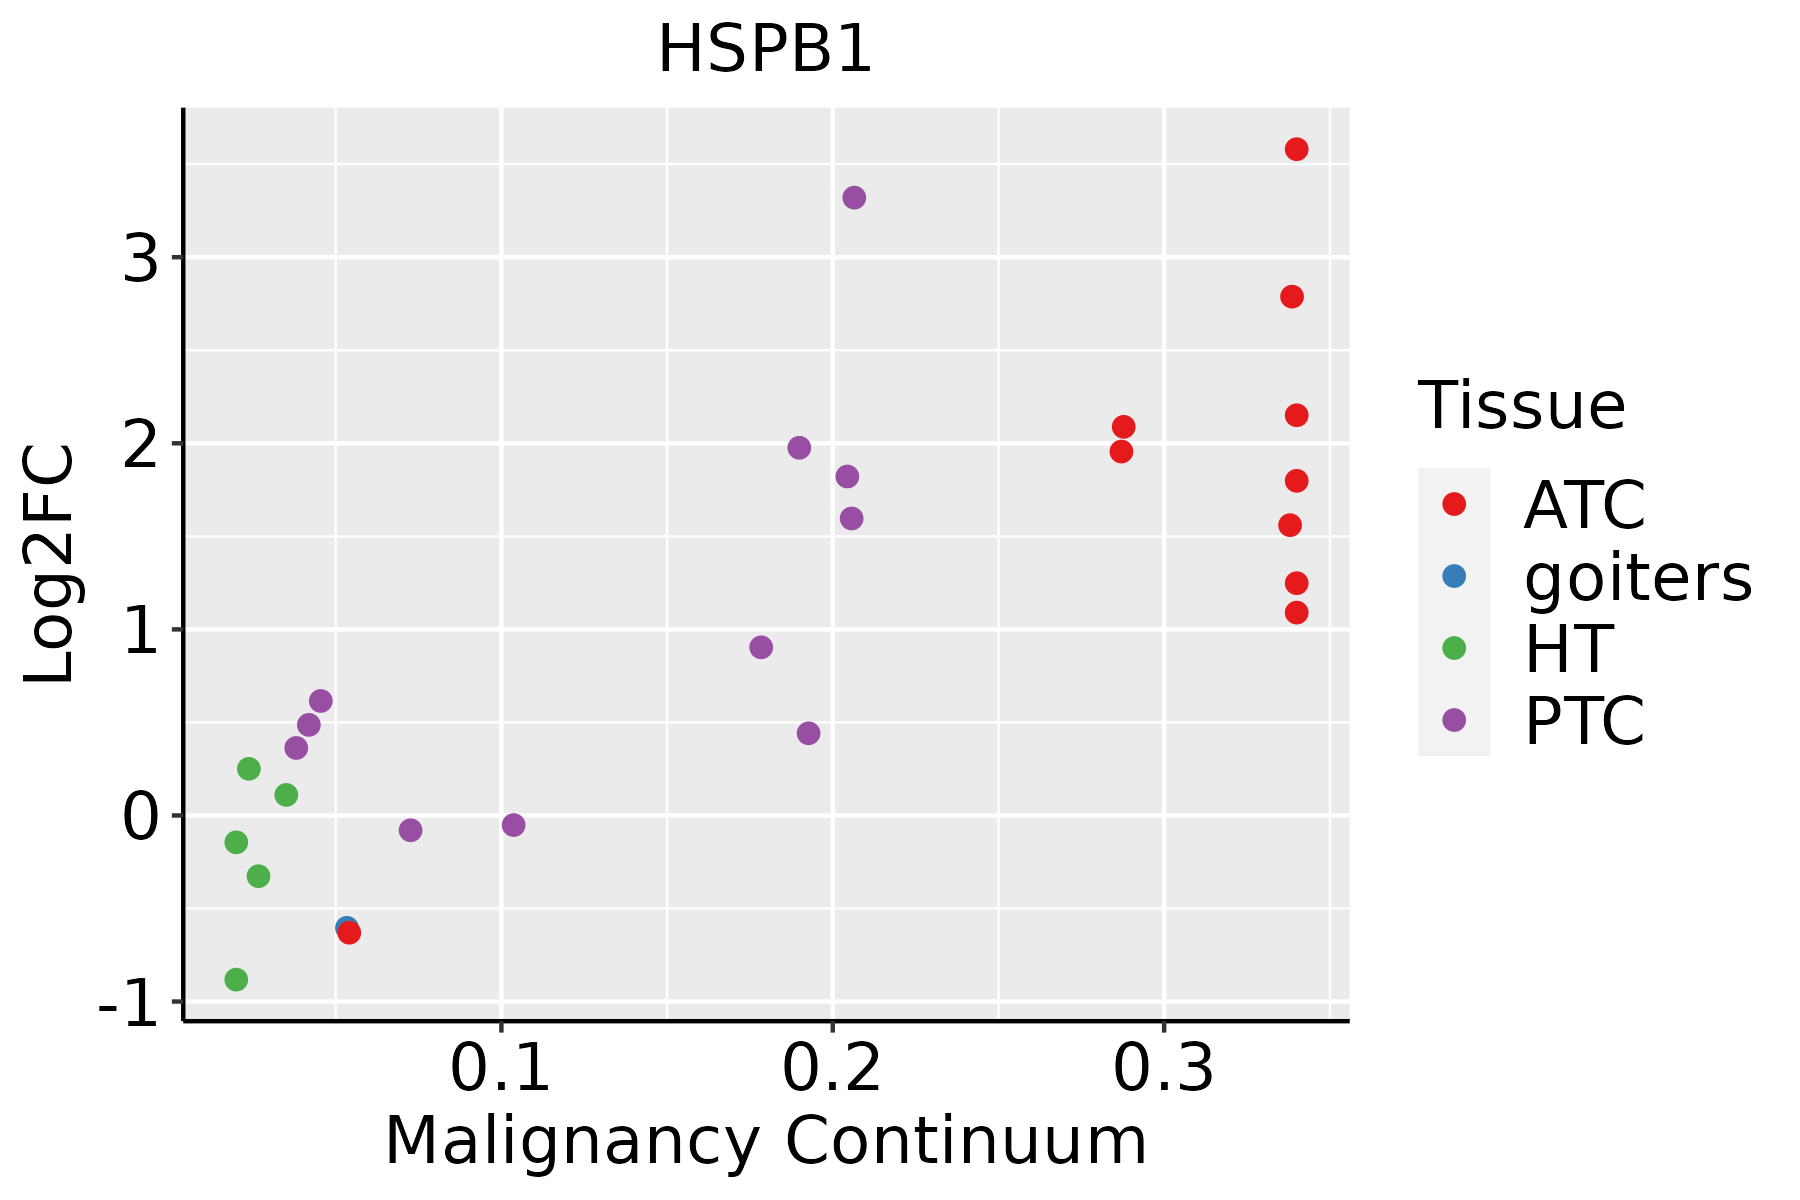 | ATC: Anaplastic thyroid cancer |
| HT: Hashimoto's thyroiditis | ||
| PTC: Papillary thyroid cancer |
| ∗log2FC in expression of this searched gene in stem-like cells from each diseased tissue sample relative to stem-like cells in normal samples in each tissue plotted against the malignancy continuum. Samples are colored based on if they are from different disease stage. |
Top |
Malignant transformation related pathway analysis |
| Find out the enriched GO biological processes and KEGG pathways involved in transition from healthy to precancer to cancer |
| Tissue | Disease Stage | Enriched GO biological Processes |
| Colorectum | AD |  |
| Colorectum | SER |  |
| Colorectum | MSS |  |
| Colorectum | MSI-H |  |
| Colorectum | FAP |  |
| ∗Top 15 enriched GO BP terms are showed in the bar plot of each disease state in each tissue. Each row represents a significant GO biological process which is colored according to the -log10(p.adjust). |
| Page: 1 2 3 4 5 6 7 8 9 |
| GO ID | Tissue | Disease Stage | Description | Gene Ratio | Bg Ratio | pvalue | p.adjust | Count |
| GO:00971939 | Breast | Precancer | intrinsic apoptotic signaling pathway | 59/1080 | 288/18723 | 8.07e-18 | 3.60e-15 | 59 |
| GO:20012339 | Breast | Precancer | regulation of apoptotic signaling pathway | 65/1080 | 356/18723 | 7.70e-17 | 3.17e-14 | 65 |
| GO:20012429 | Breast | Precancer | regulation of intrinsic apoptotic signaling pathway | 41/1080 | 164/18723 | 6.48e-16 | 2.31e-13 | 41 |
| GO:00069799 | Breast | Precancer | response to oxidative stress | 70/1080 | 446/18723 | 1.59e-14 | 4.26e-12 | 70 |
| GO:00064578 | Breast | Precancer | protein folding | 43/1080 | 212/18723 | 3.48e-13 | 7.45e-11 | 43 |
| GO:00064138 | Breast | Precancer | translational initiation | 30/1080 | 118/18723 | 3.23e-12 | 5.58e-10 | 30 |
| GO:00064179 | Breast | Precancer | regulation of translation | 67/1080 | 468/18723 | 4.71e-12 | 7.64e-10 | 67 |
| GO:00621979 | Breast | Precancer | cellular response to chemical stress | 51/1080 | 337/18723 | 2.40e-10 | 2.34e-08 | 51 |
| GO:20012349 | Breast | Precancer | negative regulation of apoptotic signaling pathway | 39/1080 | 224/18723 | 5.35e-10 | 4.77e-08 | 39 |
| GO:00069869 | Breast | Precancer | response to unfolded protein | 28/1080 | 137/18723 | 3.81e-09 | 3.00e-07 | 28 |
| GO:00610778 | Breast | Precancer | chaperone-mediated protein folding | 19/1080 | 67/18723 | 4.22e-09 | 3.28e-07 | 19 |
| GO:20012439 | Breast | Precancer | negative regulation of intrinsic apoptotic signaling pathway | 23/1080 | 98/18723 | 5.82e-09 | 4.45e-07 | 23 |
| GO:00345999 | Breast | Precancer | cellular response to oxidative stress | 42/1080 | 288/18723 | 2.78e-08 | 1.79e-06 | 42 |
| GO:00359669 | Breast | Precancer | response to topologically incorrect protein | 29/1080 | 159/18723 | 3.00e-08 | 1.89e-06 | 29 |
| GO:00064466 | Breast | Precancer | regulation of translational initiation | 19/1080 | 79/18723 | 7.99e-08 | 4.60e-06 | 19 |
| GO:19021758 | Breast | Precancer | regulation of oxidative stress-induced intrinsic apoptotic signaling pathway | 11/1080 | 29/18723 | 2.95e-07 | 1.44e-05 | 11 |
| GO:00603266 | Breast | Precancer | cell chemotaxis | 41/1080 | 310/18723 | 5.99e-07 | 2.55e-05 | 41 |
| GO:00341099 | Breast | Precancer | homotypic cell-cell adhesion | 18/1080 | 90/18723 | 3.15e-06 | 1.03e-04 | 18 |
| GO:19032019 | Breast | Precancer | regulation of oxidative stress-induced cell death | 16/1080 | 74/18723 | 3.80e-06 | 1.20e-04 | 16 |
| GO:00018196 | Breast | Precancer | positive regulation of cytokine production | 52/1080 | 467/18723 | 4.18e-06 | 1.29e-04 | 52 |
| Page: 1 2 3 4 5 6 7 8 9 10 11 12 13 14 15 16 17 18 19 20 21 22 23 24 25 26 27 28 29 30 31 32 33 34 35 36 37 38 39 40 41 42 43 44 45 46 47 48 49 50 51 52 53 54 55 56 57 58 59 60 61 62 63 64 65 66 67 68 69 70 71 72 73 74 75 76 77 78 79 80 81 82 83 84 85 86 87 88 89 90 91 92 93 94 95 96 97 98 99 100 101 102 103 |
| Pathway ID | Tissue | Disease Stage | Description | Gene Ratio | Bg Ratio | pvalue | p.adjust | qvalue | Count |
| hsa051465 | Cervix | CC | Amoebiasis | 29/1267 | 102/8465 | 3.31e-04 | 1.70e-03 | 1.01e-03 | 29 |
| hsa040109 | Cervix | CC | MAPK signaling pathway | 62/1267 | 302/8465 | 4.89e-03 | 1.67e-02 | 9.86e-03 | 62 |
| hsa0514612 | Cervix | CC | Amoebiasis | 29/1267 | 102/8465 | 3.31e-04 | 1.70e-03 | 1.01e-03 | 29 |
| hsa0401012 | Cervix | CC | MAPK signaling pathway | 62/1267 | 302/8465 | 4.89e-03 | 1.67e-02 | 9.86e-03 | 62 |
| hsa040102 | Colorectum | CRC | MAPK signaling pathway | 56/1091 | 302/8465 | 2.76e-03 | 1.77e-02 | 1.20e-02 | 56 |
| hsa040103 | Colorectum | CRC | MAPK signaling pathway | 56/1091 | 302/8465 | 2.76e-03 | 1.77e-02 | 1.20e-02 | 56 |
| hsa051466 | Endometrium | AEH | Amoebiasis | 29/1197 | 102/8465 | 1.22e-04 | 1.10e-03 | 8.06e-04 | 29 |
| hsa0514613 | Endometrium | AEH | Amoebiasis | 29/1197 | 102/8465 | 1.22e-04 | 1.10e-03 | 8.06e-04 | 29 |
| hsa0514622 | Endometrium | EEC | Amoebiasis | 28/1237 | 102/8465 | 5.23e-04 | 3.83e-03 | 2.85e-03 | 28 |
| hsa0514632 | Endometrium | EEC | Amoebiasis | 28/1237 | 102/8465 | 5.23e-04 | 3.83e-03 | 2.85e-03 | 28 |
| hsa040108 | Lung | IAC | MAPK signaling pathway | 62/1053 | 302/8465 | 3.54e-05 | 6.38e-04 | 4.24e-04 | 62 |
| hsa051464 | Lung | IAC | Amoebiasis | 23/1053 | 102/8465 | 2.99e-03 | 1.53e-02 | 1.02e-02 | 23 |
| hsa0401011 | Lung | IAC | MAPK signaling pathway | 62/1053 | 302/8465 | 3.54e-05 | 6.38e-04 | 4.24e-04 | 62 |
| hsa0514611 | Lung | IAC | Amoebiasis | 23/1053 | 102/8465 | 2.99e-03 | 1.53e-02 | 1.02e-02 | 23 |
| hsa0401021 | Lung | AIS | MAPK signaling pathway | 57/961 | 302/8465 | 6.41e-05 | 9.43e-04 | 6.03e-04 | 57 |
| hsa0514621 | Lung | AIS | Amoebiasis | 20/961 | 102/8465 | 9.86e-03 | 4.20e-02 | 2.69e-02 | 20 |
| hsa0401031 | Lung | AIS | MAPK signaling pathway | 57/961 | 302/8465 | 6.41e-05 | 9.43e-04 | 6.03e-04 | 57 |
| hsa0514631 | Lung | AIS | Amoebiasis | 20/961 | 102/8465 | 9.86e-03 | 4.20e-02 | 2.69e-02 | 20 |
| hsa040104 | Lung | AAH | MAPK signaling pathway | 27/348 | 302/8465 | 1.13e-04 | 6.32e-03 | 5.08e-03 | 27 |
| hsa040105 | Lung | AAH | MAPK signaling pathway | 27/348 | 302/8465 | 1.13e-04 | 6.32e-03 | 5.08e-03 | 27 |
| Page: 1 2 3 |
Top |
Cell-cell communication analysis |
| Identification of potential cell-cell interactions between two cell types and their ligand-receptor pairs for different disease states |
| Ligand | Receptor | LRpair | Pathway | Tissue | Disease Stage |
| Page: 1 |
Top |
Single-cell gene regulatory network inference analysis |
| Find out the significant the regulons (TFs) and the target genes of each regulon across cell types for different disease states |
| TF | Cell Type | Tissue | Disease Stage | Target Gene | RSS | Regulon Activity |
| ∗The dot plots of a searched regulon are shown for all cell subpopulations in each disease state of each tissue based on the regulon specific score inferred using pySCENIC and by calculating the average expression. |
| Page: 1 |
Top |
Somatic mutation of malignant transformation related genes |
| Annotation of somatic variants for genes involved in malignant transformation |
| Hugo Symbol | Variant Class | Variant Classification | dbSNP RS | HGVSc | HGVSp | HGVSp Short | SWISSPROT | BIOTYPE | SIFT | PolyPhen | Tumor Sample Barcode | Tissue | Histology | Sex | Age | Stage | Therapy Types | Drugs | Outcome |
| HSPB1 | SNV | Missense_Mutation | novel | c.503N>A | p.Pro168His | p.P168H | P04792 | protein_coding | deleterious(0) | probably_damaging(0.998) | TCGA-A7-A0DB-01 | Breast | breast invasive carcinoma | Female | <65 | I/II | Hormone Therapy | arimidex | SD |
| HSPB1 | SNV | Missense_Mutation | novel | c.513G>T | p.Lys171Asn | p.K171N | P04792 | protein_coding | tolerated(0.06) | benign(0.223) | TCGA-E6-A2P9-01 | Endometrium | uterine corpus endometrioid carcinoma | Female | >=65 | I/II | Unknown | Unknown | SD |
| HSPB1 | SNV | Missense_Mutation | novel | c.574N>T | p.Gly192Trp | p.G192W | P04792 | protein_coding | deleterious(0) | probably_damaging(0.995) | TCGA-55-1595-01 | Lung | lung adenocarcinoma | Female | >=65 | I/II | Unknown | Unknown | SD |
| HSPB1 | SNV | Missense_Mutation | novel | c.413N>G | p.Phe138Cys | p.F138C | P04792 | protein_coding | deleterious(0) | probably_damaging(0.986) | TCGA-NC-A5HR-01 | Lung | lung squamous cell carcinoma | Female | >=65 | I/II | Chemotherapy | carboplatin | CR |
| HSPB1 | insertion | Frame_Shift_Ins | rs747325717 | c.432_433insC | p.Gly147ArgfsTer14 | p.G147Rfs*14 | P04792 | protein_coding | TCGA-CD-A4MG-01 | Stomach | stomach adenocarcinoma | Male | >=65 | I/II | Unknown | Unknown | PD |
| Page: 1 |
Top |
Related drugs of malignant transformation related genes |
| Identification of chemicals and drugs interact with genes involved in malignant transfromation |
| (DGIdb 4.0) |
| Entrez ID | Symbol | Category | Interaction Types | Drug Claim Name | Drug Name | PMIDs |
| 3315 | HSPB1 | DRUGGABLE GENOME | DIFFERENTIATION AGENTS | 8065161 | ||
| 3315 | HSPB1 | DRUGGABLE GENOME | TRIAMTERENE | TRIAMTERENE | ||
| 3315 | HSPB1 | DRUGGABLE GENOME | UREA | UREA | 9094264 | |
| 3315 | HSPB1 | DRUGGABLE GENOME | QUERCETIN | QUERCETIN | 19296652 | |
| 3315 | HSPB1 | DRUGGABLE GENOME | TYROSINE KINASE INHIBITOR | 8875961 | ||
| 3315 | HSPB1 | DRUGGABLE GENOME | inhibitor | OGX-427 | APATORSEN | |
| 3315 | HSPB1 | DRUGGABLE GENOME | PHENANTHROLINE | PHENANTHROLINE | ||
| 3315 | HSPB1 | DRUGGABLE GENOME | DIFFERENTIATION INDUCER | 7500647 | ||
| 3315 | HSPB1 | DRUGGABLE GENOME | DICARBONODITHIOIMIDIC DIAMIDE | DICARBONODITHIOIMIDIC DIAMIDE | ||
| 3315 | HSPB1 | DRUGGABLE GENOME | BENZENETHIOL | BENZENETHIOL |
| Page: 1 2 3 4 |

Copyright 2023-Present -The University of Texas Health Science Center at Houston |