
|
|||||
|
 | |
| |
| |
| |
| |
| |
|
Gene: HSPA9 |
Gene summary for HSPA9 |
| Gene information | Species | Human | Gene symbol | HSPA9 | Gene ID | 3313 |
| Gene name | heat shock protein family A (Hsp70) member 9 | |
| Gene Alias | CRP40 | |
| Cytomap | 5q31.2 | |
| Gene Type | protein-coding | GO ID | GO:0002244 | UniProtAcc | P38646 |
Top |
Malignant transformation analysis |
| Identification of the aberrant gene expression in precancerous and cancerous lesions by comparing the gene expression of stem-like cells in diseased tissues with normal stem cells |
| Entrez ID | Symbol | Replicates | Species | Organ | Tissue | Adj P-value | Log2FC | Malignancy |
| 3313 | HSPA9 | HTA11_1938_2000001011 | Human | Colorectum | AD | 1.30e-04 | 4.08e-01 | -0.0811 |
| 3313 | HSPA9 | HTA11_78_2000001011 | Human | Colorectum | AD | 1.09e-09 | 5.95e-01 | -0.1088 |
| 3313 | HSPA9 | HTA11_347_2000001011 | Human | Colorectum | AD | 2.81e-16 | 6.42e-01 | -0.1954 |
| 3313 | HSPA9 | HTA11_6801_2000001011 | Human | Colorectum | SER | 3.38e-08 | 9.59e-01 | 0.0171 |
| 3313 | HSPA9 | HTA11_99999970781_79442 | Human | Colorectum | MSS | 1.01e-10 | 5.96e-01 | 0.294 |
| 3313 | HSPA9 | HTA11_99999965104_69814 | Human | Colorectum | MSS | 2.46e-09 | 6.55e-01 | 0.281 |
| 3313 | HSPA9 | HTA11_99999971662_82457 | Human | Colorectum | MSS | 1.25e-13 | 7.22e-01 | 0.3859 |
| 3313 | HSPA9 | A015-C-203 | Human | Colorectum | FAP | 2.45e-08 | -1.50e-01 | -0.1294 |
| 3313 | HSPA9 | A001-C-108 | Human | Colorectum | FAP | 6.53e-04 | -1.04e-01 | -0.0272 |
| 3313 | HSPA9 | A002-C-205 | Human | Colorectum | FAP | 4.05e-06 | -1.99e-01 | -0.1236 |
| 3313 | HSPA9 | A015-C-006 | Human | Colorectum | FAP | 3.56e-03 | -9.94e-03 | -0.0994 |
| 3313 | HSPA9 | A002-C-114 | Human | Colorectum | FAP | 2.01e-04 | -1.75e-01 | -0.1561 |
| 3313 | HSPA9 | A015-C-104 | Human | Colorectum | FAP | 3.68e-12 | -3.30e-02 | -0.1899 |
| 3313 | HSPA9 | A002-C-016 | Human | Colorectum | FAP | 1.44e-06 | -9.43e-03 | 0.0521 |
| 3313 | HSPA9 | A002-C-116 | Human | Colorectum | FAP | 3.21e-10 | -1.86e-01 | -0.0452 |
| 3313 | HSPA9 | A018-E-020 | Human | Colorectum | FAP | 2.31e-06 | -2.43e-01 | -0.2034 |
| 3313 | HSPA9 | F034 | Human | Colorectum | FAP | 1.40e-04 | -6.91e-02 | -0.0665 |
| 3313 | HSPA9 | AEH-subject1 | Human | Endometrium | AEH | 1.93e-06 | 1.80e-02 | -0.3059 |
| 3313 | HSPA9 | AEH-subject2 | Human | Endometrium | AEH | 4.92e-03 | -1.32e-01 | -0.2525 |
| 3313 | HSPA9 | AEH-subject3 | Human | Endometrium | AEH | 1.79e-04 | -9.88e-02 | -0.2576 |
| Page: 1 2 3 4 5 6 7 8 9 10 |
| Tissue | Expression Dynamics | Abbreviation |
| Colorectum (GSE201348) |  | FAP: Familial adenomatous polyposis |
| CRC: Colorectal cancer | ||
| Colorectum (HTA11) |  | AD: Adenomas |
| SER: Sessile serrated lesions | ||
| MSI-H: Microsatellite-high colorectal cancer | ||
| MSS: Microsatellite stable colorectal cancer | ||
| Endometrium |  | AEH: Atypical endometrial hyperplasia |
| EEC: Endometrioid Cancer | ||
| Esophagus |  | ESCC: Esophageal squamous cell carcinoma |
| HGIN: High-grade intraepithelial neoplasias | ||
| LGIN: Low-grade intraepithelial neoplasias | ||
| Liver |  | HCC: Hepatocellular carcinoma |
| NAFLD: Non-alcoholic fatty liver disease | ||
| Oral Cavity |  | EOLP: Erosive Oral lichen planus |
| LP: leukoplakia | ||
| NEOLP: Non-erosive oral lichen planus | ||
| OSCC: Oral squamous cell carcinoma | ||
| Prostate | 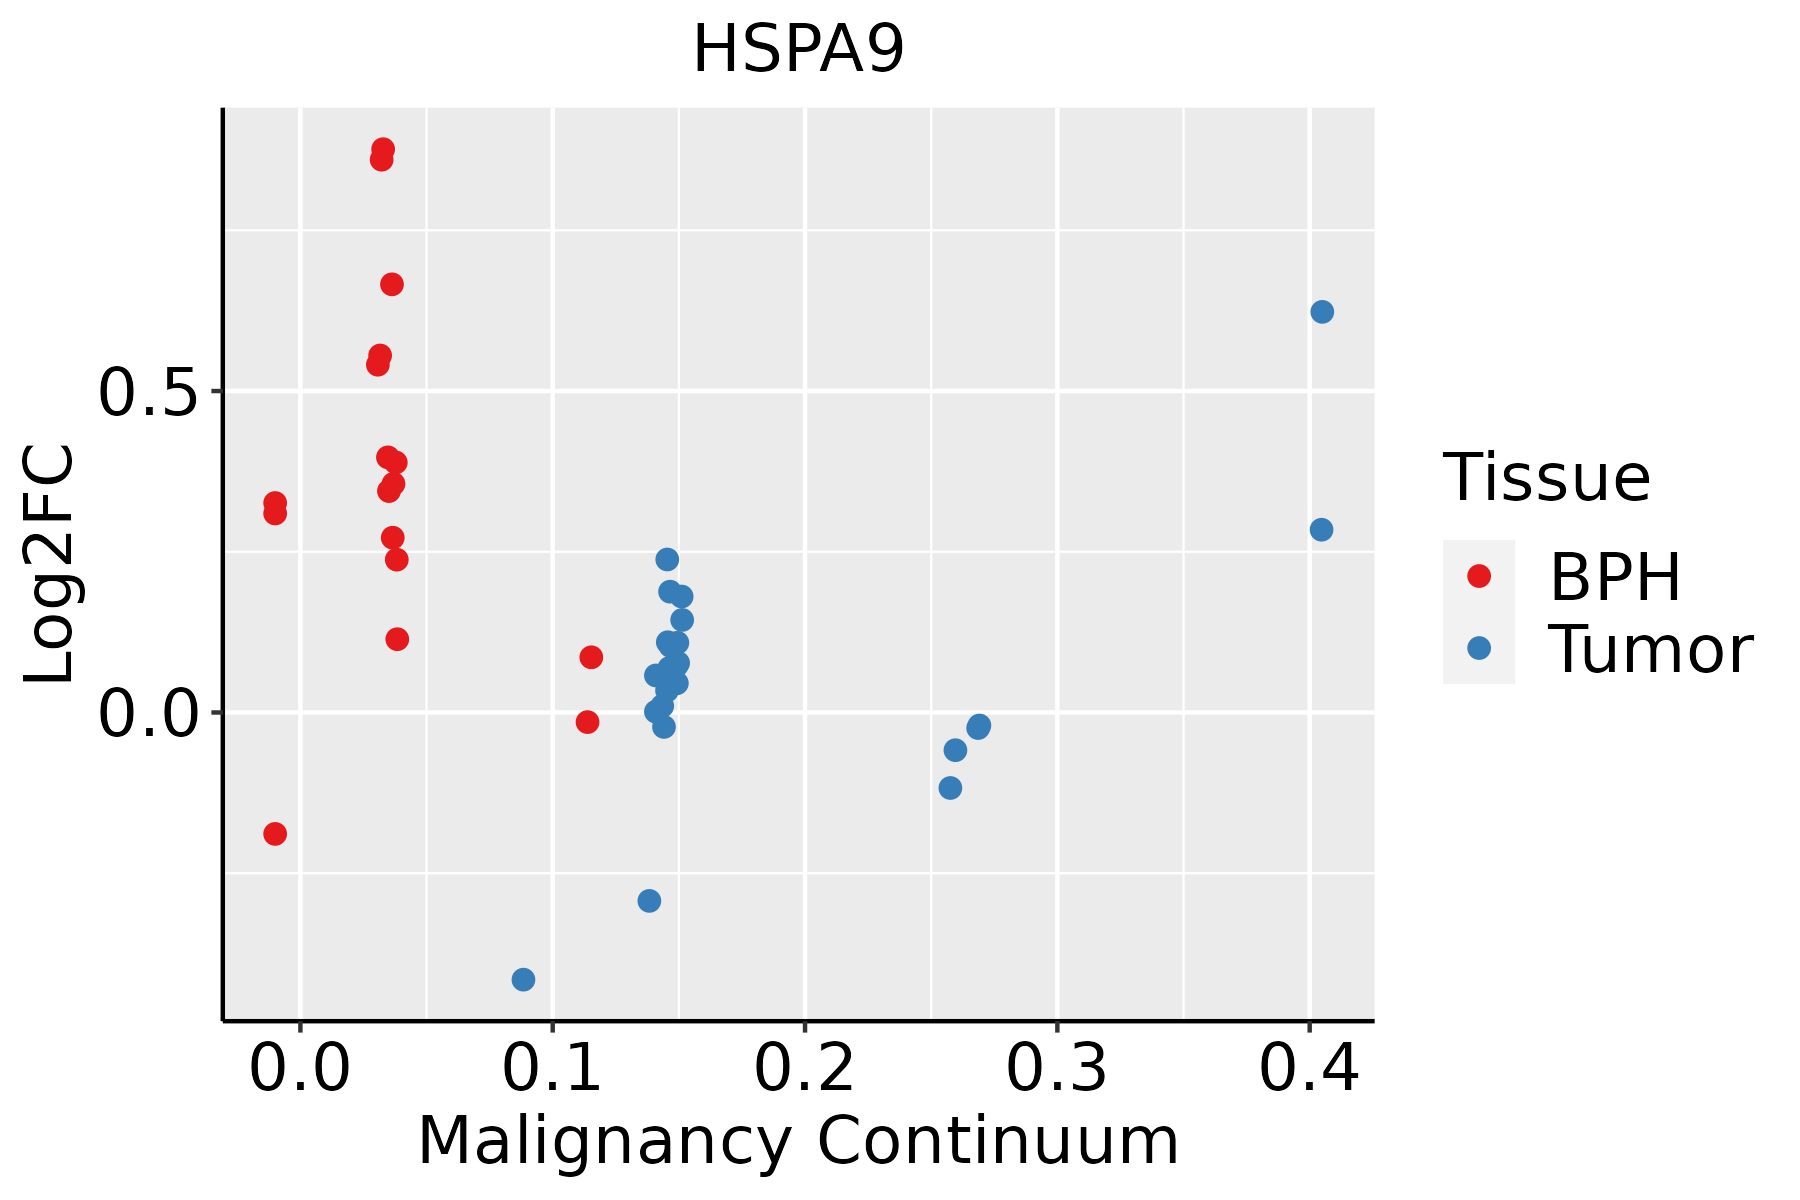 | BPH: Benign Prostatic Hyperplasia |
| Skin | 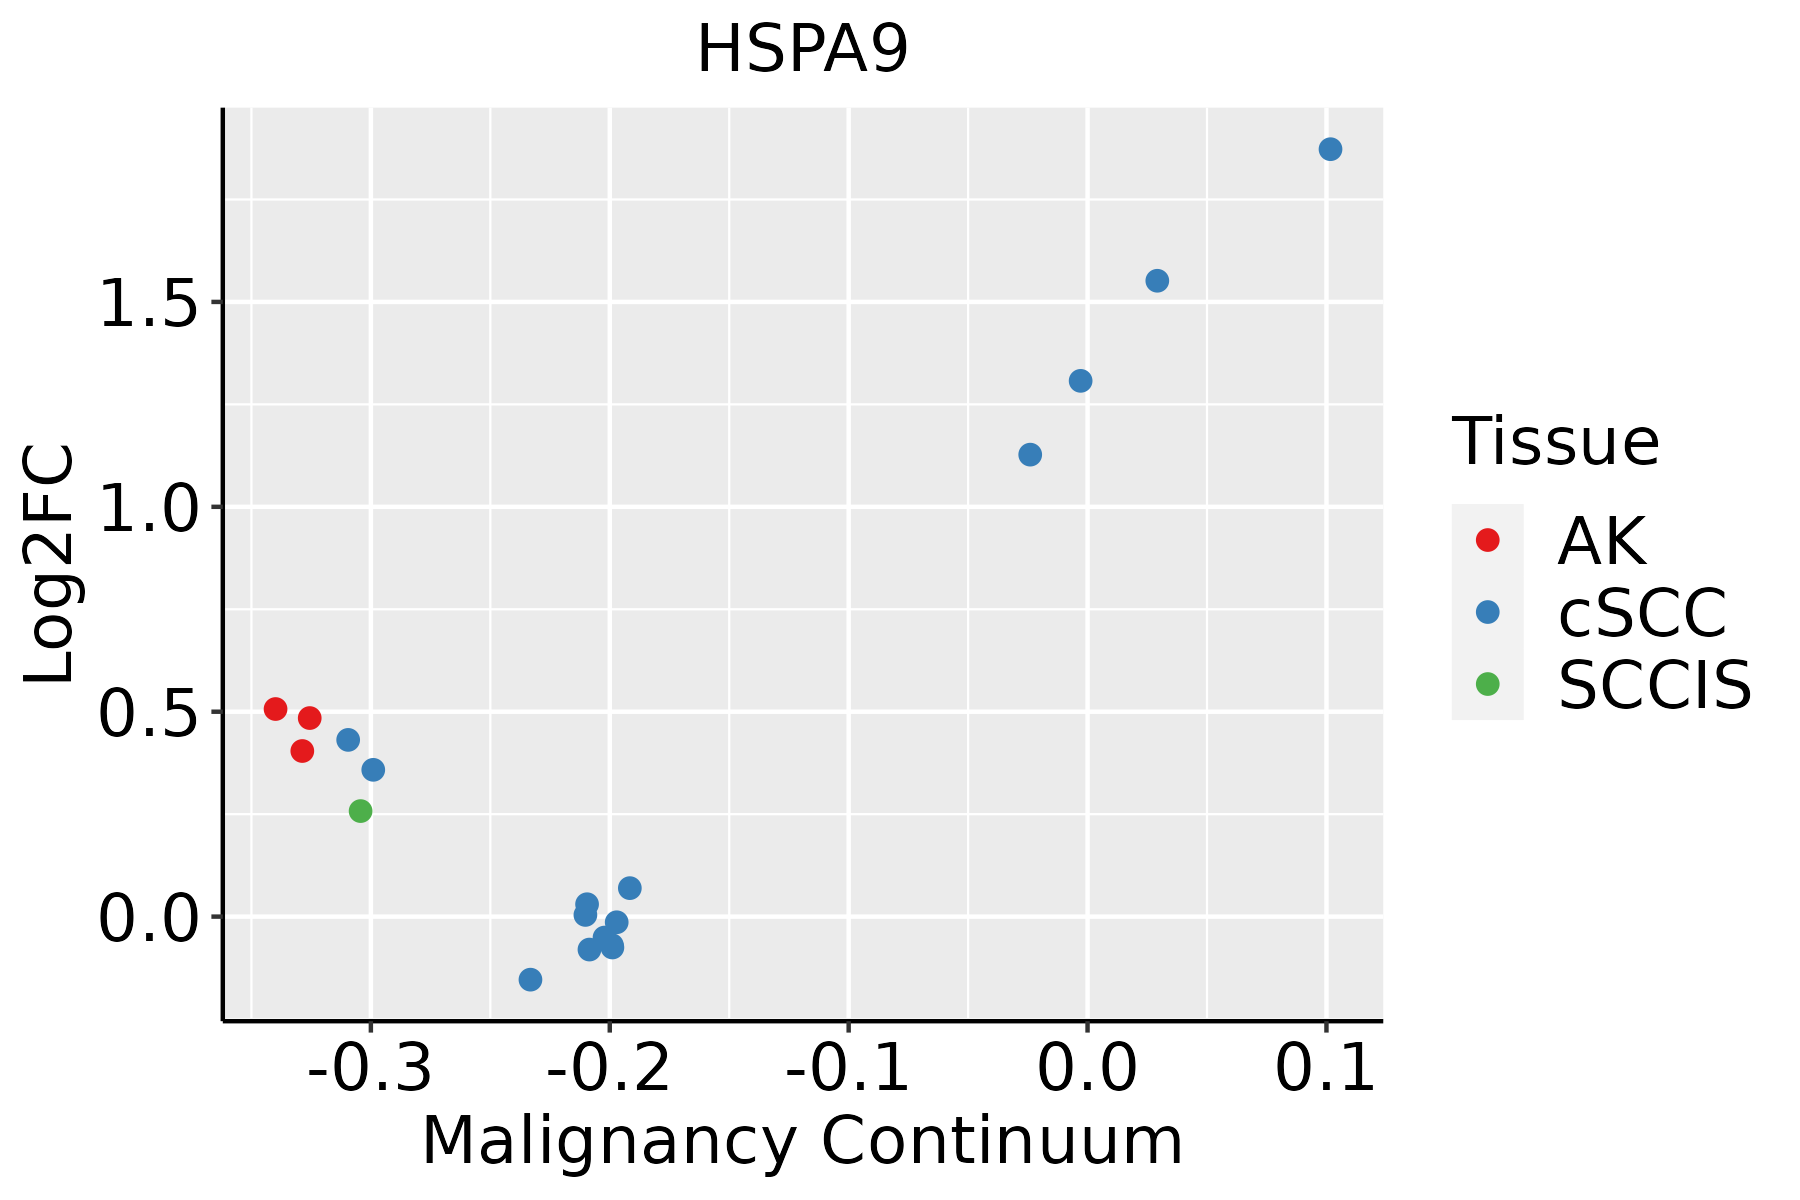 | AK: Actinic keratosis |
| cSCC: Cutaneous squamous cell carcinoma | ||
| SCCIS:squamous cell carcinoma in situ | ||
| Thyroid |  | ATC: Anaplastic thyroid cancer |
| HT: Hashimoto's thyroiditis | ||
| PTC: Papillary thyroid cancer |
| ∗log2FC in expression of this searched gene in stem-like cells from each diseased tissue sample relative to stem-like cells in normal samples in each tissue plotted against the malignancy continuum. Samples are colored based on if they are from different disease stage. |
Top |
Malignant transformation related pathway analysis |
| Find out the enriched GO biological processes and KEGG pathways involved in transition from healthy to precancer to cancer |
| Tissue | Disease Stage | Enriched GO biological Processes |
| Colorectum | AD |  |
| Colorectum | SER |  |
| Colorectum | MSS |  |
| Colorectum | MSI-H |  |
| Colorectum | FAP |  |
| ∗Top 15 enriched GO BP terms are showed in the bar plot of each disease state in each tissue. Each row represents a significant GO biological process which is colored according to the -log10(p.adjust). |
| Page: 1 2 3 4 5 6 7 8 9 |
| GO ID | Tissue | Disease Stage | Description | Gene Ratio | Bg Ratio | pvalue | p.adjust | Count |
| GO:0006913 | Colorectum | AD | nucleocytoplasmic transport | 102/3918 | 301/18723 | 1.00e-07 | 4.85e-06 | 102 |
| GO:0051169 | Colorectum | AD | nuclear transport | 102/3918 | 301/18723 | 1.00e-07 | 4.85e-06 | 102 |
| GO:0007006 | Colorectum | AD | mitochondrial membrane organization | 48/3918 | 116/18723 | 4.53e-07 | 1.72e-05 | 48 |
| GO:0034101 | Colorectum | AD | erythrocyte homeostasis | 51/3918 | 129/18723 | 1.07e-06 | 3.59e-05 | 51 |
| GO:0030099 | Colorectum | AD | myeloid cell differentiation | 119/3918 | 381/18723 | 1.24e-06 | 4.01e-05 | 119 |
| GO:0006457 | Colorectum | AD | protein folding | 73/3918 | 212/18723 | 3.24e-06 | 9.10e-05 | 73 |
| GO:0002262 | Colorectum | AD | myeloid cell homeostasis | 57/3918 | 157/18723 | 6.17e-06 | 1.56e-04 | 57 |
| GO:0048872 | Colorectum | AD | homeostasis of number of cells | 87/3918 | 272/18723 | 1.16e-05 | 2.61e-04 | 87 |
| GO:0030218 | Colorectum | AD | erythrocyte differentiation | 45/3918 | 120/18723 | 2.22e-05 | 4.39e-04 | 45 |
| GO:0006790 | Colorectum | AD | sulfur compound metabolic process | 101/3918 | 339/18723 | 6.46e-05 | 1.07e-03 | 101 |
| GO:0051168 | Colorectum | AD | nuclear export | 53/3918 | 154/18723 | 6.89e-05 | 1.11e-03 | 53 |
| GO:0035966 | Colorectum | AD | response to topologically incorrect protein | 54/3918 | 159/18723 | 8.85e-05 | 1.36e-03 | 54 |
| GO:0035967 | Colorectum | AD | cellular response to topologically incorrect protein | 42/3918 | 116/18723 | 1.04e-04 | 1.56e-03 | 42 |
| GO:0006458 | Colorectum | AD | 'de novo' protein folding | 20/3918 | 43/18723 | 1.53e-04 | 2.16e-03 | 20 |
| GO:0007007 | Colorectum | AD | inner mitochondrial membrane organization | 18/3918 | 38/18723 | 2.45e-04 | 3.09e-03 | 18 |
| GO:0051084 | Colorectum | AD | 'de novo' posttranslational protein folding | 18/3918 | 39/18723 | 3.66e-04 | 4.24e-03 | 18 |
| GO:0061077 | Colorectum | AD | chaperone-mediated protein folding | 26/3918 | 67/18723 | 6.20e-04 | 6.48e-03 | 26 |
| GO:0045646 | Colorectum | AD | regulation of erythrocyte differentiation | 20/3918 | 47/18723 | 6.54e-04 | 6.75e-03 | 20 |
| GO:0006611 | Colorectum | AD | protein export from nucleus | 23/3918 | 57/18723 | 6.62e-04 | 6.80e-03 | 23 |
| GO:0006986 | Colorectum | AD | response to unfolded protein | 45/3918 | 137/18723 | 7.43e-04 | 7.48e-03 | 45 |
| Page: 1 2 3 4 5 6 7 8 9 10 11 12 13 14 15 16 17 18 19 20 21 22 23 24 25 26 27 28 29 |
| Pathway ID | Tissue | Disease Stage | Description | Gene Ratio | Bg Ratio | pvalue | p.adjust | qvalue | Count |
| hsa030187 | Endometrium | EEC | RNA degradation | 20/1237 | 79/8465 | 8.36e-03 | 3.88e-02 | 2.89e-02 | 20 |
| hsa0301812 | Endometrium | EEC | RNA degradation | 20/1237 | 79/8465 | 8.36e-03 | 3.88e-02 | 2.89e-02 | 20 |
| hsa0301810 | Esophagus | HGIN | RNA degradation | 27/1383 | 79/8465 | 7.73e-05 | 9.00e-04 | 7.15e-04 | 27 |
| hsa0301815 | Esophagus | HGIN | RNA degradation | 27/1383 | 79/8465 | 7.73e-05 | 9.00e-04 | 7.15e-04 | 27 |
| hsa0301824 | Esophagus | ESCC | RNA degradation | 62/4205 | 79/8465 | 1.18e-07 | 9.39e-07 | 4.81e-07 | 62 |
| hsa051527 | Esophagus | ESCC | Tuberculosis | 111/4205 | 180/8465 | 7.14e-04 | 2.32e-03 | 1.19e-03 | 111 |
| hsa0301834 | Esophagus | ESCC | RNA degradation | 62/4205 | 79/8465 | 1.18e-07 | 9.39e-07 | 4.81e-07 | 62 |
| hsa0515212 | Esophagus | ESCC | Tuberculosis | 111/4205 | 180/8465 | 7.14e-04 | 2.32e-03 | 1.19e-03 | 111 |
| hsa03018 | Liver | Cirrhotic | RNA degradation | 44/2530 | 79/8465 | 1.43e-06 | 1.65e-05 | 1.02e-05 | 44 |
| hsa030181 | Liver | Cirrhotic | RNA degradation | 44/2530 | 79/8465 | 1.43e-06 | 1.65e-05 | 1.02e-05 | 44 |
| hsa030182 | Liver | HCC | RNA degradation | 58/4020 | 79/8465 | 2.29e-06 | 2.19e-05 | 1.22e-05 | 58 |
| hsa030183 | Liver | HCC | RNA degradation | 58/4020 | 79/8465 | 2.29e-06 | 2.19e-05 | 1.22e-05 | 58 |
| hsa030189 | Oral cavity | OSCC | RNA degradation | 59/3704 | 79/8465 | 2.05e-08 | 1.91e-07 | 9.70e-08 | 59 |
| hsa051526 | Oral cavity | OSCC | Tuberculosis | 105/3704 | 180/8465 | 5.00e-05 | 2.04e-04 | 1.04e-04 | 105 |
| hsa0301814 | Oral cavity | OSCC | RNA degradation | 59/3704 | 79/8465 | 2.05e-08 | 1.91e-07 | 9.70e-08 | 59 |
| hsa0515211 | Oral cavity | OSCC | Tuberculosis | 105/3704 | 180/8465 | 5.00e-05 | 2.04e-04 | 1.04e-04 | 105 |
| hsa0301823 | Oral cavity | LP | RNA degradation | 39/2418 | 79/8465 | 6.98e-05 | 4.38e-04 | 2.83e-04 | 39 |
| hsa0515221 | Oral cavity | LP | Tuberculosis | 65/2418 | 180/8465 | 1.60e-02 | 4.92e-02 | 3.17e-02 | 65 |
| hsa0301833 | Oral cavity | LP | RNA degradation | 39/2418 | 79/8465 | 6.98e-05 | 4.38e-04 | 2.83e-04 | 39 |
| hsa0515231 | Oral cavity | LP | Tuberculosis | 65/2418 | 180/8465 | 1.60e-02 | 4.92e-02 | 3.17e-02 | 65 |
| Page: 1 2 |
Top |
Cell-cell communication analysis |
| Identification of potential cell-cell interactions between two cell types and their ligand-receptor pairs for different disease states |
| Ligand | Receptor | LRpair | Pathway | Tissue | Disease Stage |
| Page: 1 |
Top |
Single-cell gene regulatory network inference analysis |
| Find out the significant the regulons (TFs) and the target genes of each regulon across cell types for different disease states |
| TF | Cell Type | Tissue | Disease Stage | Target Gene | RSS | Regulon Activity |
| ∗The dot plots of a searched regulon are shown for all cell subpopulations in each disease state of each tissue based on the regulon specific score inferred using pySCENIC and by calculating the average expression. |
| Page: 1 |
Top |
Somatic mutation of malignant transformation related genes |
| Annotation of somatic variants for genes involved in malignant transformation |
| Hugo Symbol | Variant Class | Variant Classification | dbSNP RS | HGVSc | HGVSp | HGVSp Short | SWISSPROT | BIOTYPE | SIFT | PolyPhen | Tumor Sample Barcode | Tissue | Histology | Sex | Age | Stage | Therapy Types | Drugs | Outcome |
| HSPA9 | SNV | Missense_Mutation | novel | c.224N>A | p.Ala75Glu | p.A75E | P38646 | protein_coding | deleterious_low_confidence(0) | probably_damaging(0.948) | TCGA-A7-A3IZ-01 | Breast | breast invasive carcinoma | Female | <65 | I/II | Chemotherapy | cytoxan | SD |
| HSPA9 | SNV | Missense_Mutation | c.962N>T | p.Ser321Leu | p.S321L | P38646 | protein_coding | deleterious_low_confidence(0) | probably_damaging(0.988) | TCGA-AC-A23H-01 | Breast | breast invasive carcinoma | Female | >=65 | I/II | Unknown | Unknown | PD | |
| HSPA9 | SNV | Missense_Mutation | c.1918C>G | p.Leu640Val | p.L640V | P38646 | protein_coding | tolerated_low_confidence(0.06) | benign(0.106) | TCGA-B6-A0WW-01 | Breast | breast invasive carcinoma | Female | <65 | I/II | Unknown | Unknown | PD | |
| HSPA9 | SNV | Missense_Mutation | c.495G>C | p.Gln165His | p.Q165H | P38646 | protein_coding | deleterious_low_confidence(0) | probably_damaging(0.999) | TCGA-DG-A2KM-01 | Cervix | cervical & endocervical cancer | Female | <65 | I/II | Chemotherapy | cisplatin | SD | |
| HSPA9 | SNV | Missense_Mutation | c.1174A>G | p.Met392Val | p.M392V | P38646 | protein_coding | tolerated_low_confidence(0.09) | benign(0.144) | TCGA-AA-3864-01 | Colorectum | colon adenocarcinoma | Male | >=65 | I/II | Unknown | Unknown | SD | |
| HSPA9 | SNV | Missense_Mutation | novel | c.1288N>A | p.Gly430Ser | p.G430S | P38646 | protein_coding | deleterious_low_confidence(0) | probably_damaging(0.996) | TCGA-AA-3877-01 | Colorectum | colon adenocarcinoma | Female | >=65 | I/II | Unknown | Unknown | SD |
| HSPA9 | SNV | Missense_Mutation | novel | c.1969N>C | p.Ser657Pro | p.S657P | P38646 | protein_coding | deleterious_low_confidence(0.04) | probably_damaging(0.91) | TCGA-AA-3947-01 | Colorectum | colon adenocarcinoma | Female | <65 | I/II | Unknown | Unknown | SD |
| HSPA9 | SNV | Missense_Mutation | c.1665A>C | p.Lys555Asn | p.K555N | P38646 | protein_coding | tolerated_low_confidence(0.06) | possibly_damaging(0.495) | TCGA-AA-3966-01 | Colorectum | colon adenocarcinoma | Female | >=65 | I/II | Unknown | Unknown | SD | |
| HSPA9 | SNV | Missense_Mutation | rs776644009 | c.850C>T | p.Arg284Trp | p.R284W | P38646 | protein_coding | tolerated_low_confidence(0.07) | benign(0.009) | TCGA-AA-A01R-01 | Colorectum | colon adenocarcinoma | Male | <65 | III/IV | Chemotherapy | 5-fluorouracil | PD |
| HSPA9 | SNV | Missense_Mutation | c.701A>C | p.Lys234Thr | p.K234T | P38646 | protein_coding | deleterious_low_confidence(0.01) | probably_damaging(0.932) | TCGA-CA-6718-01 | Colorectum | colon adenocarcinoma | Male | <65 | I/II | Unknown | Unknown | PD |
| Page: 1 2 3 4 5 |
Top |
Related drugs of malignant transformation related genes |
| Identification of chemicals and drugs interact with genes involved in malignant transfromation |
| (DGIdb 4.0) |
| Entrez ID | Symbol | Category | Interaction Types | Drug Claim Name | Drug Name | PMIDs |
| 3313 | HSPA9 | NA | MKT-077 | CHEMBL33859 | ||
| 3313 | HSPA9 | NA | MKT-077 | CHEMBL33859 | 11156371 |
| Page: 1 |

Copyright 2023-Present -The University of Texas Health Science Center at Houston |