
|
|||||
|
 | |
| |
| |
| |
| |
| |
|
Gene: HSPA4L |
Gene summary for HSPA4L |
| Gene information | Species | Human | Gene symbol | HSPA4L | Gene ID | 22824 |
| Gene name | heat shock protein family A (Hsp70) member 4 like | |
| Gene Alias | APG-1 | |
| Cytomap | 4q28.1 | |
| Gene Type | protein-coding | GO ID | GO:0006457 | UniProtAcc | B4DZR0 |
Top |
Malignant transformation analysis |
| Identification of the aberrant gene expression in precancerous and cancerous lesions by comparing the gene expression of stem-like cells in diseased tissues with normal stem cells |
| Entrez ID | Symbol | Replicates | Species | Organ | Tissue | Adj P-value | Log2FC | Malignancy |
| 22824 | HSPA4L | LZE4T | Human | Esophagus | ESCC | 8.88e-13 | 3.65e-01 | 0.0811 |
| 22824 | HSPA4L | LZE8T | Human | Esophagus | ESCC | 2.03e-07 | 1.98e-04 | 0.067 |
| 22824 | HSPA4L | LZE24T | Human | Esophagus | ESCC | 1.26e-02 | -1.58e-01 | 0.0596 |
| 22824 | HSPA4L | P1T-E | Human | Esophagus | ESCC | 7.24e-04 | 1.41e-01 | 0.0875 |
| 22824 | HSPA4L | P2T-E | Human | Esophagus | ESCC | 4.97e-42 | 9.78e-01 | 0.1177 |
| 22824 | HSPA4L | P4T-E | Human | Esophagus | ESCC | 7.47e-15 | 5.25e-01 | 0.1323 |
| 22824 | HSPA4L | P5T-E | Human | Esophagus | ESCC | 4.17e-16 | 2.59e-01 | 0.1327 |
| 22824 | HSPA4L | P8T-E | Human | Esophagus | ESCC | 5.67e-06 | -4.29e-02 | 0.0889 |
| 22824 | HSPA4L | P9T-E | Human | Esophagus | ESCC | 1.48e-14 | 2.74e-01 | 0.1131 |
| 22824 | HSPA4L | P10T-E | Human | Esophagus | ESCC | 1.02e-07 | -4.50e-02 | 0.116 |
| 22824 | HSPA4L | P11T-E | Human | Esophagus | ESCC | 3.67e-04 | 5.27e-01 | 0.1426 |
| 22824 | HSPA4L | P12T-E | Human | Esophagus | ESCC | 1.45e-22 | 6.80e-01 | 0.1122 |
| 22824 | HSPA4L | P15T-E | Human | Esophagus | ESCC | 1.01e-05 | 2.48e-02 | 0.1149 |
| 22824 | HSPA4L | P16T-E | Human | Esophagus | ESCC | 7.46e-21 | 1.59e-01 | 0.1153 |
| 22824 | HSPA4L | P17T-E | Human | Esophagus | ESCC | 3.46e-05 | 4.89e-02 | 0.1278 |
| 22824 | HSPA4L | P20T-E | Human | Esophagus | ESCC | 1.91e-04 | 3.71e-02 | 0.1124 |
| 22824 | HSPA4L | P21T-E | Human | Esophagus | ESCC | 2.45e-09 | 5.76e-02 | 0.1617 |
| 22824 | HSPA4L | P22T-E | Human | Esophagus | ESCC | 1.78e-07 | 8.29e-02 | 0.1236 |
| 22824 | HSPA4L | P23T-E | Human | Esophagus | ESCC | 6.75e-12 | 1.73e-01 | 0.108 |
| 22824 | HSPA4L | P24T-E | Human | Esophagus | ESCC | 3.72e-11 | 4.98e-02 | 0.1287 |
| Page: 1 2 3 4 |
| Tissue | Expression Dynamics | Abbreviation |
| Esophagus | 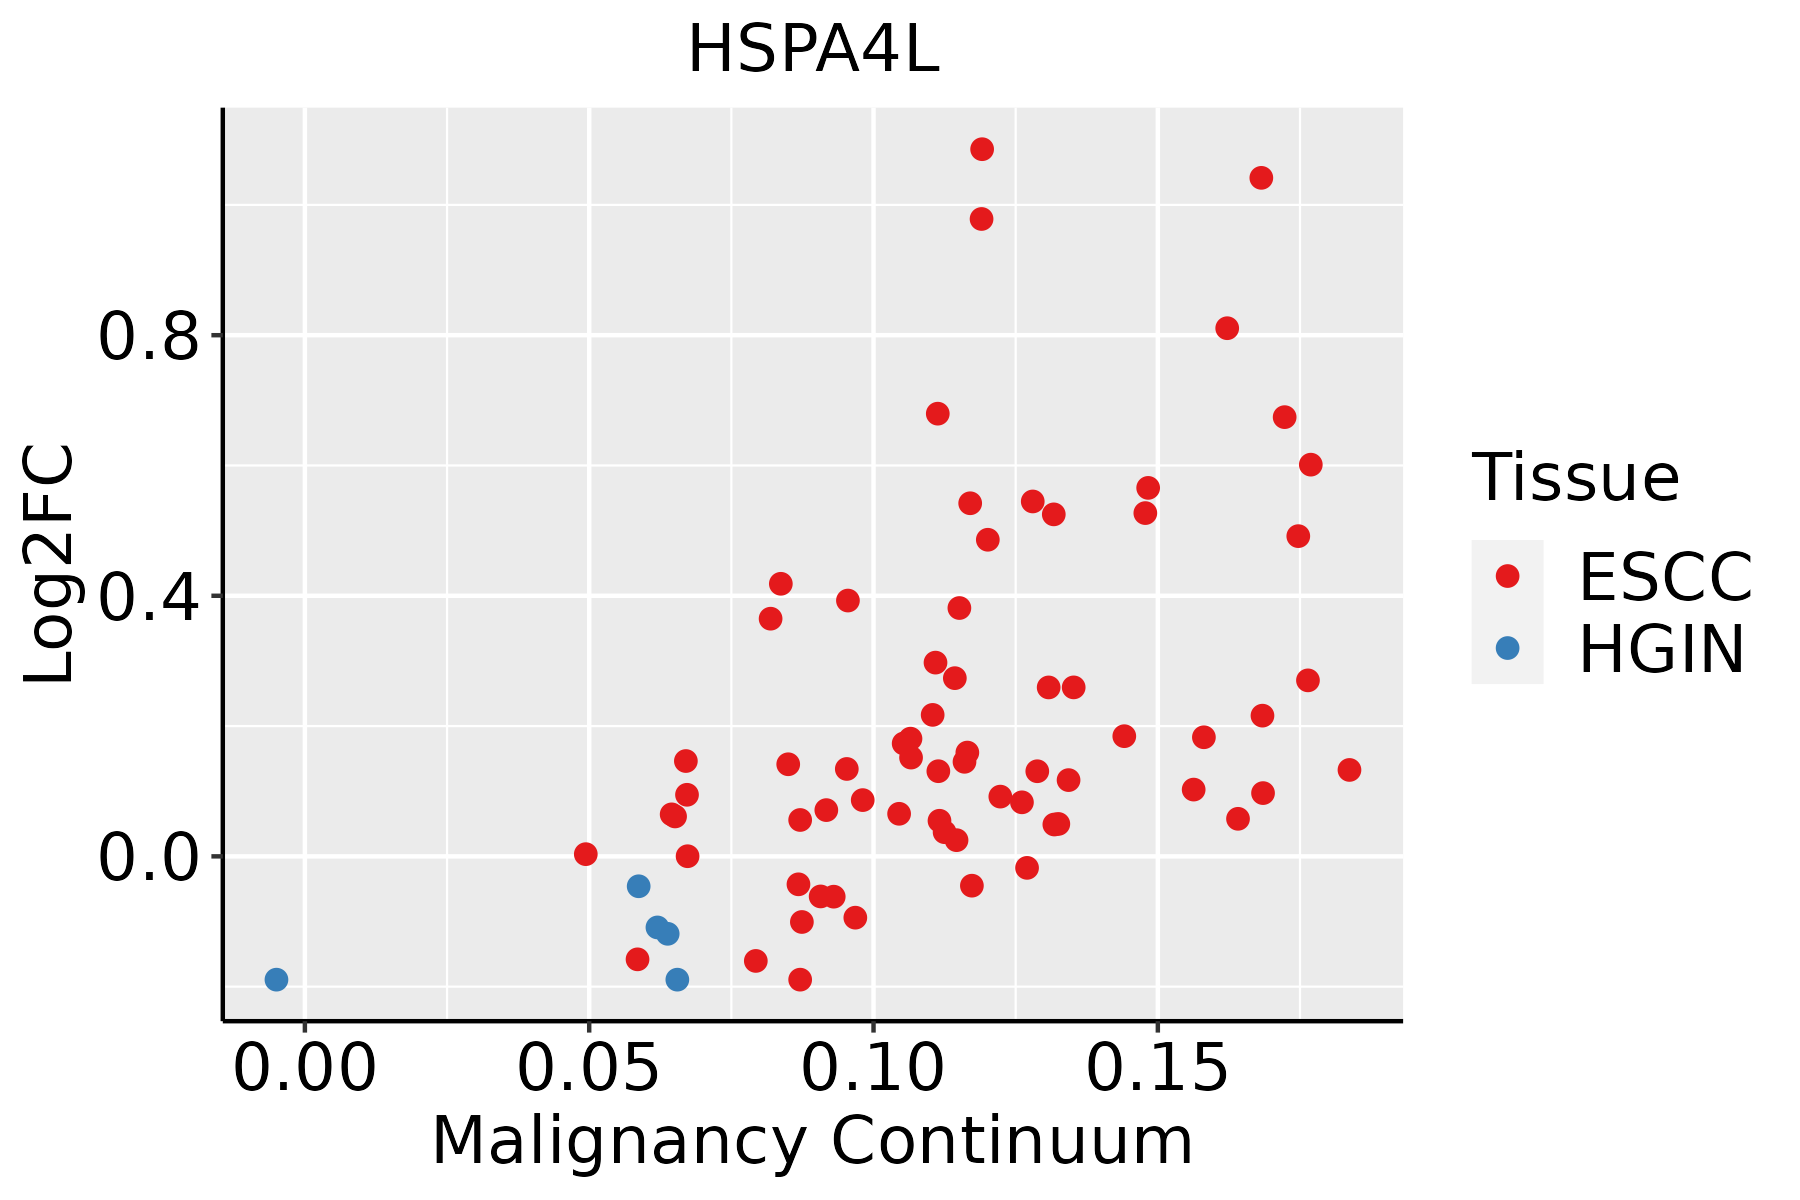 | ESCC: Esophageal squamous cell carcinoma |
| HGIN: High-grade intraepithelial neoplasias | ||
| LGIN: Low-grade intraepithelial neoplasias | ||
| Liver | 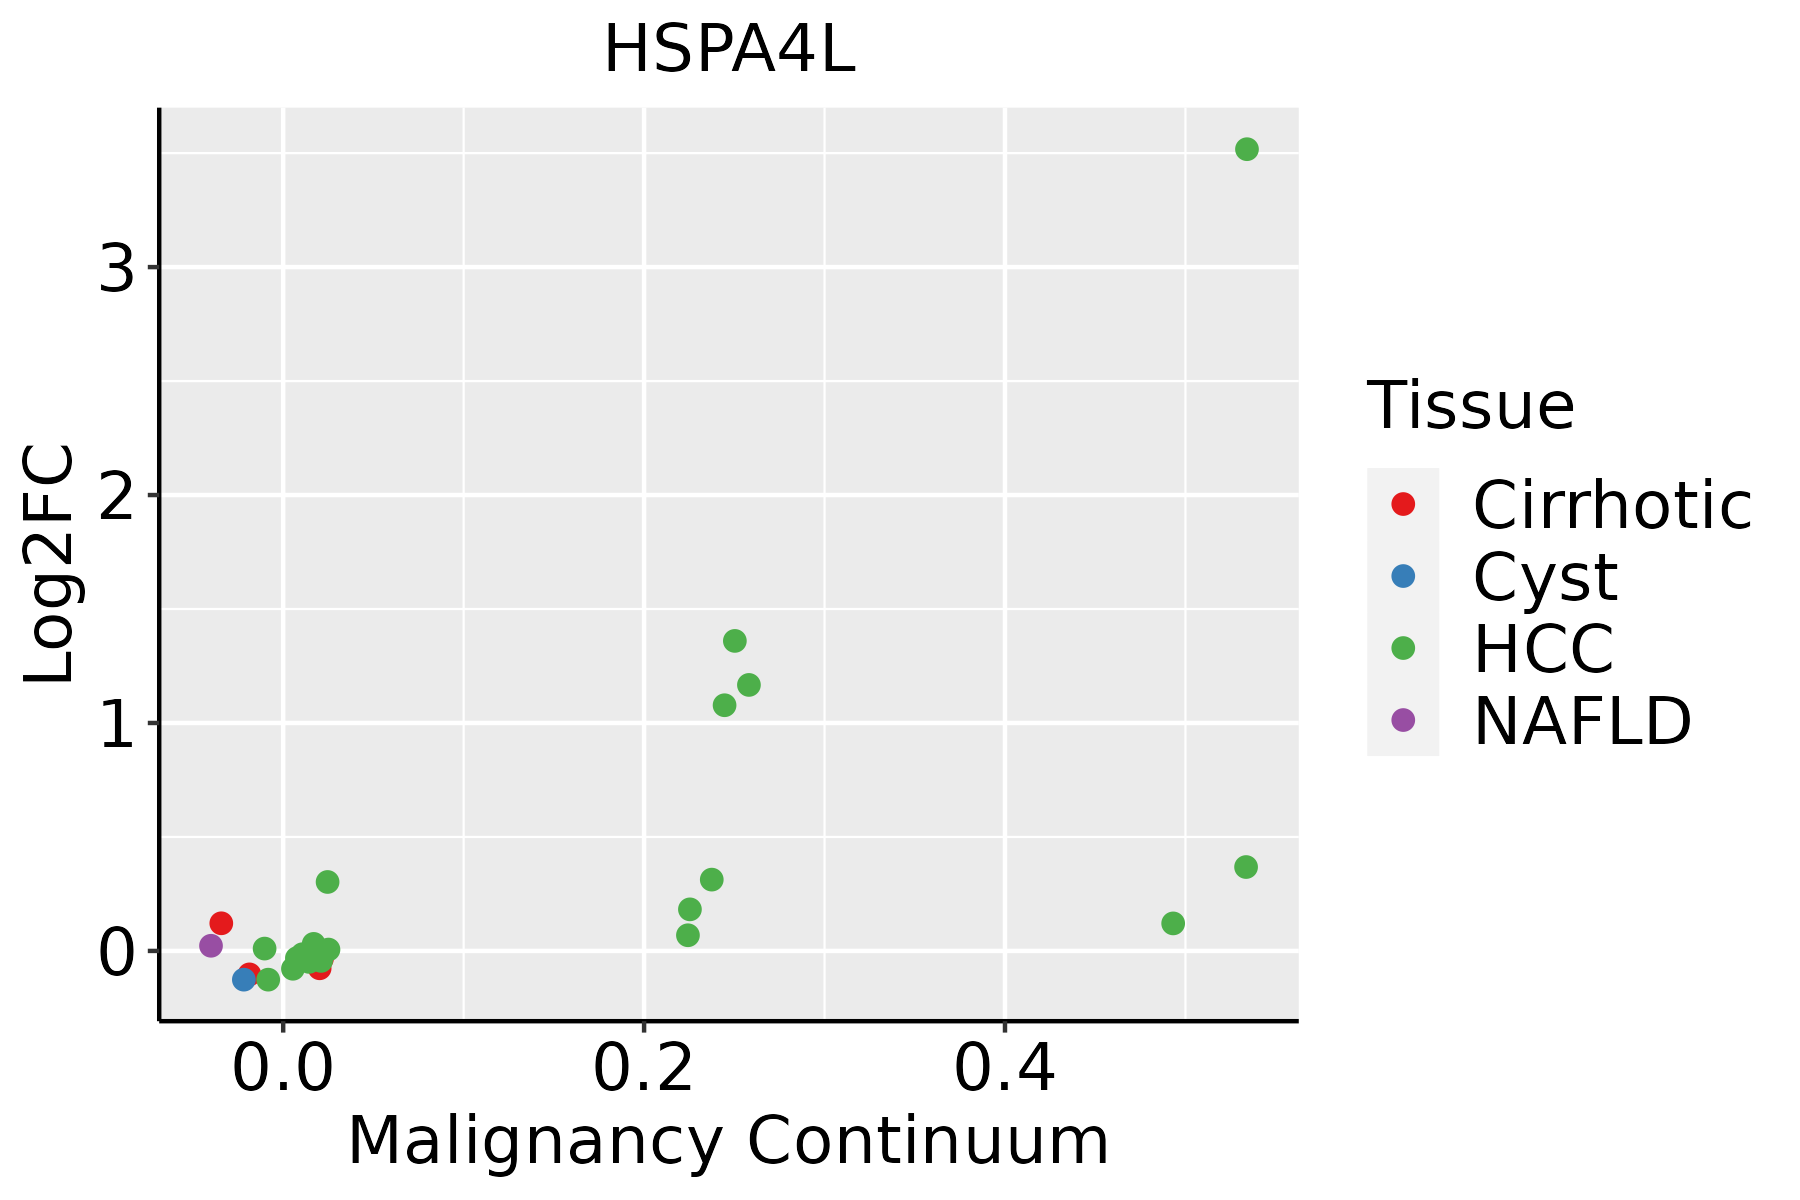 | HCC: Hepatocellular carcinoma |
| NAFLD: Non-alcoholic fatty liver disease | ||
| Oral Cavity | 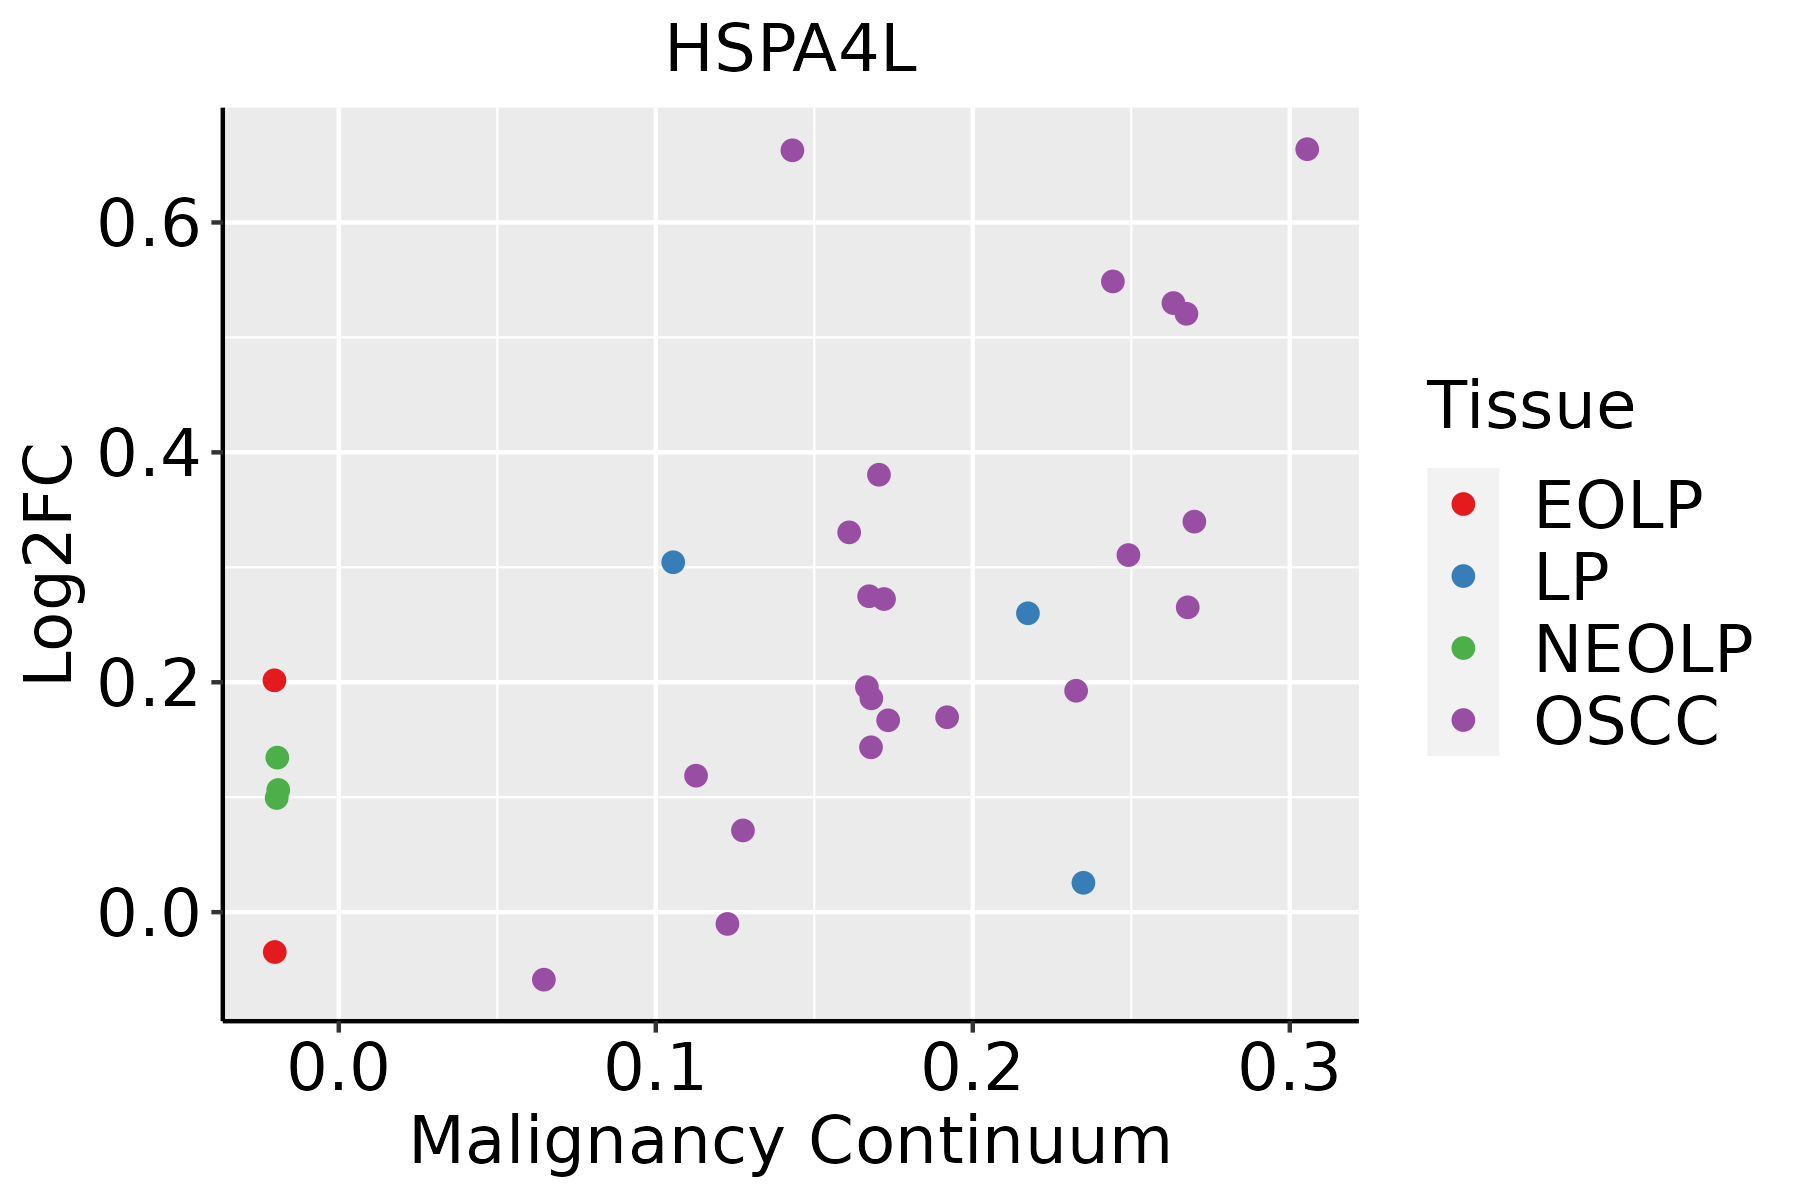 | EOLP: Erosive Oral lichen planus |
| LP: leukoplakia | ||
| NEOLP: Non-erosive oral lichen planus | ||
| OSCC: Oral squamous cell carcinoma | ||
| Skin | 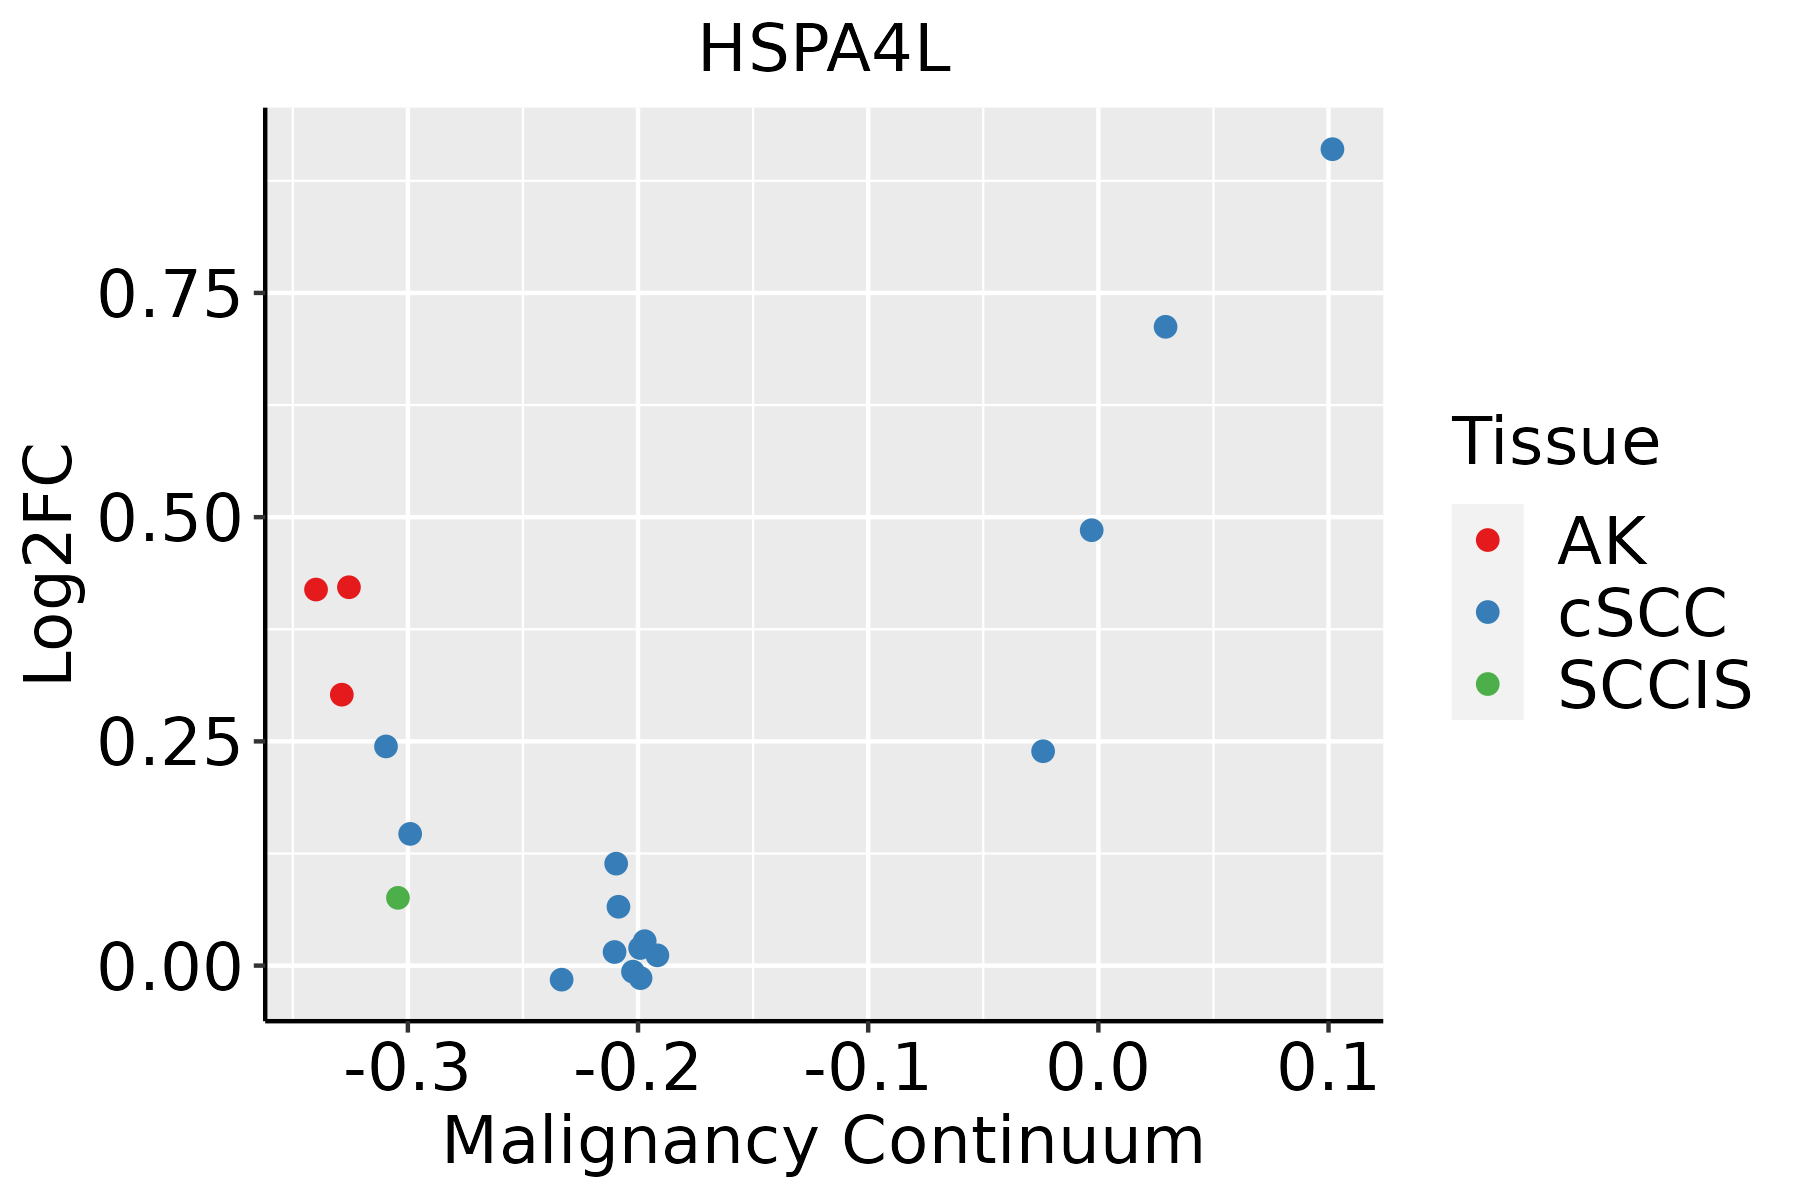 | AK: Actinic keratosis |
| cSCC: Cutaneous squamous cell carcinoma | ||
| SCCIS:squamous cell carcinoma in situ |
| ∗log2FC in expression of this searched gene in stem-like cells from each diseased tissue sample relative to stem-like cells in normal samples in each tissue plotted against the malignancy continuum. Samples are colored based on if they are from different disease stage. |
Top |
Malignant transformation related pathway analysis |
| Find out the enriched GO biological processes and KEGG pathways involved in transition from healthy to precancer to cancer |
| Tissue | Disease Stage | Enriched GO biological Processes |
| Colorectum | AD |  |
| Colorectum | SER |  |
| Colorectum | MSS |  |
| Colorectum | MSI-H |  |
| Colorectum | FAP |  |
| ∗Top 15 enriched GO BP terms are showed in the bar plot of each disease state in each tissue. Each row represents a significant GO biological process which is colored according to the -log10(p.adjust). |
| Page: 1 2 3 4 5 6 7 8 9 |
| GO ID | Tissue | Disease Stage | Description | Gene Ratio | Bg Ratio | pvalue | p.adjust | Count |
| GO:0006457110 | Esophagus | ESCC | protein folding | 163/8552 | 212/18723 | 1.13e-20 | 1.74e-18 | 163 |
| GO:0035966111 | Esophagus | ESCC | response to topologically incorrect protein | 125/8552 | 159/18723 | 1.44e-17 | 1.27e-15 | 125 |
| GO:0006986111 | Esophagus | ESCC | response to unfolded protein | 107/8552 | 137/18723 | 7.01e-15 | 3.87e-13 | 107 |
| GO:00064577 | Liver | Cirrhotic | protein folding | 114/4634 | 212/18723 | 9.23e-20 | 2.31e-17 | 114 |
| GO:00359667 | Liver | Cirrhotic | response to topologically incorrect protein | 91/4634 | 159/18723 | 2.07e-18 | 3.60e-16 | 91 |
| GO:00069867 | Liver | Cirrhotic | response to unfolded protein | 79/4634 | 137/18723 | 1.99e-16 | 2.49e-14 | 79 |
| GO:000645712 | Liver | HCC | protein folding | 160/7958 | 212/18723 | 1.07e-22 | 1.88e-20 | 160 |
| GO:003596612 | Liver | HCC | response to topologically incorrect protein | 123/7958 | 159/18723 | 2.60e-19 | 3.44e-17 | 123 |
| GO:000698612 | Liver | HCC | response to unfolded protein | 103/7958 | 137/18723 | 6.50e-15 | 4.48e-13 | 103 |
| GO:000645718 | Oral cavity | OSCC | protein folding | 154/7305 | 212/18723 | 1.89e-23 | 4.60e-21 | 154 |
| GO:003596620 | Oral cavity | OSCC | response to topologically incorrect protein | 117/7305 | 159/18723 | 6.93e-19 | 8.60e-17 | 117 |
| GO:000698620 | Oral cavity | OSCC | response to unfolded protein | 103/7305 | 137/18723 | 6.47e-18 | 6.50e-16 | 103 |
| GO:000698626 | Skin | AK | response to unfolded protein | 35/1910 | 137/18723 | 2.24e-07 | 9.02e-06 | 35 |
| GO:003596626 | Skin | AK | response to topologically incorrect protein | 38/1910 | 159/18723 | 4.39e-07 | 1.63e-05 | 38 |
| GO:000645726 | Skin | AK | protein folding | 44/1910 | 212/18723 | 3.54e-06 | 8.91e-05 | 44 |
| GO:0006457111 | Skin | cSCC | protein folding | 131/4864 | 212/18723 | 2.96e-28 | 1.32e-25 | 131 |
| GO:0035966112 | Skin | cSCC | response to topologically incorrect protein | 90/4864 | 159/18723 | 2.26e-16 | 2.12e-14 | 90 |
| GO:0006986112 | Skin | cSCC | response to unfolded protein | 78/4864 | 137/18723 | 1.44e-14 | 1.03e-12 | 78 |
| Page: 1 |
| Pathway ID | Tissue | Disease Stage | Description | Gene Ratio | Bg Ratio | pvalue | p.adjust | qvalue | Count |
| hsa04141211 | Esophagus | ESCC | Protein processing in endoplasmic reticulum | 147/4205 | 174/8465 | 3.29e-22 | 1.10e-19 | 5.64e-20 | 147 |
| hsa04141310 | Esophagus | ESCC | Protein processing in endoplasmic reticulum | 147/4205 | 174/8465 | 3.29e-22 | 1.10e-19 | 5.64e-20 | 147 |
| hsa0414114 | Liver | Cirrhotic | Protein processing in endoplasmic reticulum | 114/2530 | 174/8465 | 1.16e-22 | 9.67e-21 | 5.96e-21 | 114 |
| hsa0414115 | Liver | Cirrhotic | Protein processing in endoplasmic reticulum | 114/2530 | 174/8465 | 1.16e-22 | 9.67e-21 | 5.96e-21 | 114 |
| hsa0414122 | Liver | HCC | Protein processing in endoplasmic reticulum | 146/4020 | 174/8465 | 7.34e-24 | 2.46e-21 | 1.37e-21 | 146 |
| hsa0414132 | Liver | HCC | Protein processing in endoplasmic reticulum | 146/4020 | 174/8465 | 7.34e-24 | 2.46e-21 | 1.37e-21 | 146 |
| hsa0414130 | Oral cavity | OSCC | Protein processing in endoplasmic reticulum | 143/3704 | 174/8465 | 6.82e-26 | 2.28e-23 | 1.16e-23 | 143 |
| hsa04141113 | Oral cavity | OSCC | Protein processing in endoplasmic reticulum | 143/3704 | 174/8465 | 6.82e-26 | 2.28e-23 | 1.16e-23 | 143 |
| Page: 1 |
Top |
Cell-cell communication analysis |
| Identification of potential cell-cell interactions between two cell types and their ligand-receptor pairs for different disease states |
| Ligand | Receptor | LRpair | Pathway | Tissue | Disease Stage |
| Page: 1 |
Top |
Single-cell gene regulatory network inference analysis |
| Find out the significant the regulons (TFs) and the target genes of each regulon across cell types for different disease states |
| TF | Cell Type | Tissue | Disease Stage | Target Gene | RSS | Regulon Activity |
| ∗The dot plots of a searched regulon are shown for all cell subpopulations in each disease state of each tissue based on the regulon specific score inferred using pySCENIC and by calculating the average expression. |
| Page: 1 |
Top |
Somatic mutation of malignant transformation related genes |
| Annotation of somatic variants for genes involved in malignant transformation |
| Hugo Symbol | Variant Class | Variant Classification | dbSNP RS | HGVSc | HGVSp | HGVSp Short | SWISSPROT | BIOTYPE | SIFT | PolyPhen | Tumor Sample Barcode | Tissue | Histology | Sex | Age | Stage | Therapy Types | Drugs | Outcome |
| HSPA4L | SNV | Missense_Mutation | rs141362649 | c.1447C>T | p.Arg483Cys | p.R483C | O95757 | protein_coding | deleterious(0) | probably_damaging(0.998) | TCGA-AN-A046-01 | Breast | breast invasive carcinoma | Female | >=65 | I/II | Unknown | Unknown | SD |
| HSPA4L | SNV | Missense_Mutation | rs759610355 | c.893C>T | p.Ser298Phe | p.S298F | O95757 | protein_coding | deleterious(0) | benign(0.343) | TCGA-D8-A1JA-01 | Breast | breast invasive carcinoma | Female | <65 | III/IV | Chemotherapy | adriamycin | PD |
| HSPA4L | deletion | Frame_Shift_Del | novel | c.1781delN | p.Asp595IlefsTer13 | p.D595Ifs*13 | O95757 | protein_coding | TCGA-D8-A27V-01 | Breast | breast invasive carcinoma | Female | <65 | I/II | Hormone Therapy | tamoxiphen | SD | ||
| HSPA4L | SNV | Missense_Mutation | novel | c.136C>G | p.Arg46Gly | p.R46G | O95757 | protein_coding | deleterious(0) | benign(0.258) | TCGA-EA-A44S-01 | Cervix | cervical & endocervical cancer | Female | <65 | III/IV | Chemotherapy | carboplatin | SD |
| HSPA4L | SNV | Missense_Mutation | rs139697778 | c.1013N>C | p.Ile338Thr | p.I338T | O95757 | protein_coding | deleterious(0) | possibly_damaging(0.655) | TCGA-EK-A3GM-01 | Cervix | cervical & endocervical cancer | Female | >=65 | I/II | Unknown | Unknown | SD |
| HSPA4L | SNV | Missense_Mutation | rs766607334 | c.110C>T | p.Ala37Val | p.A37V | O95757 | protein_coding | deleterious(0) | benign(0.192) | TCGA-AA-3663-01 | Colorectum | colon adenocarcinoma | Male | <65 | I/II | Unknown | Unknown | SD |
| HSPA4L | SNV | Missense_Mutation | c.2347N>T | p.Asn783Tyr | p.N783Y | O95757 | protein_coding | deleterious(0.02) | possibly_damaging(0.757) | TCGA-AA-3715-01 | Colorectum | colon adenocarcinoma | Male | >=65 | I/II | Unknown | Unknown | PD | |
| HSPA4L | SNV | Missense_Mutation | rs200226261 | c.173N>T | p.Thr58Met | p.T58M | O95757 | protein_coding | deleterious(0.02) | probably_damaging(0.999) | TCGA-AD-A5EJ-01 | Colorectum | colon adenocarcinoma | Female | >=65 | I/II | Unknown | Unknown | SD |
| HSPA4L | SNV | Missense_Mutation | novel | c.2098N>C | p.Lys700Gln | p.K700Q | O95757 | protein_coding | tolerated(0.26) | benign(0.395) | TCGA-AZ-4315-01 | Colorectum | colon adenocarcinoma | Male | <65 | I/II | Unknown | Unknown | SD |
| HSPA4L | SNV | Missense_Mutation | novel | c.776N>G | p.Asn259Ser | p.N259S | O95757 | protein_coding | tolerated(0.07) | probably_damaging(0.992) | TCGA-CA-6717-01 | Colorectum | colon adenocarcinoma | Male | <65 | I/II | Chemotherapy | oxaliplatin | CR |
| Page: 1 2 3 4 5 6 7 8 9 |
Top |
Related drugs of malignant transformation related genes |
| Identification of chemicals and drugs interact with genes involved in malignant transfromation |
| (DGIdb 4.0) |
| Entrez ID | Symbol | Category | Interaction Types | Drug Claim Name | Drug Name | PMIDs |
| Page: 1 |

Copyright 2023-Present -The University of Texas Health Science Center at Houston |