
|
|||||
|
 | |
| |
| |
| |
| |
| |
|
Gene: HSPA2 |
Gene summary for HSPA2 |
| Gene information | Species | Human | Gene symbol | HSPA2 | Gene ID | 3306 |
| Gene name | heat shock protein family A (Hsp70) member 2 | |
| Gene Alias | HSP70-2 | |
| Cytomap | 14q23.3 | |
| Gene Type | protein-coding | GO ID | GO:0000003 | UniProtAcc | A0A024R6B5 |
Top |
Malignant transformation analysis |
| Identification of the aberrant gene expression in precancerous and cancerous lesions by comparing the gene expression of stem-like cells in diseased tissues with normal stem cells |
| Entrez ID | Symbol | Replicates | Species | Organ | Tissue | Adj P-value | Log2FC | Malignancy |
| 3306 | HSPA2 | CA_HPV_3 | Human | Cervix | CC | 1.46e-05 | 2.43e-01 | 0.0414 |
| 3306 | HSPA2 | Tumor | Human | Cervix | CC | 1.08e-04 | 3.66e-01 | 0.1241 |
| 3306 | HSPA2 | sample1 | Human | Cervix | CC | 1.93e-12 | 6.43e-01 | 0.0959 |
| 3306 | HSPA2 | sample3 | Human | Cervix | CC | 1.71e-15 | 4.34e-01 | 0.1387 |
| 3306 | HSPA2 | T1 | Human | Cervix | CC | 1.33e-29 | 8.07e-01 | 0.0918 |
| 3306 | HSPA2 | T3 | Human | Cervix | CC | 4.35e-14 | 4.34e-01 | 0.1389 |
| 3306 | HSPA2 | LZE4T | Human | Esophagus | ESCC | 4.51e-09 | 3.49e-01 | 0.0811 |
| 3306 | HSPA2 | LZE5T | Human | Esophagus | ESCC | 6.85e-06 | 4.27e-01 | 0.0514 |
| 3306 | HSPA2 | LZE7T | Human | Esophagus | ESCC | 4.12e-05 | 5.00e-01 | 0.0667 |
| 3306 | HSPA2 | LZE21D1 | Human | Esophagus | HGIN | 4.13e-02 | 3.15e-01 | 0.0632 |
| 3306 | HSPA2 | LZE22T | Human | Esophagus | ESCC | 9.36e-08 | 1.55e+00 | 0.068 |
| 3306 | HSPA2 | LZE24T | Human | Esophagus | ESCC | 4.20e-19 | 6.98e-01 | 0.0596 |
| 3306 | HSPA2 | P1T-E | Human | Esophagus | ESCC | 8.87e-05 | 4.91e-01 | 0.0875 |
| 3306 | HSPA2 | P2T-E | Human | Esophagus | ESCC | 1.90e-11 | 3.35e-01 | 0.1177 |
| 3306 | HSPA2 | P4T-E | Human | Esophagus | ESCC | 1.29e-28 | 1.14e+00 | 0.1323 |
| 3306 | HSPA2 | P5T-E | Human | Esophagus | ESCC | 2.42e-03 | 1.28e-01 | 0.1327 |
| 3306 | HSPA2 | P8T-E | Human | Esophagus | ESCC | 3.12e-11 | -3.91e-02 | 0.0889 |
| 3306 | HSPA2 | P9T-E | Human | Esophagus | ESCC | 7.31e-05 | 4.17e-03 | 0.1131 |
| 3306 | HSPA2 | P10T-E | Human | Esophagus | ESCC | 7.80e-56 | 1.53e+00 | 0.116 |
| 3306 | HSPA2 | P11T-E | Human | Esophagus | ESCC | 7.99e-26 | 2.37e+00 | 0.1426 |
| Page: 1 2 3 4 5 |
| Tissue | Expression Dynamics | Abbreviation |
| Cervix | 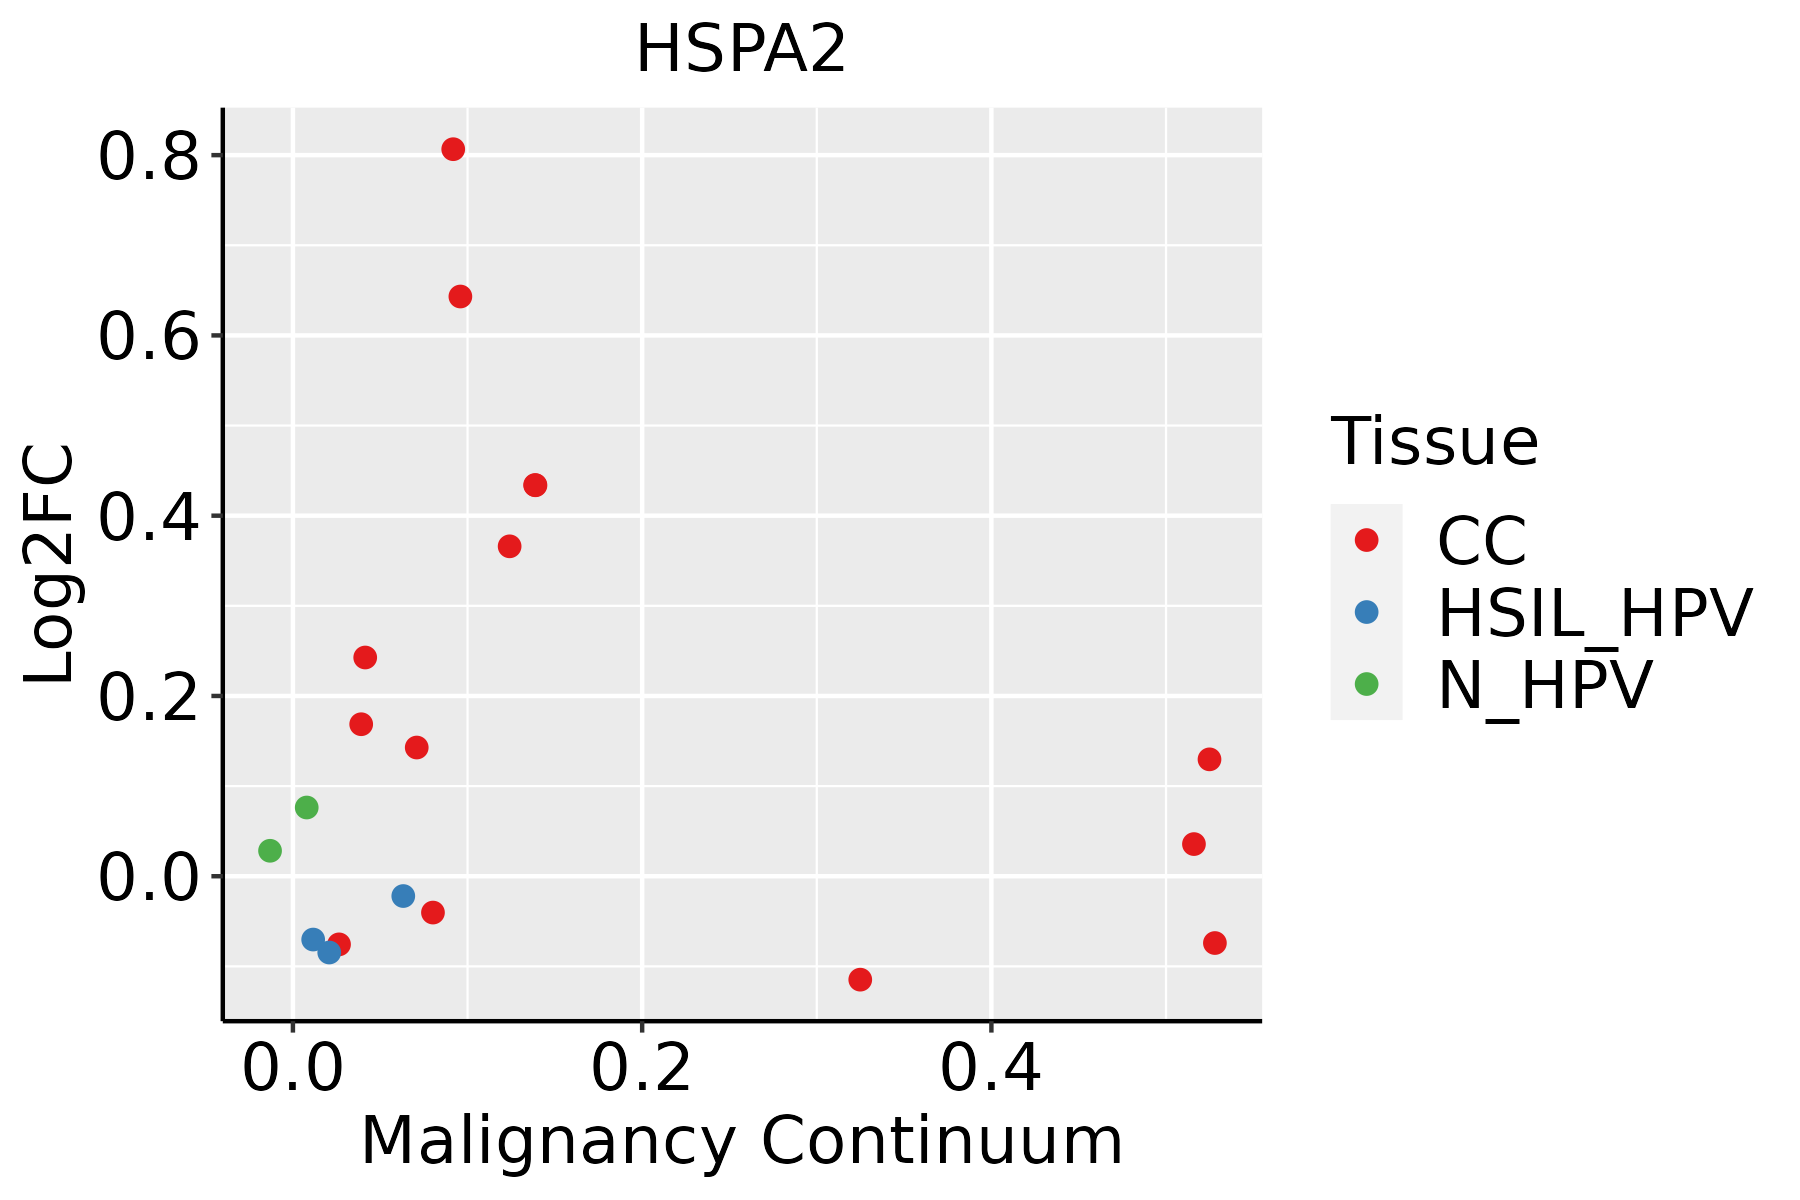 | CC: Cervix cancer |
| HSIL_HPV: HPV-infected high-grade squamous intraepithelial lesions | ||
| N_HPV: HPV-infected normal cervix | ||
| Esophagus | 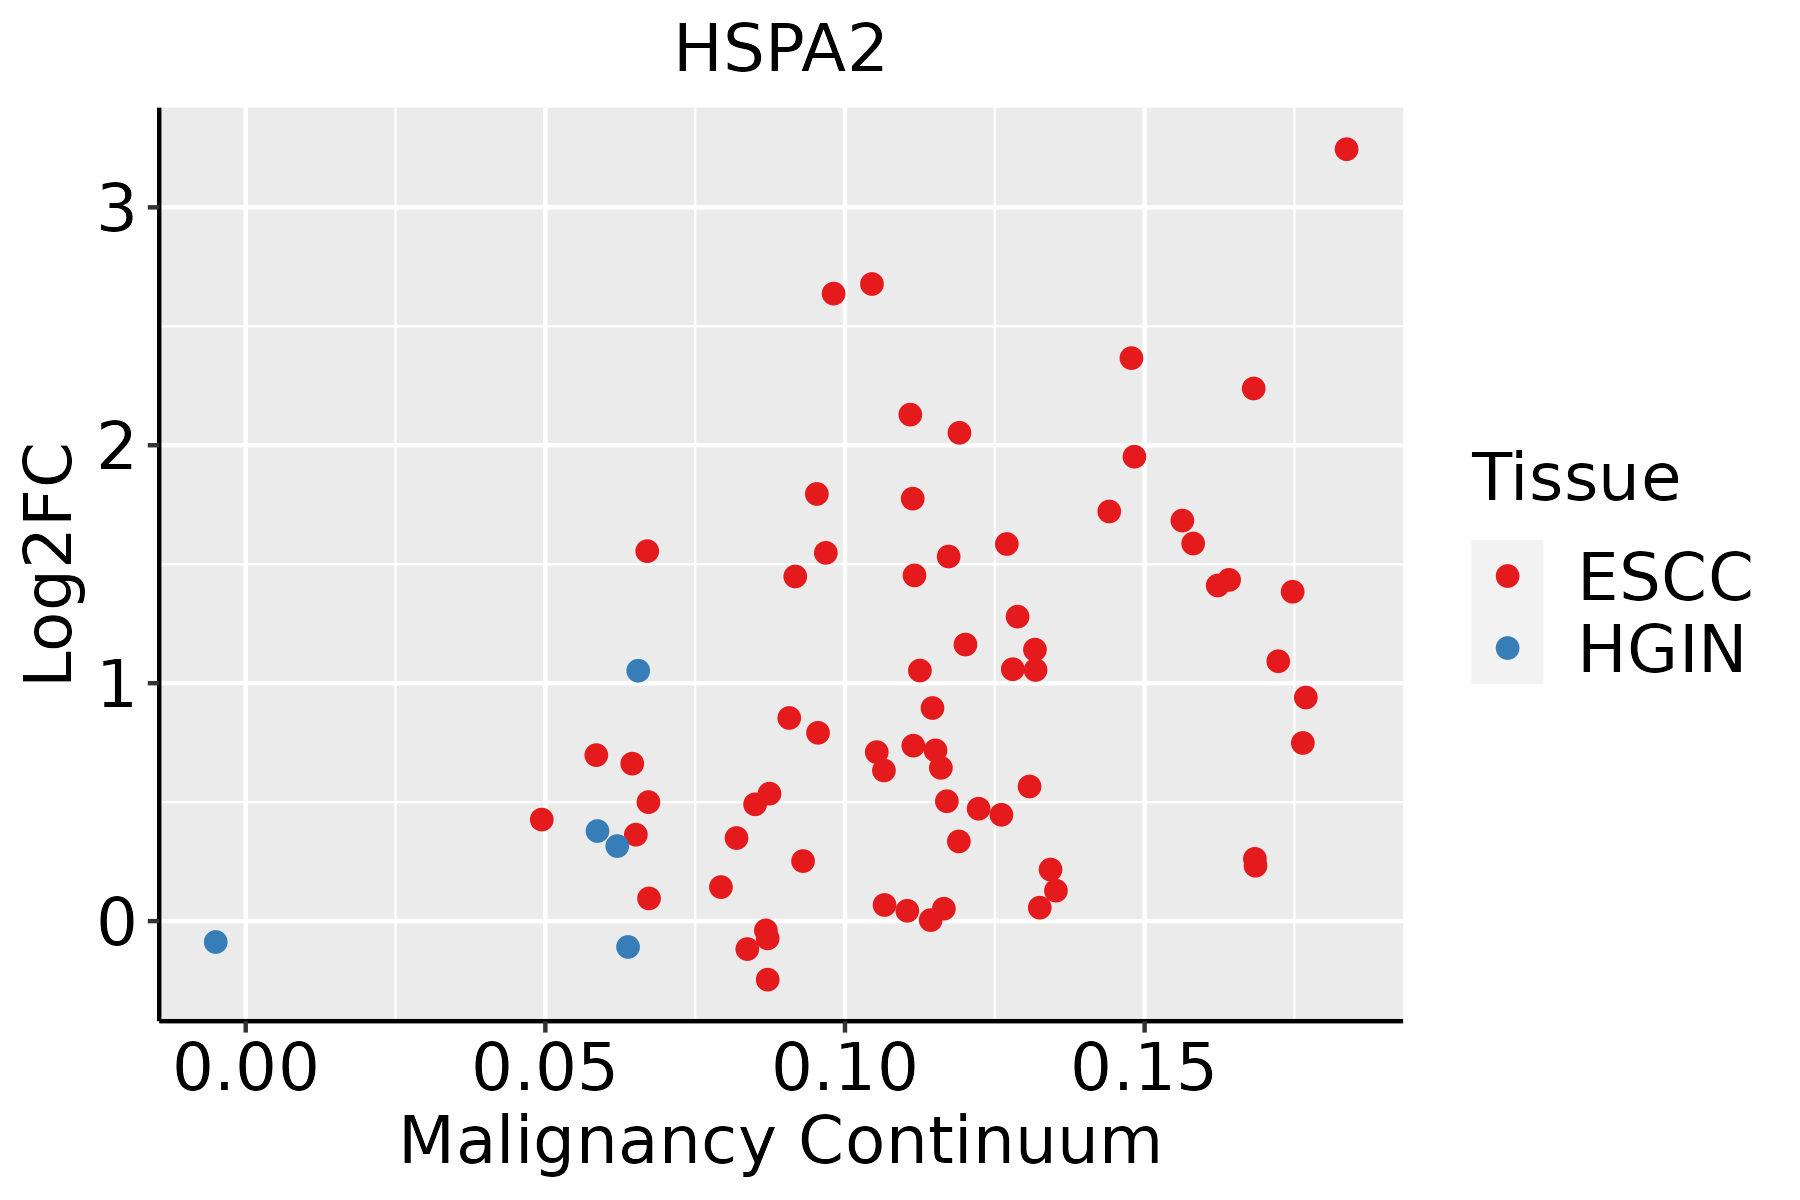 | ESCC: Esophageal squamous cell carcinoma |
| HGIN: High-grade intraepithelial neoplasias | ||
| LGIN: Low-grade intraepithelial neoplasias | ||
| Oral Cavity | 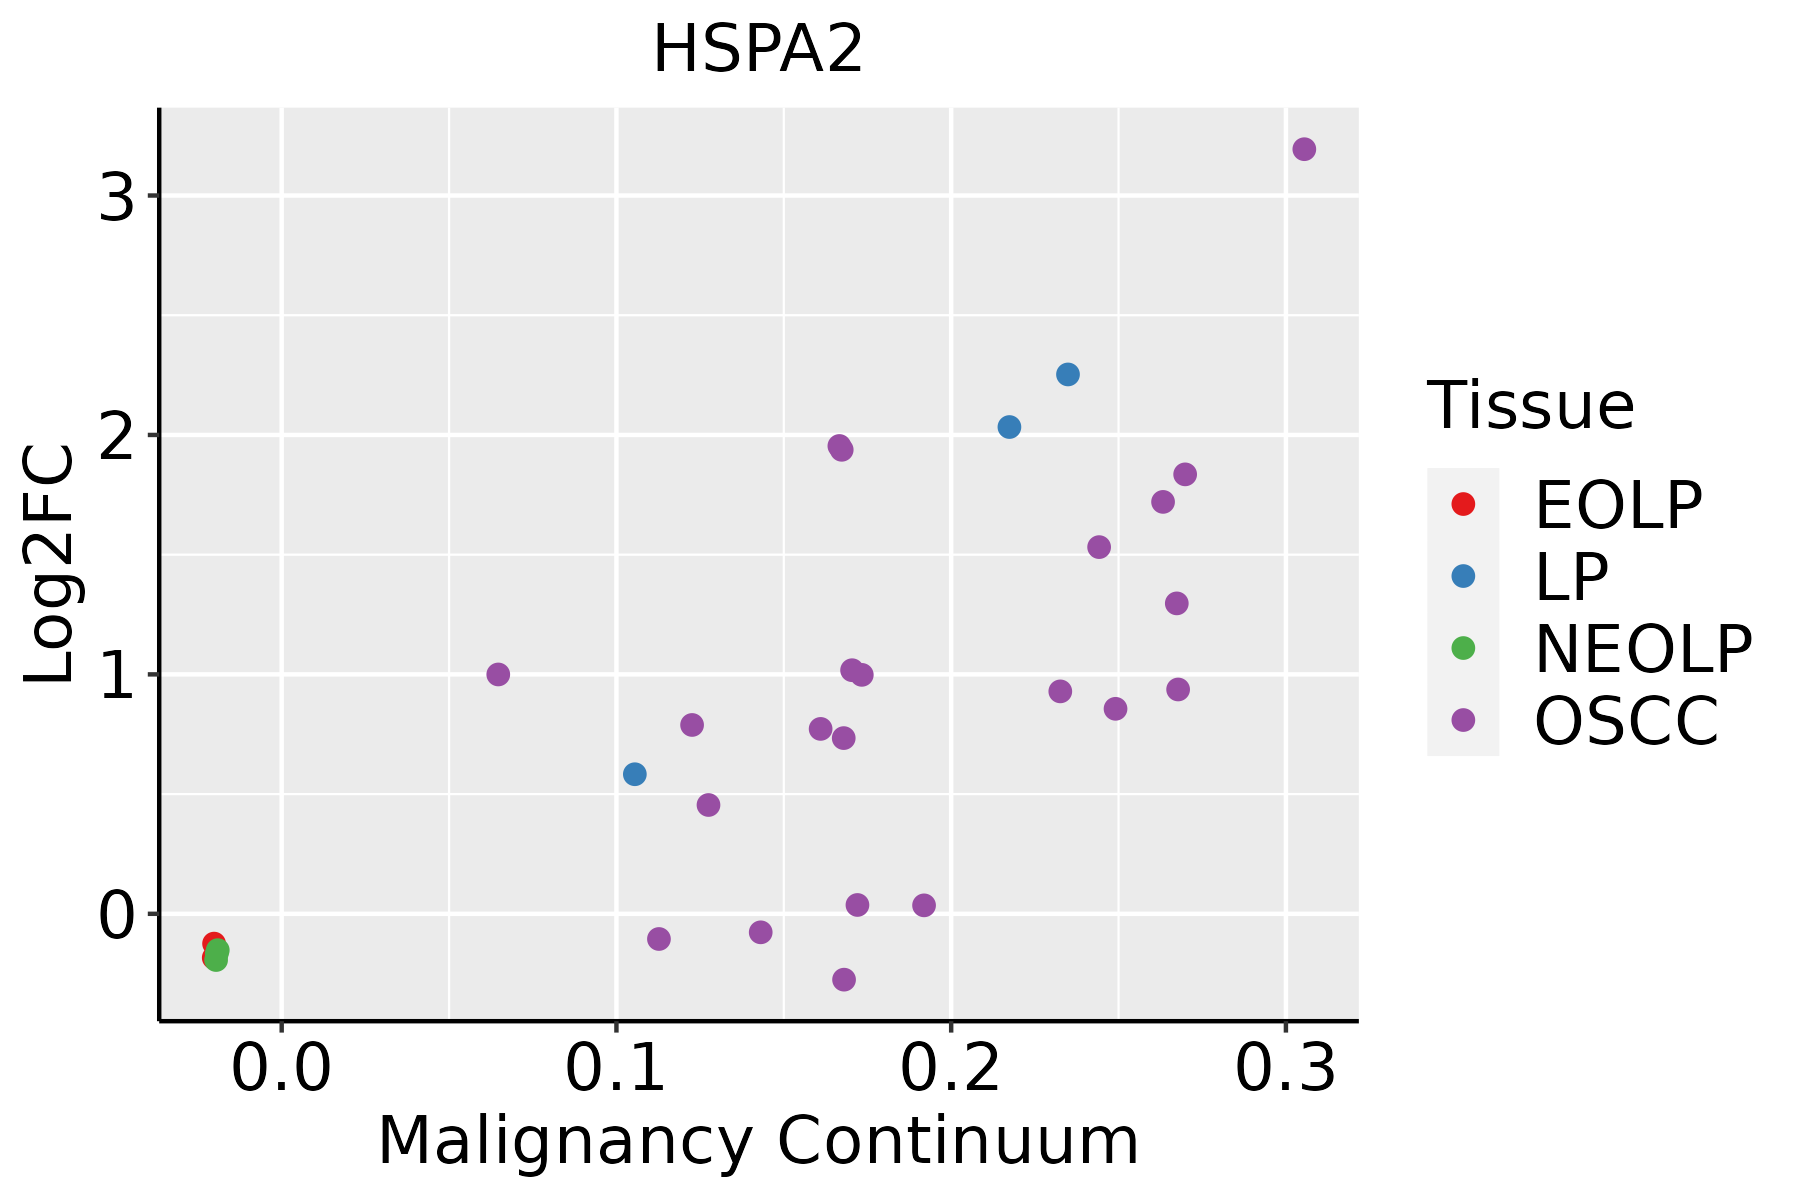 | EOLP: Erosive Oral lichen planus |
| LP: leukoplakia | ||
| NEOLP: Non-erosive oral lichen planus | ||
| OSCC: Oral squamous cell carcinoma | ||
| Skin | 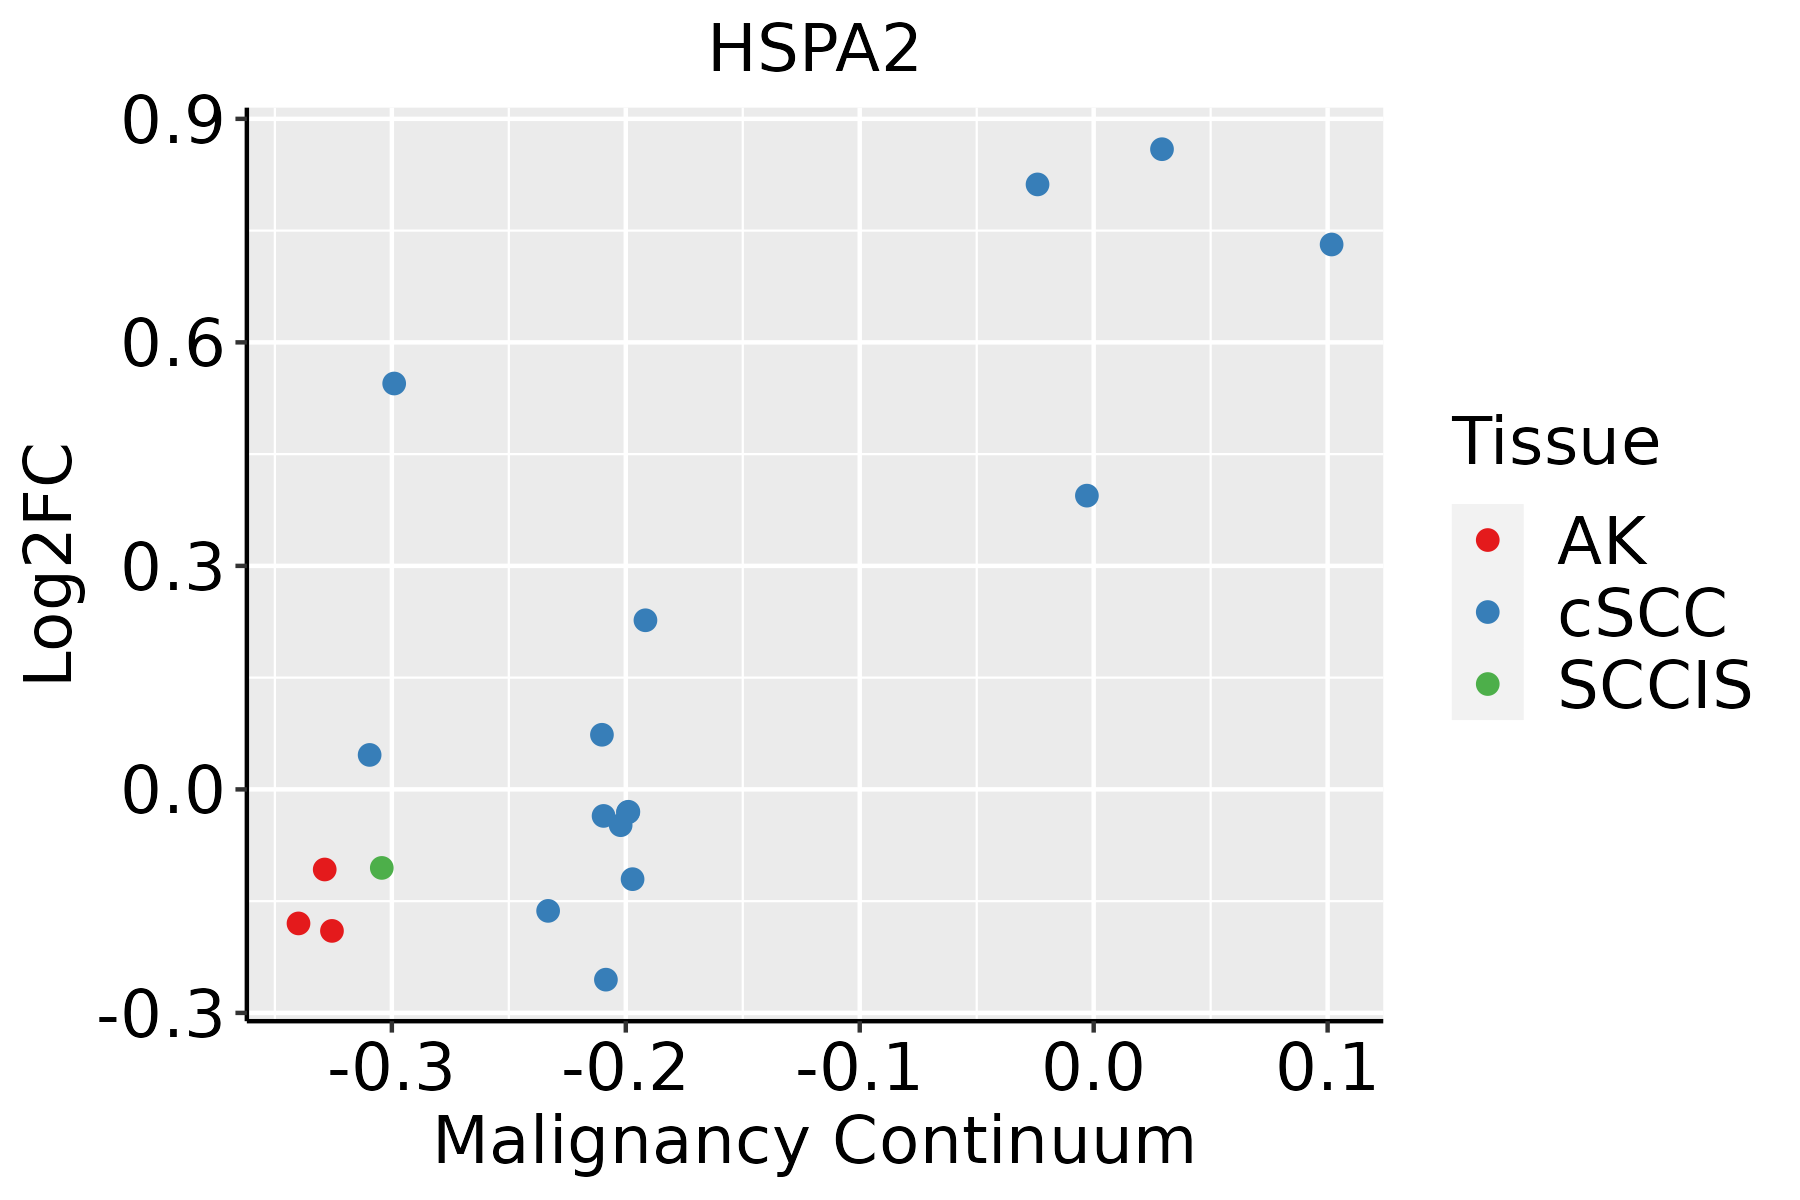 | AK: Actinic keratosis |
| cSCC: Cutaneous squamous cell carcinoma | ||
| SCCIS:squamous cell carcinoma in situ |
| ∗log2FC in expression of this searched gene in stem-like cells from each diseased tissue sample relative to stem-like cells in normal samples in each tissue plotted against the malignancy continuum. Samples are colored based on if they are from different disease stage. |
Top |
Malignant transformation related pathway analysis |
| Find out the enriched GO biological processes and KEGG pathways involved in transition from healthy to precancer to cancer |
| Tissue | Disease Stage | Enriched GO biological Processes |
| Colorectum | AD |  |
| Colorectum | SER |  |
| Colorectum | MSS |  |
| Colorectum | MSI-H |  |
| Colorectum | FAP |  |
| ∗Top 15 enriched GO BP terms are showed in the bar plot of each disease state in each tissue. Each row represents a significant GO biological process which is colored according to the -log10(p.adjust). |
| Page: 1 2 3 4 5 6 7 8 9 |
| GO ID | Tissue | Disease Stage | Description | Gene Ratio | Bg Ratio | pvalue | p.adjust | Count |
| GO:00447725 | Cervix | CC | mitotic cell cycle phase transition | 89/2311 | 424/18723 | 2.70e-07 | 1.12e-05 | 89 |
| GO:00420269 | Cervix | CC | protein refolding | 12/2311 | 23/18723 | 4.41e-06 | 1.12e-04 | 12 |
| GO:000698610 | Cervix | CC | response to unfolded protein | 36/2311 | 137/18723 | 6.83e-06 | 1.63e-04 | 36 |
| GO:00457876 | Cervix | CC | positive regulation of cell cycle | 66/2311 | 313/18723 | 7.78e-06 | 1.81e-04 | 66 |
| GO:00073466 | Cervix | CC | regulation of mitotic cell cycle | 88/2311 | 457/18723 | 1.26e-05 | 2.60e-04 | 88 |
| GO:19019903 | Cervix | CC | regulation of mitotic cell cycle phase transition | 63/2311 | 299/18723 | 1.27e-05 | 2.60e-04 | 63 |
| GO:003596610 | Cervix | CC | response to topologically incorrect protein | 39/2311 | 159/18723 | 1.68e-05 | 3.22e-04 | 39 |
| GO:00459316 | Cervix | CC | positive regulation of mitotic cell cycle | 32/2311 | 121/18723 | 1.88e-05 | 3.47e-04 | 32 |
| GO:003462010 | Cervix | CC | cellular response to unfolded protein | 27/2311 | 96/18723 | 2.53e-05 | 4.29e-04 | 27 |
| GO:00610779 | Cervix | CC | chaperone-mediated protein folding | 21/2311 | 67/18723 | 3.40e-05 | 5.55e-04 | 21 |
| GO:19019922 | Cervix | CC | positive regulation of mitotic cell cycle phase transition | 26/2311 | 93/18723 | 3.97e-05 | 6.18e-04 | 26 |
| GO:002241110 | Cervix | CC | cellular component disassembly | 83/2311 | 443/18723 | 6.04e-05 | 8.68e-04 | 83 |
| GO:00900685 | Cervix | CC | positive regulation of cell cycle process | 50/2311 | 236/18723 | 8.25e-05 | 1.11e-03 | 50 |
| GO:19019873 | Cervix | CC | regulation of cell cycle phase transition | 74/2311 | 390/18723 | 9.80e-05 | 1.27e-03 | 74 |
| GO:003596710 | Cervix | CC | cellular response to topologically incorrect protein | 29/2311 | 116/18723 | 1.35e-04 | 1.66e-03 | 29 |
| GO:19019892 | Cervix | CC | positive regulation of cell cycle phase transition | 28/2311 | 115/18723 | 2.82e-04 | 3.07e-03 | 28 |
| GO:00094089 | Cervix | CC | response to heat | 27/2311 | 110/18723 | 3.12e-04 | 3.32e-03 | 27 |
| GO:00064579 | Cervix | CC | protein folding | 44/2311 | 212/18723 | 3.43e-04 | 3.59e-03 | 44 |
| GO:00064589 | Cervix | CC | 'de novo' protein folding | 14/2311 | 43/18723 | 4.37e-04 | 4.38e-03 | 14 |
| GO:00510859 | Cervix | CC | chaperone cofactor-dependent protein refolding | 12/2311 | 34/18723 | 4.85e-04 | 4.75e-03 | 12 |
| Page: 1 2 3 4 5 6 7 8 9 |
| Pathway ID | Tissue | Disease Stage | Description | Gene Ratio | Bg Ratio | pvalue | p.adjust | qvalue | Count |
| hsa0502018 | Cervix | CC | Prion disease | 98/1267 | 273/8465 | 2.64e-18 | 1.42e-16 | 8.42e-17 | 98 |
| hsa0461220 | Cervix | CC | Antigen processing and presentation | 34/1267 | 78/8465 | 1.06e-09 | 2.14e-08 | 1.26e-08 | 34 |
| hsa0541720 | Cervix | CC | Lipid and atherosclerosis | 65/1267 | 215/8465 | 6.47e-09 | 1.10e-07 | 6.52e-08 | 65 |
| hsa0414120 | Cervix | CC | Protein processing in endoplasmic reticulum | 55/1267 | 174/8465 | 1.74e-08 | 2.68e-07 | 1.58e-07 | 55 |
| hsa0491520 | Cervix | CC | Estrogen signaling pathway | 44/1267 | 138/8465 | 3.55e-07 | 3.97e-06 | 2.35e-06 | 44 |
| hsa0414418 | Cervix | CC | Endocytosis | 64/1267 | 251/8465 | 6.97e-06 | 6.10e-05 | 3.61e-05 | 64 |
| hsa0514514 | Cervix | CC | Toxoplasmosis | 34/1267 | 112/8465 | 2.42e-05 | 1.82e-04 | 1.08e-04 | 34 |
| hsa0513416 | Cervix | CC | Legionellosis | 20/1267 | 57/8465 | 1.29e-04 | 8.19e-04 | 4.85e-04 | 20 |
| hsa040109 | Cervix | CC | MAPK signaling pathway | 62/1267 | 302/8465 | 4.89e-03 | 1.67e-02 | 9.86e-03 | 62 |
| hsa0502019 | Cervix | CC | Prion disease | 98/1267 | 273/8465 | 2.64e-18 | 1.42e-16 | 8.42e-17 | 98 |
| hsa04612110 | Cervix | CC | Antigen processing and presentation | 34/1267 | 78/8465 | 1.06e-09 | 2.14e-08 | 1.26e-08 | 34 |
| hsa05417110 | Cervix | CC | Lipid and atherosclerosis | 65/1267 | 215/8465 | 6.47e-09 | 1.10e-07 | 6.52e-08 | 65 |
| hsa04141110 | Cervix | CC | Protein processing in endoplasmic reticulum | 55/1267 | 174/8465 | 1.74e-08 | 2.68e-07 | 1.58e-07 | 55 |
| hsa04915110 | Cervix | CC | Estrogen signaling pathway | 44/1267 | 138/8465 | 3.55e-07 | 3.97e-06 | 2.35e-06 | 44 |
| hsa0414419 | Cervix | CC | Endocytosis | 64/1267 | 251/8465 | 6.97e-06 | 6.10e-05 | 3.61e-05 | 64 |
| hsa0514515 | Cervix | CC | Toxoplasmosis | 34/1267 | 112/8465 | 2.42e-05 | 1.82e-04 | 1.08e-04 | 34 |
| hsa0513417 | Cervix | CC | Legionellosis | 20/1267 | 57/8465 | 1.29e-04 | 8.19e-04 | 4.85e-04 | 20 |
| hsa0401012 | Cervix | CC | MAPK signaling pathway | 62/1267 | 302/8465 | 4.89e-03 | 1.67e-02 | 9.86e-03 | 62 |
| hsa0502030 | Esophagus | HGIN | Prion disease | 117/1383 | 273/8465 | 4.15e-26 | 3.38e-24 | 2.69e-24 | 117 |
| hsa0304018 | Esophagus | HGIN | Spliceosome | 79/1383 | 217/8465 | 3.22e-13 | 7.00e-12 | 5.56e-12 | 79 |
| Page: 1 2 3 4 5 |
Top |
Cell-cell communication analysis |
| Identification of potential cell-cell interactions between two cell types and their ligand-receptor pairs for different disease states |
| Ligand | Receptor | LRpair | Pathway | Tissue | Disease Stage |
| Page: 1 |
Top |
Single-cell gene regulatory network inference analysis |
| Find out the significant the regulons (TFs) and the target genes of each regulon across cell types for different disease states |
| TF | Cell Type | Tissue | Disease Stage | Target Gene | RSS | Regulon Activity |
| ∗The dot plots of a searched regulon are shown for all cell subpopulations in each disease state of each tissue based on the regulon specific score inferred using pySCENIC and by calculating the average expression. |
| Page: 1 |
Top |
Somatic mutation of malignant transformation related genes |
| Annotation of somatic variants for genes involved in malignant transformation |
| Hugo Symbol | Variant Class | Variant Classification | dbSNP RS | HGVSc | HGVSp | HGVSp Short | SWISSPROT | BIOTYPE | SIFT | PolyPhen | Tumor Sample Barcode | Tissue | Histology | Sex | Age | Stage | Therapy Types | Drugs | Outcome |
| HSPA2 | SNV | Missense_Mutation | c.53N>A | p.Cys18Tyr | p.C18Y | P54652 | protein_coding | deleterious_low_confidence(0) | probably_damaging(0.984) | TCGA-A2-A0YJ-01 | Breast | breast invasive carcinoma | Female | <65 | III/IV | Chemotherapy | cytoxan | PD | |
| HSPA2 | SNV | Missense_Mutation | c.500N>A | p.Gly167Glu | p.G167E | P54652 | protein_coding | deleterious_low_confidence(0) | probably_damaging(1) | TCGA-A8-A092-01 | Breast | breast invasive carcinoma | Female | <65 | III/IV | Chemotherapy | paclitaxel | CR | |
| HSPA2 | SNV | Missense_Mutation | c.916G>A | p.Glu306Lys | p.E306K | P54652 | protein_coding | deleterious_low_confidence(0) | probably_damaging(1) | TCGA-A8-A095-01 | Breast | breast invasive carcinoma | Female | <65 | I/II | Chemotherapy | 5-fluorouracil | CR | |
| HSPA2 | SNV | Missense_Mutation | c.1782N>T | p.Glu594Asp | p.E594D | P54652 | protein_coding | deleterious_low_confidence(0.02) | benign(0.327) | TCGA-B6-A0IH-01 | Breast | breast invasive carcinoma | Female | >=65 | III/IV | Unknown | Unknown | SD | |
| HSPA2 | SNV | Missense_Mutation | c.905G>A | p.Arg302His | p.R302H | P54652 | protein_coding | deleterious_low_confidence(0.02) | probably_damaging(1) | TCGA-D8-A1J8-01 | Breast | breast invasive carcinoma | Female | >=65 | I/II | Hormone Therapy | nolvadex | SD | |
| HSPA2 | SNV | Missense_Mutation | c.1192G>A | p.Asp398Asn | p.D398N | P54652 | protein_coding | deleterious_low_confidence(0) | probably_damaging(0.96) | TCGA-D8-A1JP-01 | Breast | breast invasive carcinoma | Female | >=65 | I/II | Hormone Therapy | tamoxiphen | SD | |
| HSPA2 | insertion | In_Frame_Ins | novel | c.1386_1387insCCCAAGATCCAGAAGCTGCTGCAG | p.Phe462_Asp463insProLysIleGlnLysLeuLeuGln | p.F462_D463insPKIQKLLQ | P54652 | protein_coding | TCGA-A2-A0T2-01 | Breast | breast invasive carcinoma | Female | >=65 | III/IV | Chemotherapy | xeloda | PD | ||
| HSPA2 | insertion | In_Frame_Ins | novel | c.1717_1718insTCTTCTTCCCAGAGGAGATATCCTCCATGG | p.Ile573_Leu574insPhePheProGluGluIleSerSerMetVal | p.I573_L574insFFPEEISSMV | P54652 | protein_coding | TCGA-A8-A09C-01 | Breast | breast invasive carcinoma | Female | >=65 | I/II | Unknown | Unknown | SD | ||
| HSPA2 | SNV | Missense_Mutation | c.514C>A | p.Arg172Ser | p.R172S | P54652 | protein_coding | deleterious_low_confidence(0.01) | benign(0.241) | TCGA-FU-A3EO-01 | Cervix | cervical & endocervical cancer | Female | <65 | I/II | Unknown | Unknown | SD | |
| HSPA2 | SNV | Missense_Mutation | rs765920858 | c.1771G>A | p.Glu591Lys | p.E591K | P54652 | protein_coding | deleterious_low_confidence(0.01) | benign(0.192) | TCGA-IR-A3LK-01 | Cervix | cervical & endocervical cancer | Female | >=65 | I/II | Chemotherapy | cisplatin | PD |
| Page: 1 2 3 4 5 6 7 8 9 |
Top |
Related drugs of malignant transformation related genes |
| Identification of chemicals and drugs interact with genes involved in malignant transfromation |
| (DGIdb 4.0) |
| Entrez ID | Symbol | Category | Interaction Types | Drug Claim Name | Drug Name | PMIDs |
| Page: 1 |

Copyright 2023-Present -The University of Texas Health Science Center at Houston |