
|
|||||
|
 | |
| |
| |
| |
| |
| |
|
Gene: HSPA14 |
Gene summary for HSPA14 |
| Gene information | Species | Human | Gene symbol | HSPA14 | Gene ID | 51182 |
| Gene name | heat shock protein family A (Hsp70) member 14 | |
| Gene Alias | HSP70-4 | |
| Cytomap | 10p13 | |
| Gene Type | protein-coding | GO ID | GO:0006457 | UniProtAcc | Q0VDF9 |
Top |
Malignant transformation analysis |
| Identification of the aberrant gene expression in precancerous and cancerous lesions by comparing the gene expression of stem-like cells in diseased tissues with normal stem cells |
| Entrez ID | Symbol | Replicates | Species | Organ | Tissue | Adj P-value | Log2FC | Malignancy |
| 51182 | HSPA14 | LZE4T | Human | Esophagus | ESCC | 3.46e-04 | 5.51e-02 | 0.0811 |
| 51182 | HSPA14 | LZE24T | Human | Esophagus | ESCC | 6.22e-10 | 1.90e-01 | 0.0596 |
| 51182 | HSPA14 | P1T-E | Human | Esophagus | ESCC | 1.29e-18 | 5.42e-01 | 0.0875 |
| 51182 | HSPA14 | P2T-E | Human | Esophagus | ESCC | 2.79e-28 | 4.04e-01 | 0.1177 |
| 51182 | HSPA14 | P4T-E | Human | Esophagus | ESCC | 2.07e-18 | 6.14e-01 | 0.1323 |
| 51182 | HSPA14 | P5T-E | Human | Esophagus | ESCC | 9.42e-16 | 3.83e-01 | 0.1327 |
| 51182 | HSPA14 | P8T-E | Human | Esophagus | ESCC | 4.60e-31 | 4.66e-01 | 0.0889 |
| 51182 | HSPA14 | P9T-E | Human | Esophagus | ESCC | 1.73e-14 | 1.75e-01 | 0.1131 |
| 51182 | HSPA14 | P10T-E | Human | Esophagus | ESCC | 4.92e-19 | 2.54e-01 | 0.116 |
| 51182 | HSPA14 | P11T-E | Human | Esophagus | ESCC | 1.24e-09 | 3.99e-01 | 0.1426 |
| 51182 | HSPA14 | P12T-E | Human | Esophagus | ESCC | 2.12e-26 | 5.88e-01 | 0.1122 |
| 51182 | HSPA14 | P15T-E | Human | Esophagus | ESCC | 8.54e-23 | 4.89e-01 | 0.1149 |
| 51182 | HSPA14 | P16T-E | Human | Esophagus | ESCC | 2.43e-20 | 4.54e-01 | 0.1153 |
| 51182 | HSPA14 | P17T-E | Human | Esophagus | ESCC | 2.65e-06 | 1.87e-01 | 0.1278 |
| 51182 | HSPA14 | P19T-E | Human | Esophagus | ESCC | 1.28e-02 | 4.96e-01 | 0.1662 |
| 51182 | HSPA14 | P20T-E | Human | Esophagus | ESCC | 6.31e-10 | 2.52e-01 | 0.1124 |
| 51182 | HSPA14 | P21T-E | Human | Esophagus | ESCC | 2.91e-29 | 6.11e-01 | 0.1617 |
| 51182 | HSPA14 | P22T-E | Human | Esophagus | ESCC | 5.39e-11 | 1.64e-01 | 0.1236 |
| 51182 | HSPA14 | P23T-E | Human | Esophagus | ESCC | 1.19e-26 | 6.06e-01 | 0.108 |
| 51182 | HSPA14 | P24T-E | Human | Esophagus | ESCC | 1.40e-12 | 3.72e-01 | 0.1287 |
| Page: 1 2 3 4 5 |
| Tissue | Expression Dynamics | Abbreviation |
| Esophagus |  | ESCC: Esophageal squamous cell carcinoma |
| HGIN: High-grade intraepithelial neoplasias | ||
| LGIN: Low-grade intraepithelial neoplasias | ||
| Liver | 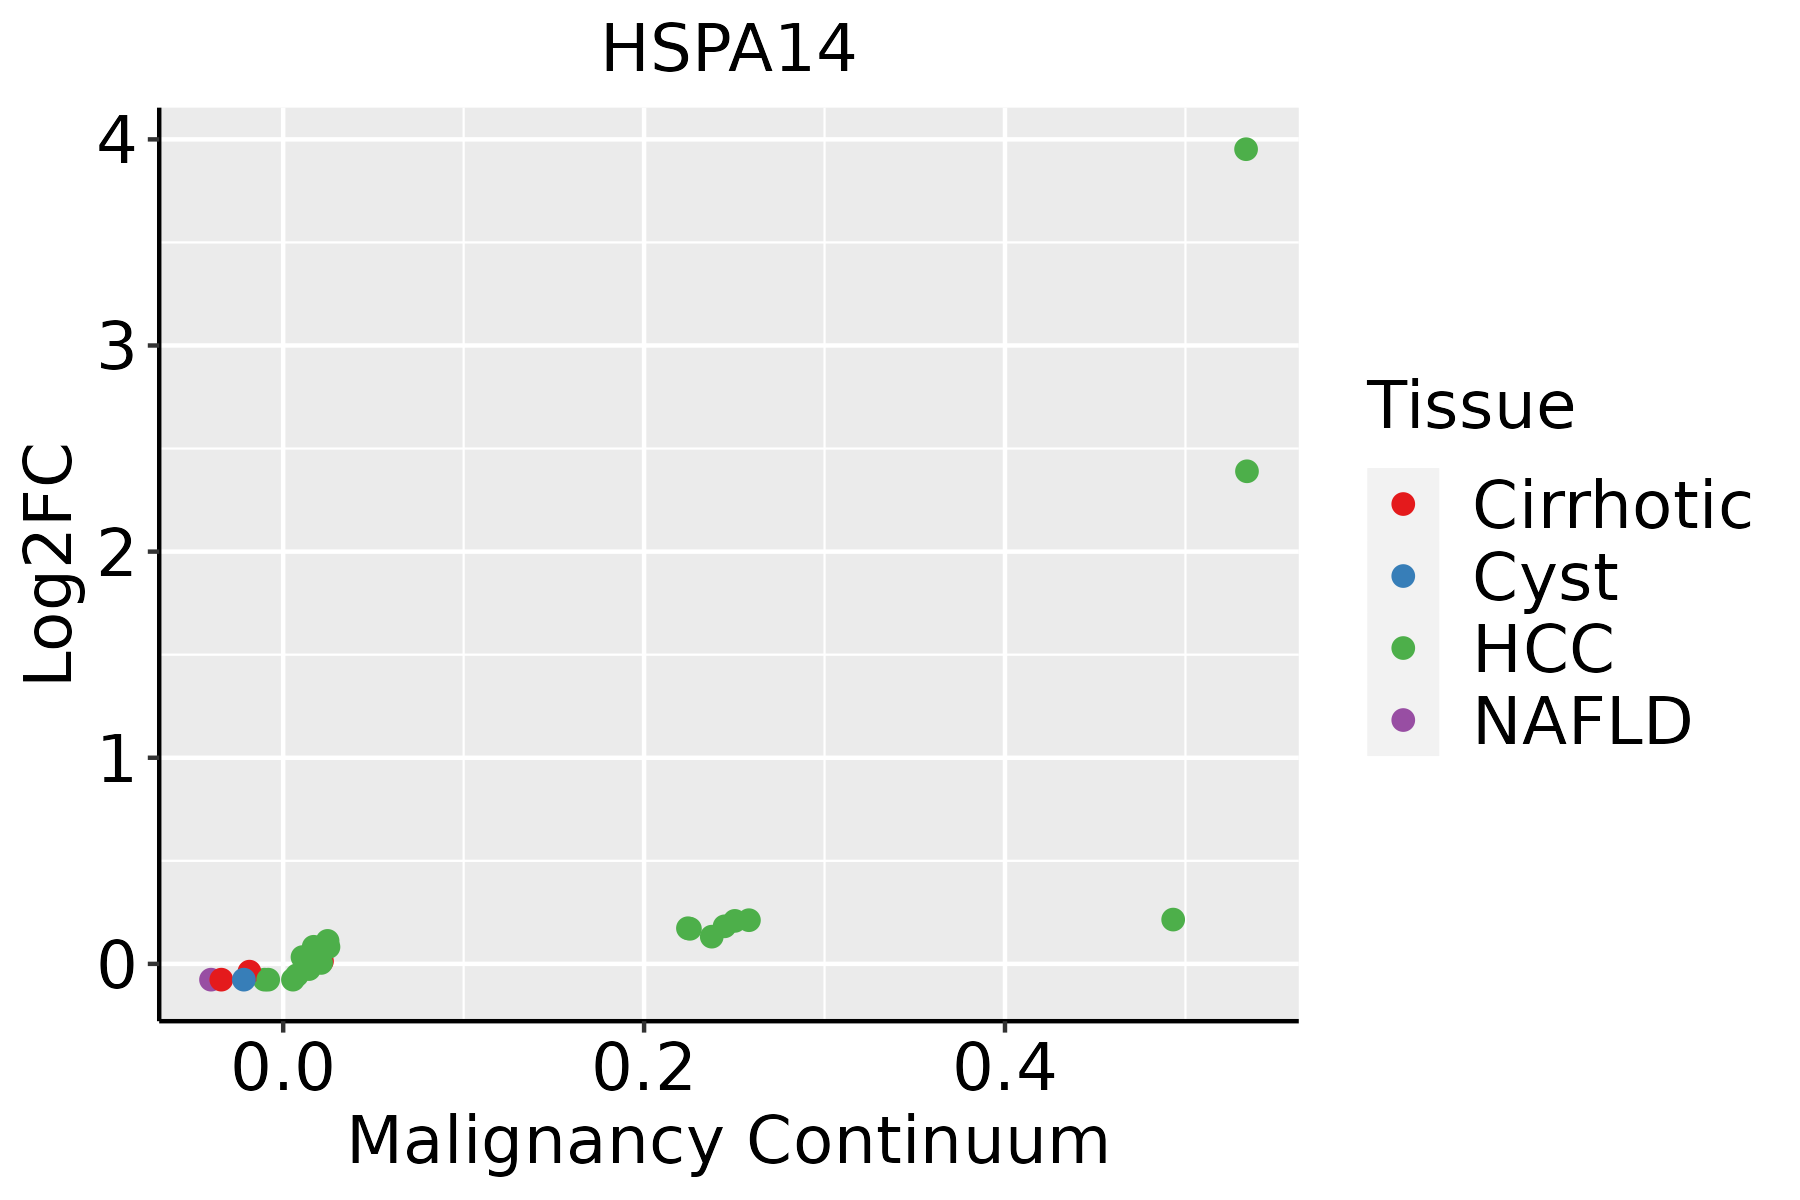 | HCC: Hepatocellular carcinoma |
| NAFLD: Non-alcoholic fatty liver disease | ||
| Oral Cavity | 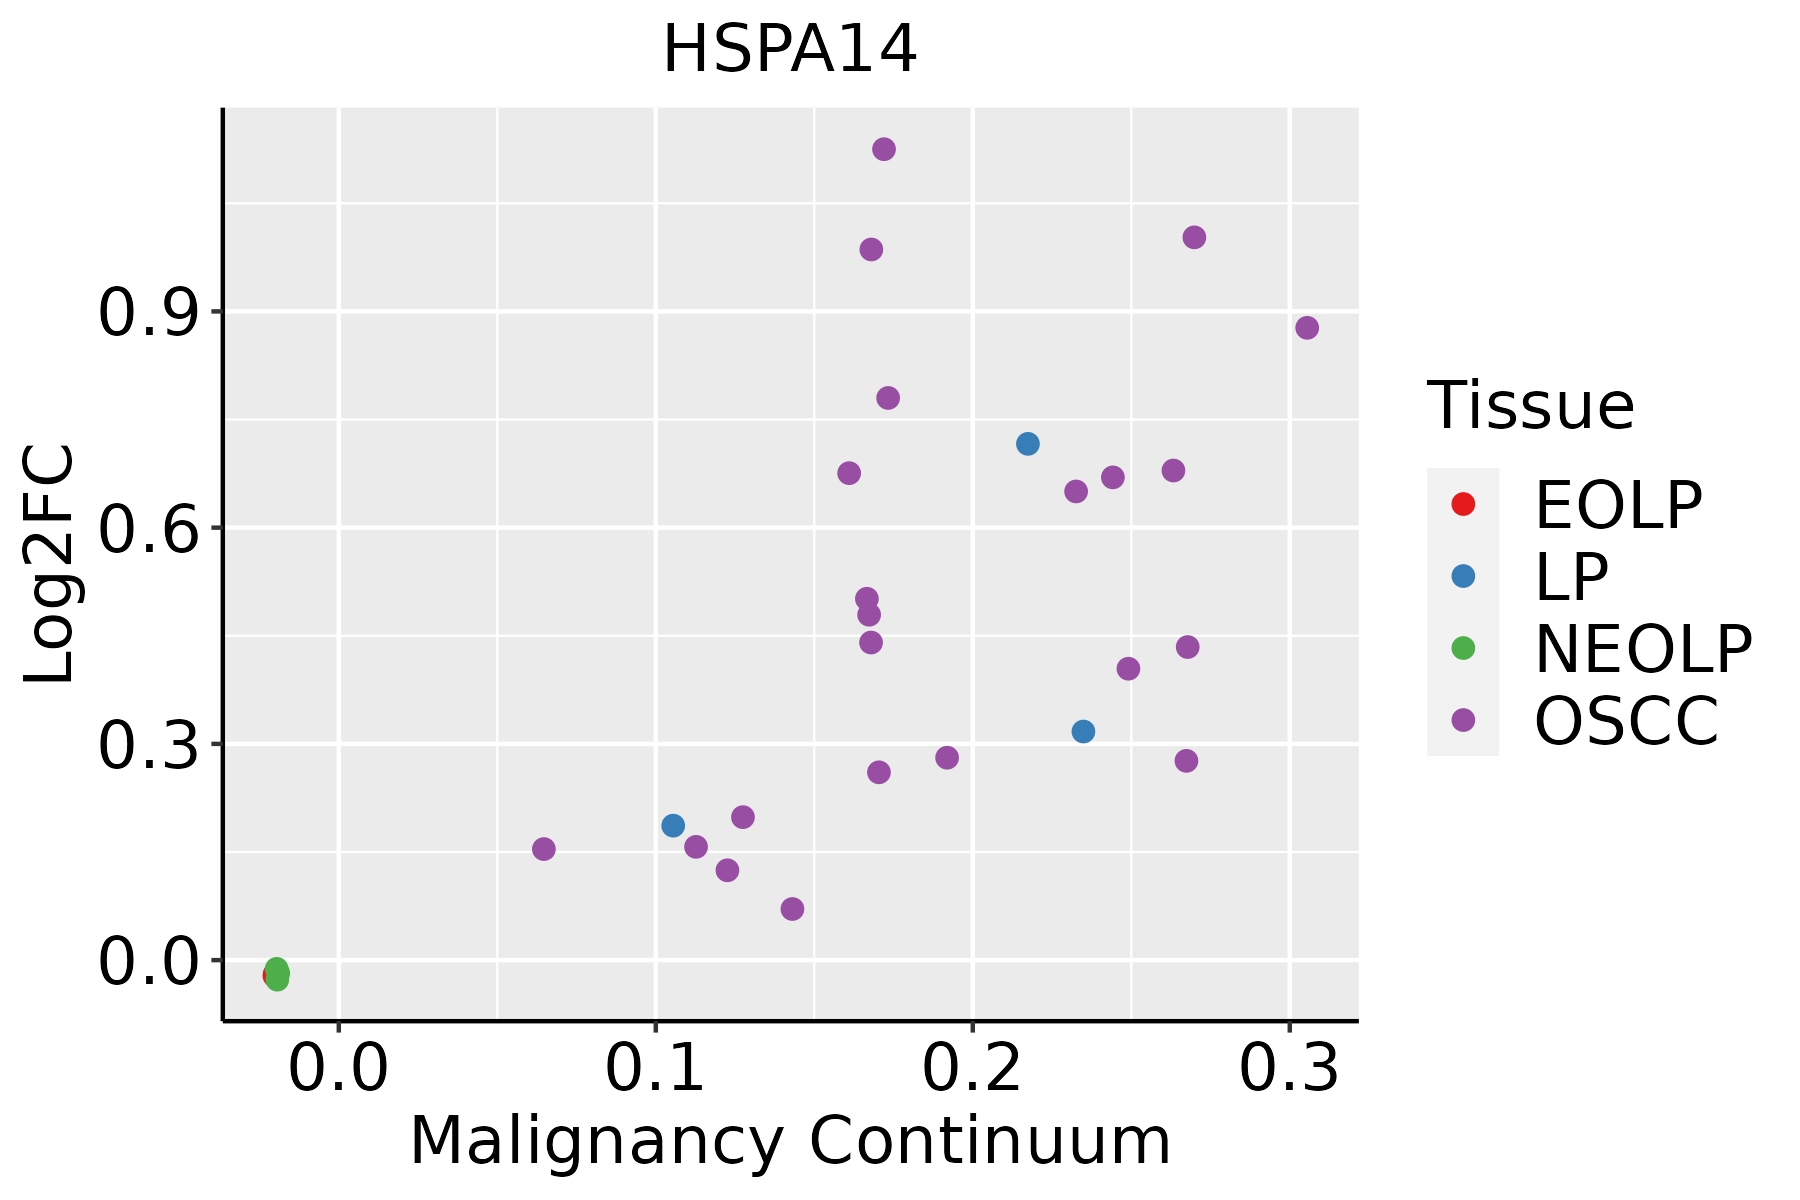 | EOLP: Erosive Oral lichen planus |
| LP: leukoplakia | ||
| NEOLP: Non-erosive oral lichen planus | ||
| OSCC: Oral squamous cell carcinoma | ||
| Skin | 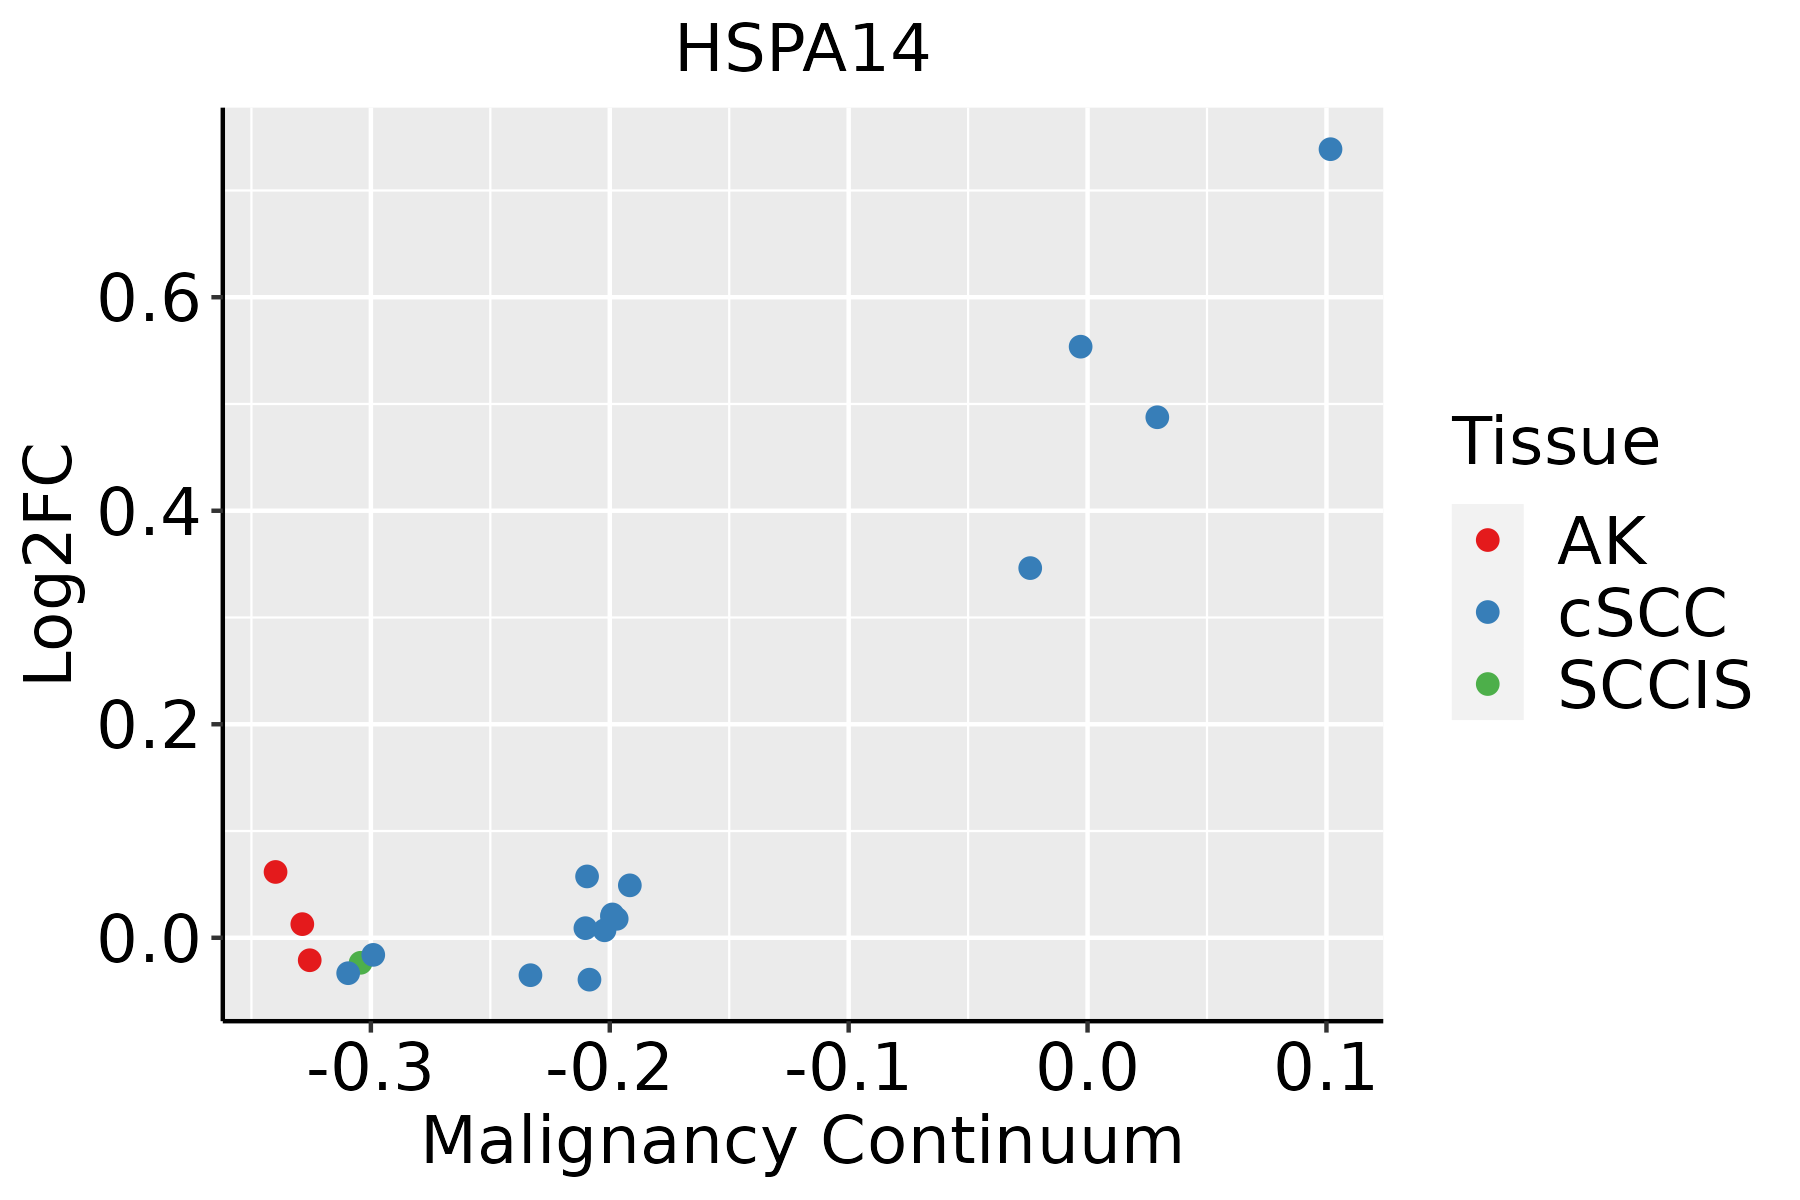 | AK: Actinic keratosis |
| cSCC: Cutaneous squamous cell carcinoma | ||
| SCCIS:squamous cell carcinoma in situ |
| ∗log2FC in expression of this searched gene in stem-like cells from each diseased tissue sample relative to stem-like cells in normal samples in each tissue plotted against the malignancy continuum. Samples are colored based on if they are from different disease stage. |
Top |
Malignant transformation related pathway analysis |
| Find out the enriched GO biological processes and KEGG pathways involved in transition from healthy to precancer to cancer |
| Tissue | Disease Stage | Enriched GO biological Processes |
| Colorectum | AD |  |
| Colorectum | SER |  |
| Colorectum | MSS |  |
| Colorectum | MSI-H |  |
| Colorectum | FAP |  |
| ∗Top 15 enriched GO BP terms are showed in the bar plot of each disease state in each tissue. Each row represents a significant GO biological process which is colored according to the -log10(p.adjust). |
| Page: 1 2 3 4 5 6 7 8 9 |
| GO ID | Tissue | Disease Stage | Description | Gene Ratio | Bg Ratio | pvalue | p.adjust | Count |
| GO:0006457110 | Esophagus | ESCC | protein folding | 163/8552 | 212/18723 | 1.13e-20 | 1.74e-18 | 163 |
| GO:0035966111 | Esophagus | ESCC | response to topologically incorrect protein | 125/8552 | 159/18723 | 1.44e-17 | 1.27e-15 | 125 |
| GO:0006986111 | Esophagus | ESCC | response to unfolded protein | 107/8552 | 137/18723 | 7.01e-15 | 3.87e-13 | 107 |
| GO:0035967111 | Esophagus | ESCC | cellular response to topologically incorrect protein | 90/8552 | 116/18723 | 1.94e-12 | 8.11e-11 | 90 |
| GO:0061077110 | Esophagus | ESCC | chaperone-mediated protein folding | 56/8552 | 67/18723 | 1.52e-10 | 4.36e-09 | 56 |
| GO:0034620111 | Esophagus | ESCC | cellular response to unfolded protein | 74/8552 | 96/18723 | 3.10e-10 | 8.66e-09 | 74 |
| GO:0006458110 | Esophagus | ESCC | 'de novo' protein folding | 36/8552 | 43/18723 | 2.90e-07 | 4.20e-06 | 36 |
| GO:0051084110 | Esophagus | ESCC | 'de novo' posttranslational protein folding | 32/8552 | 39/18723 | 3.27e-06 | 3.65e-05 | 32 |
| GO:0042026110 | Esophagus | ESCC | protein refolding | 20/8552 | 23/18723 | 4.97e-05 | 3.86e-04 | 20 |
| GO:0051085110 | Esophagus | ESCC | chaperone cofactor-dependent protein refolding | 27/8552 | 34/18723 | 6.01e-05 | 4.62e-04 | 27 |
| GO:000645712 | Liver | HCC | protein folding | 160/7958 | 212/18723 | 1.07e-22 | 1.88e-20 | 160 |
| GO:003596612 | Liver | HCC | response to topologically incorrect protein | 123/7958 | 159/18723 | 2.60e-19 | 3.44e-17 | 123 |
| GO:000698612 | Liver | HCC | response to unfolded protein | 103/7958 | 137/18723 | 6.50e-15 | 4.48e-13 | 103 |
| GO:003596712 | Liver | HCC | cellular response to topologically incorrect protein | 89/7958 | 116/18723 | 5.61e-14 | 3.39e-12 | 89 |
| GO:006107712 | Liver | HCC | chaperone-mediated protein folding | 56/7958 | 67/18723 | 4.86e-12 | 2.14e-10 | 56 |
| GO:003462012 | Liver | HCC | cellular response to unfolded protein | 71/7958 | 96/18723 | 3.70e-10 | 1.22e-08 | 71 |
| GO:000645812 | Liver | HCC | 'de novo' protein folding | 36/7958 | 43/18723 | 3.15e-08 | 7.10e-07 | 36 |
| GO:005108412 | Liver | HCC | 'de novo' posttranslational protein folding | 32/7958 | 39/18723 | 4.73e-07 | 7.69e-06 | 32 |
| GO:005108512 | Liver | HCC | chaperone cofactor-dependent protein refolding | 27/7958 | 34/18723 | 1.24e-05 | 1.39e-04 | 27 |
| GO:004202612 | Liver | HCC | protein refolding | 19/7958 | 23/18723 | 9.73e-05 | 8.40e-04 | 19 |
| Page: 1 2 3 |
| Pathway ID | Tissue | Disease Stage | Description | Gene Ratio | Bg Ratio | pvalue | p.adjust | qvalue | Count |
| Page: 1 |
Top |
Cell-cell communication analysis |
| Identification of potential cell-cell interactions between two cell types and their ligand-receptor pairs for different disease states |
| Ligand | Receptor | LRpair | Pathway | Tissue | Disease Stage |
| Page: 1 |
Top |
Single-cell gene regulatory network inference analysis |
| Find out the significant the regulons (TFs) and the target genes of each regulon across cell types for different disease states |
| TF | Cell Type | Tissue | Disease Stage | Target Gene | RSS | Regulon Activity |
| ∗The dot plots of a searched regulon are shown for all cell subpopulations in each disease state of each tissue based on the regulon specific score inferred using pySCENIC and by calculating the average expression. |
| Page: 1 |
Top |
Somatic mutation of malignant transformation related genes |
| Annotation of somatic variants for genes involved in malignant transformation |
| Hugo Symbol | Variant Class | Variant Classification | dbSNP RS | HGVSc | HGVSp | HGVSp Short | SWISSPROT | BIOTYPE | SIFT | PolyPhen | Tumor Sample Barcode | Tissue | Histology | Sex | Age | Stage | Therapy Types | Drugs | Outcome |
| HSPA14 | SNV | Missense_Mutation | c.1030C>G | p.Leu344Val | p.L344V | Q0VDF9 | protein_coding | tolerated(0.05) | possibly_damaging(0.871) | TCGA-A8-A07R-01 | Breast | breast invasive carcinoma | Female | >=65 | III/IV | Ancillary | zoledronic | SD | |
| HSPA14 | SNV | Missense_Mutation | rs769292701 | c.1420C>T | p.Arg474Cys | p.R474C | Q0VDF9 | protein_coding | deleterious(0.02) | possibly_damaging(0.545) | TCGA-AN-A0AK-01 | Breast | breast invasive carcinoma | Female | >=65 | I/II | Unknown | Unknown | SD |
| HSPA14 | SNV | Missense_Mutation | c.1456G>A | p.Gly486Arg | p.G486R | Q0VDF9 | protein_coding | deleterious(0) | probably_damaging(1) | TCGA-AN-A0FL-01 | Breast | breast invasive carcinoma | Female | <65 | I/II | Unknown | Unknown | SD | |
| HSPA14 | SNV | Missense_Mutation | c.389C>G | p.Ser130Cys | p.S130C | Q0VDF9 | protein_coding | deleterious(0.01) | possibly_damaging(0.812) | TCGA-C8-A1HM-01 | Breast | breast invasive carcinoma | Female | >=65 | I/II | Chemotherapy | doxorubicin | CR | |
| HSPA14 | SNV | Missense_Mutation | c.1033N>G | p.Gln345Glu | p.Q345E | Q0VDF9 | protein_coding | deleterious(0) | probably_damaging(0.998) | TCGA-E2-A1L7-01 | Breast | breast invasive carcinoma | Female | <65 | III/IV | Chemotherapy | cyclophosphamide | PD | |
| HSPA14 | SNV | Missense_Mutation | rs199812378 | c.380N>T | p.Thr127Met | p.T127M | Q0VDF9 | protein_coding | deleterious(0.02) | possibly_damaging(0.623) | TCGA-EA-A97N-01 | Cervix | cervical & endocervical cancer | Female | <65 | I/II | Unknown | Unknown | SD |
| HSPA14 | SNV | Missense_Mutation | rs769292701 | c.1420N>T | p.Arg474Cys | p.R474C | Q0VDF9 | protein_coding | deleterious(0.02) | possibly_damaging(0.545) | TCGA-AA-3984-01 | Colorectum | colon adenocarcinoma | Female | <65 | I/II | Unknown | Unknown | SD |
| HSPA14 | SNV | Missense_Mutation | novel | c.307N>T | p.Asp103Tyr | p.D103Y | Q0VDF9 | protein_coding | deleterious(0.03) | possibly_damaging(0.796) | TCGA-CA-6717-01 | Colorectum | colon adenocarcinoma | Male | <65 | I/II | Chemotherapy | oxaliplatin | CR |
| HSPA14 | SNV | Missense_Mutation | novel | c.748G>A | p.Asp250Asn | p.D250N | Q0VDF9 | protein_coding | deleterious(0.02) | benign(0.212) | TCGA-AF-2687-01 | Colorectum | rectum adenocarcinoma | Male | <65 | III/IV | Chemotherapy | xeloda | PD |
| HSPA14 | SNV | Missense_Mutation | novel | c.812C>A | p.Ser271Tyr | p.S271Y | Q0VDF9 | protein_coding | deleterious(0.02) | possibly_damaging(0.832) | TCGA-F5-6814-01 | Colorectum | rectum adenocarcinoma | Male | <65 | I/II | Unknown | Unknown | SD |
| Page: 1 2 3 4 5 |
Top |
Related drugs of malignant transformation related genes |
| Identification of chemicals and drugs interact with genes involved in malignant transfromation |
| (DGIdb 4.0) |
| Entrez ID | Symbol | Category | Interaction Types | Drug Claim Name | Drug Name | PMIDs |
| Page: 1 |

Copyright 2023-Present -The University of Texas Health Science Center at Houston |