| Tissue | Expression Dynamics | Abbreviation |
| Cervix | 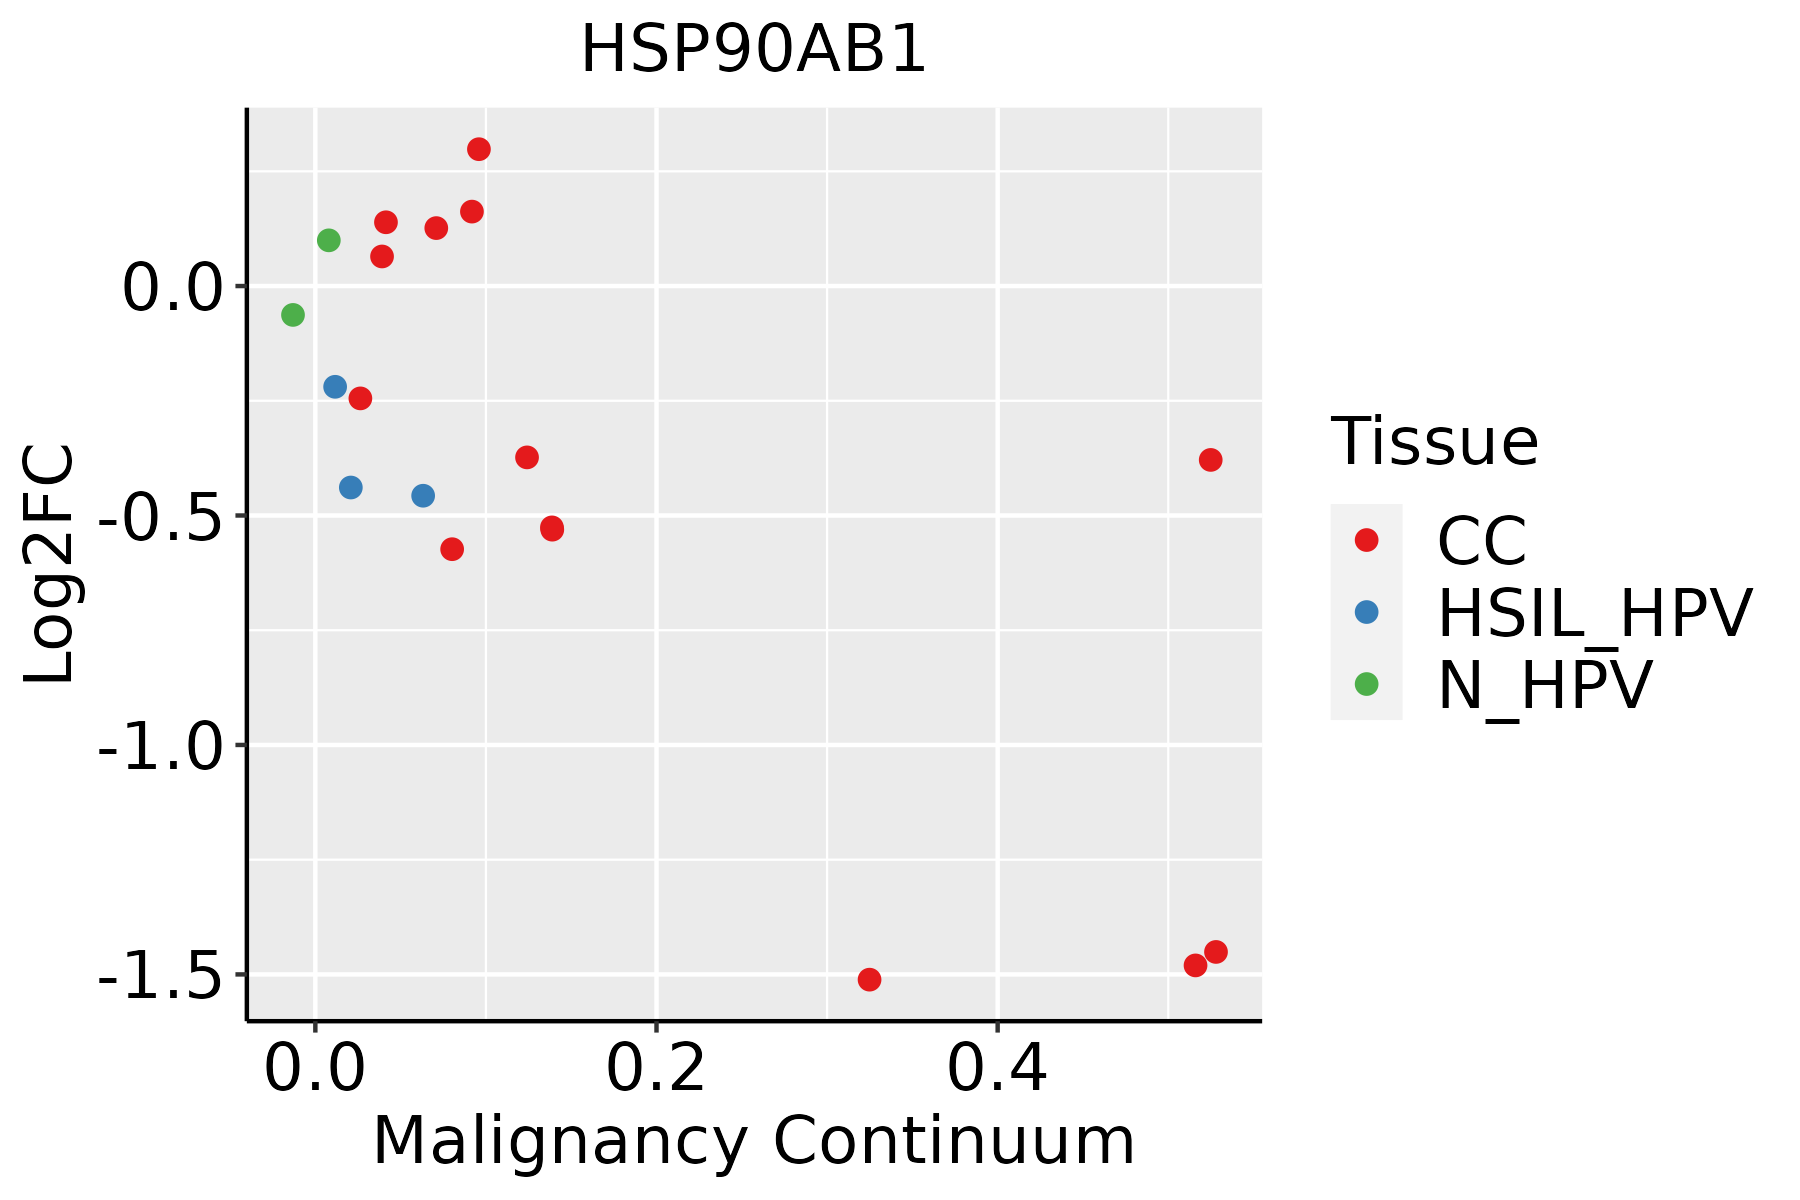 | CC: Cervix cancer |
| HSIL_HPV: HPV-infected high-grade squamous intraepithelial lesions |
| N_HPV: HPV-infected normal cervix |
| Colorectum (GSE201348) |  | FAP: Familial adenomatous polyposis |
| CRC: Colorectal cancer |
| Colorectum (HTA11) |  | AD: Adenomas |
| SER: Sessile serrated lesions |
| MSI-H: Microsatellite-high colorectal cancer |
| MSS: Microsatellite stable colorectal cancer |
| Endometrium |  | AEH: Atypical endometrial hyperplasia |
| EEC: Endometrioid Cancer |
| Esophagus | 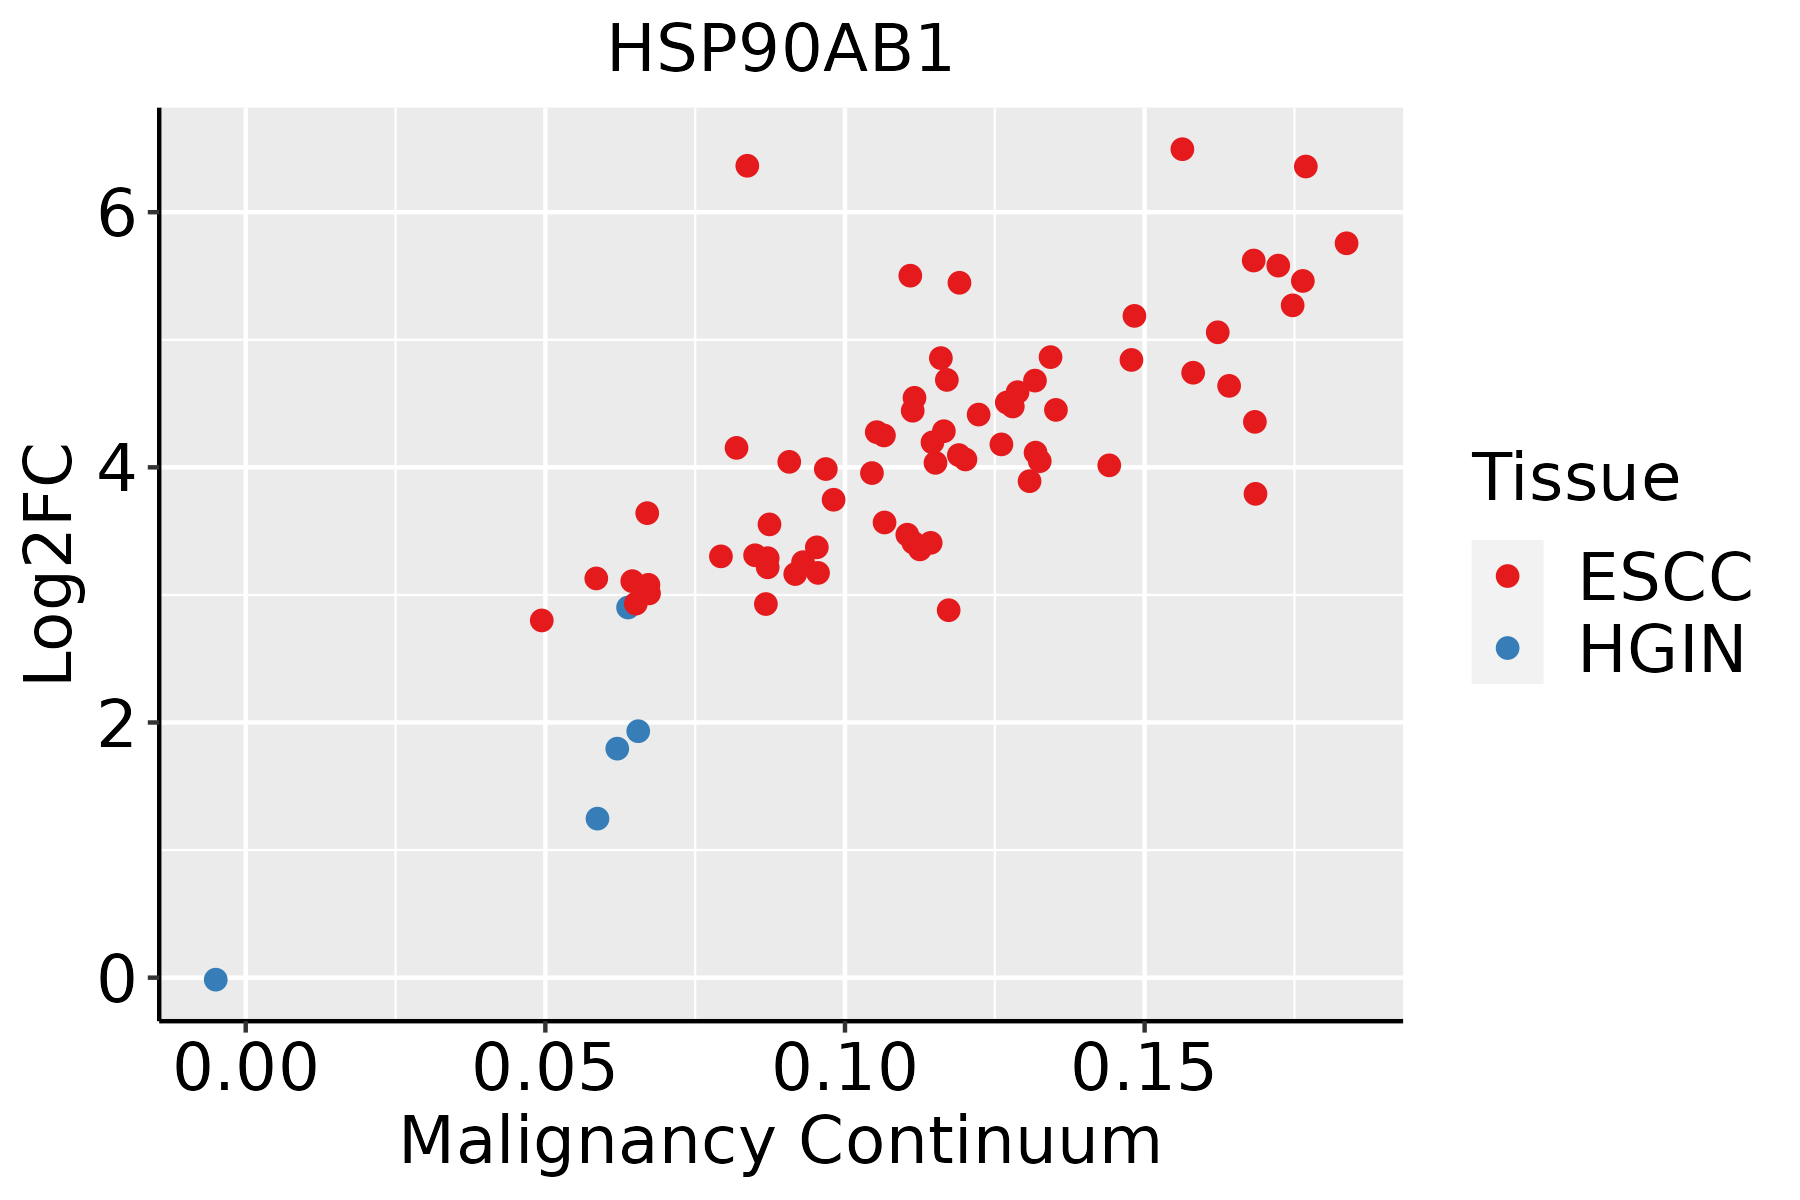 | ESCC: Esophageal squamous cell carcinoma |
| HGIN: High-grade intraepithelial neoplasias |
| LGIN: Low-grade intraepithelial neoplasias |
| GC | 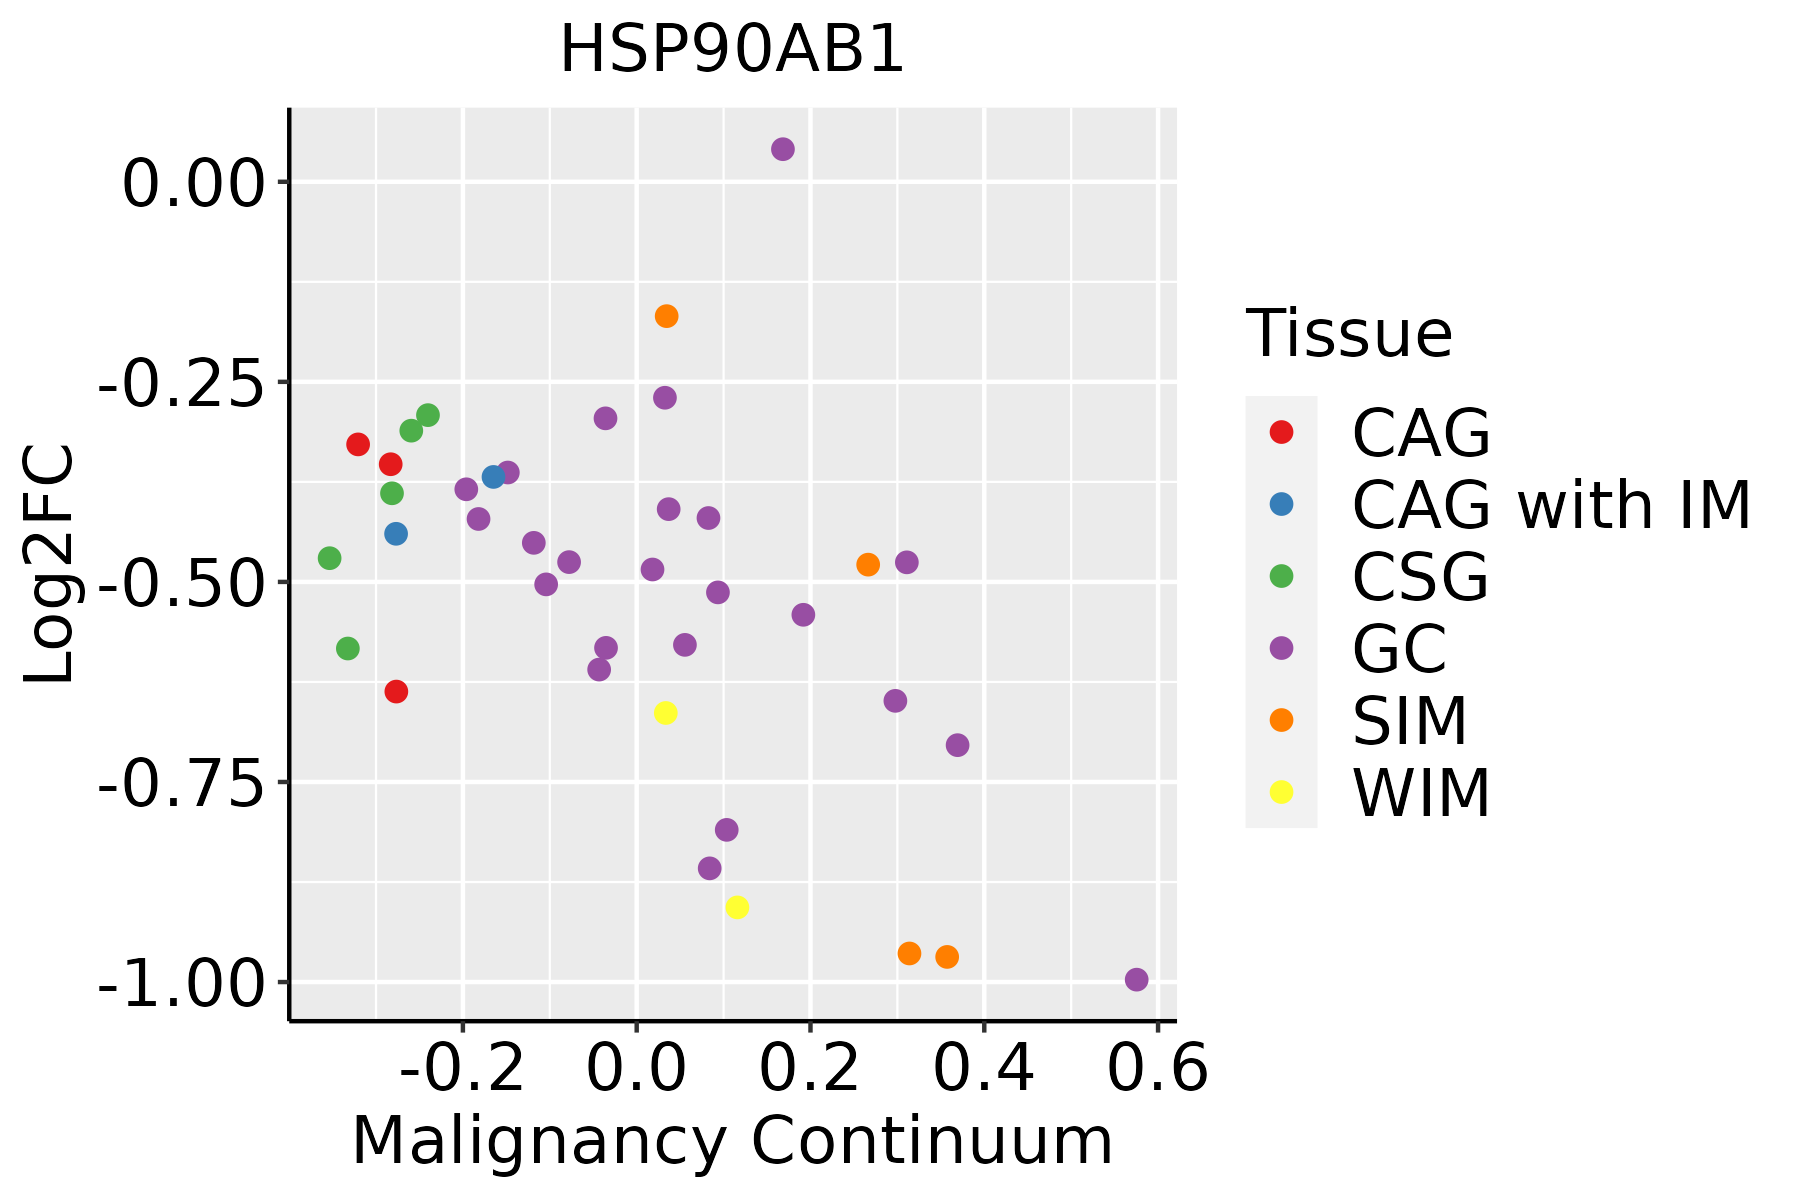 | CAG: Chronic atrophic gastritis |
| CAG with IM: Chronic atrophic gastritis with intestinal metaplasia |
| CSG: Chronic superficial gastritis |
| GC: Gastric cancer |
| SIM: Severe intestinal metaplasia |
| WIM: Wild intestinal metaplasia |
| Liver |  | HCC: Hepatocellular carcinoma |
| NAFLD: Non-alcoholic fatty liver disease |
| Oral Cavity | 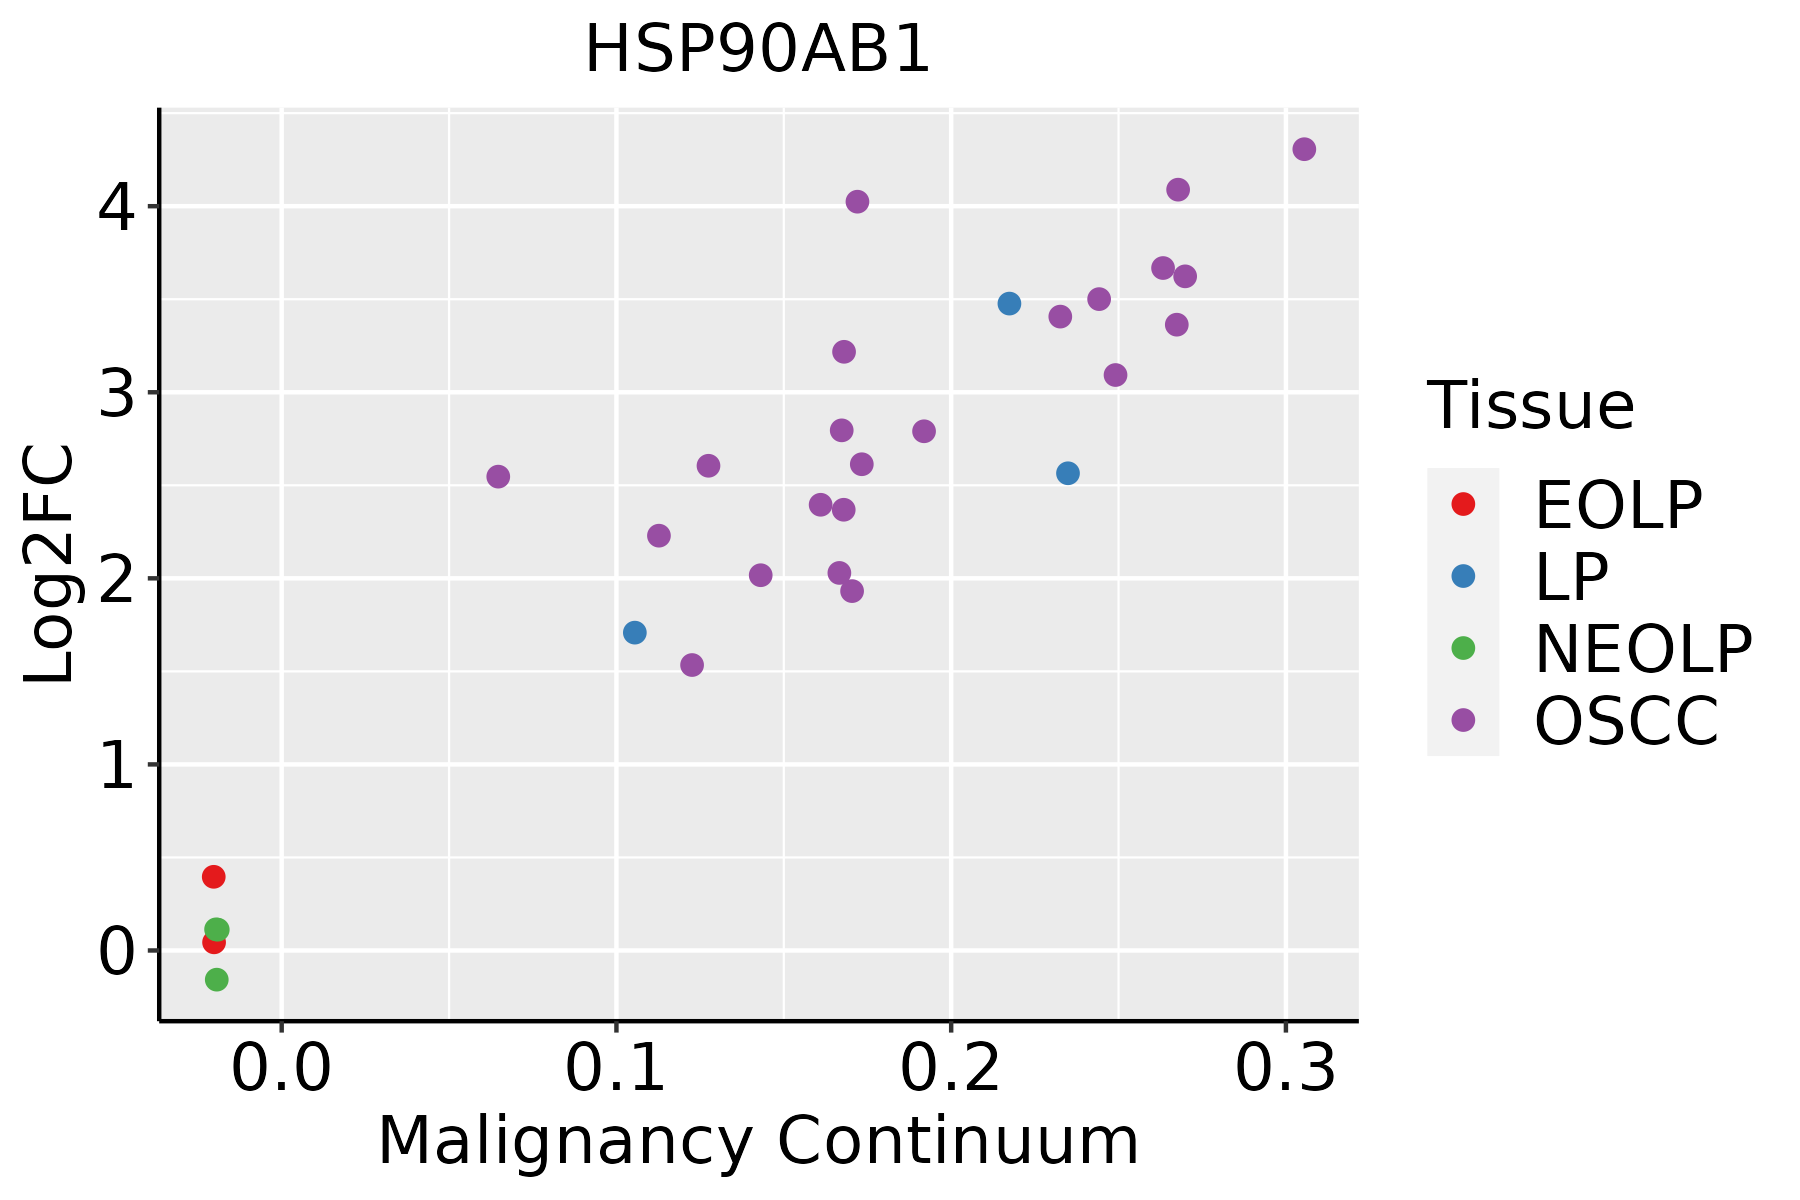 | EOLP: Erosive Oral lichen planus |
| LP: leukoplakia |
| NEOLP: Non-erosive oral lichen planus |
| OSCC: Oral squamous cell carcinoma |
| Prostate |  | BPH: Benign Prostatic Hyperplasia |
| Skin | 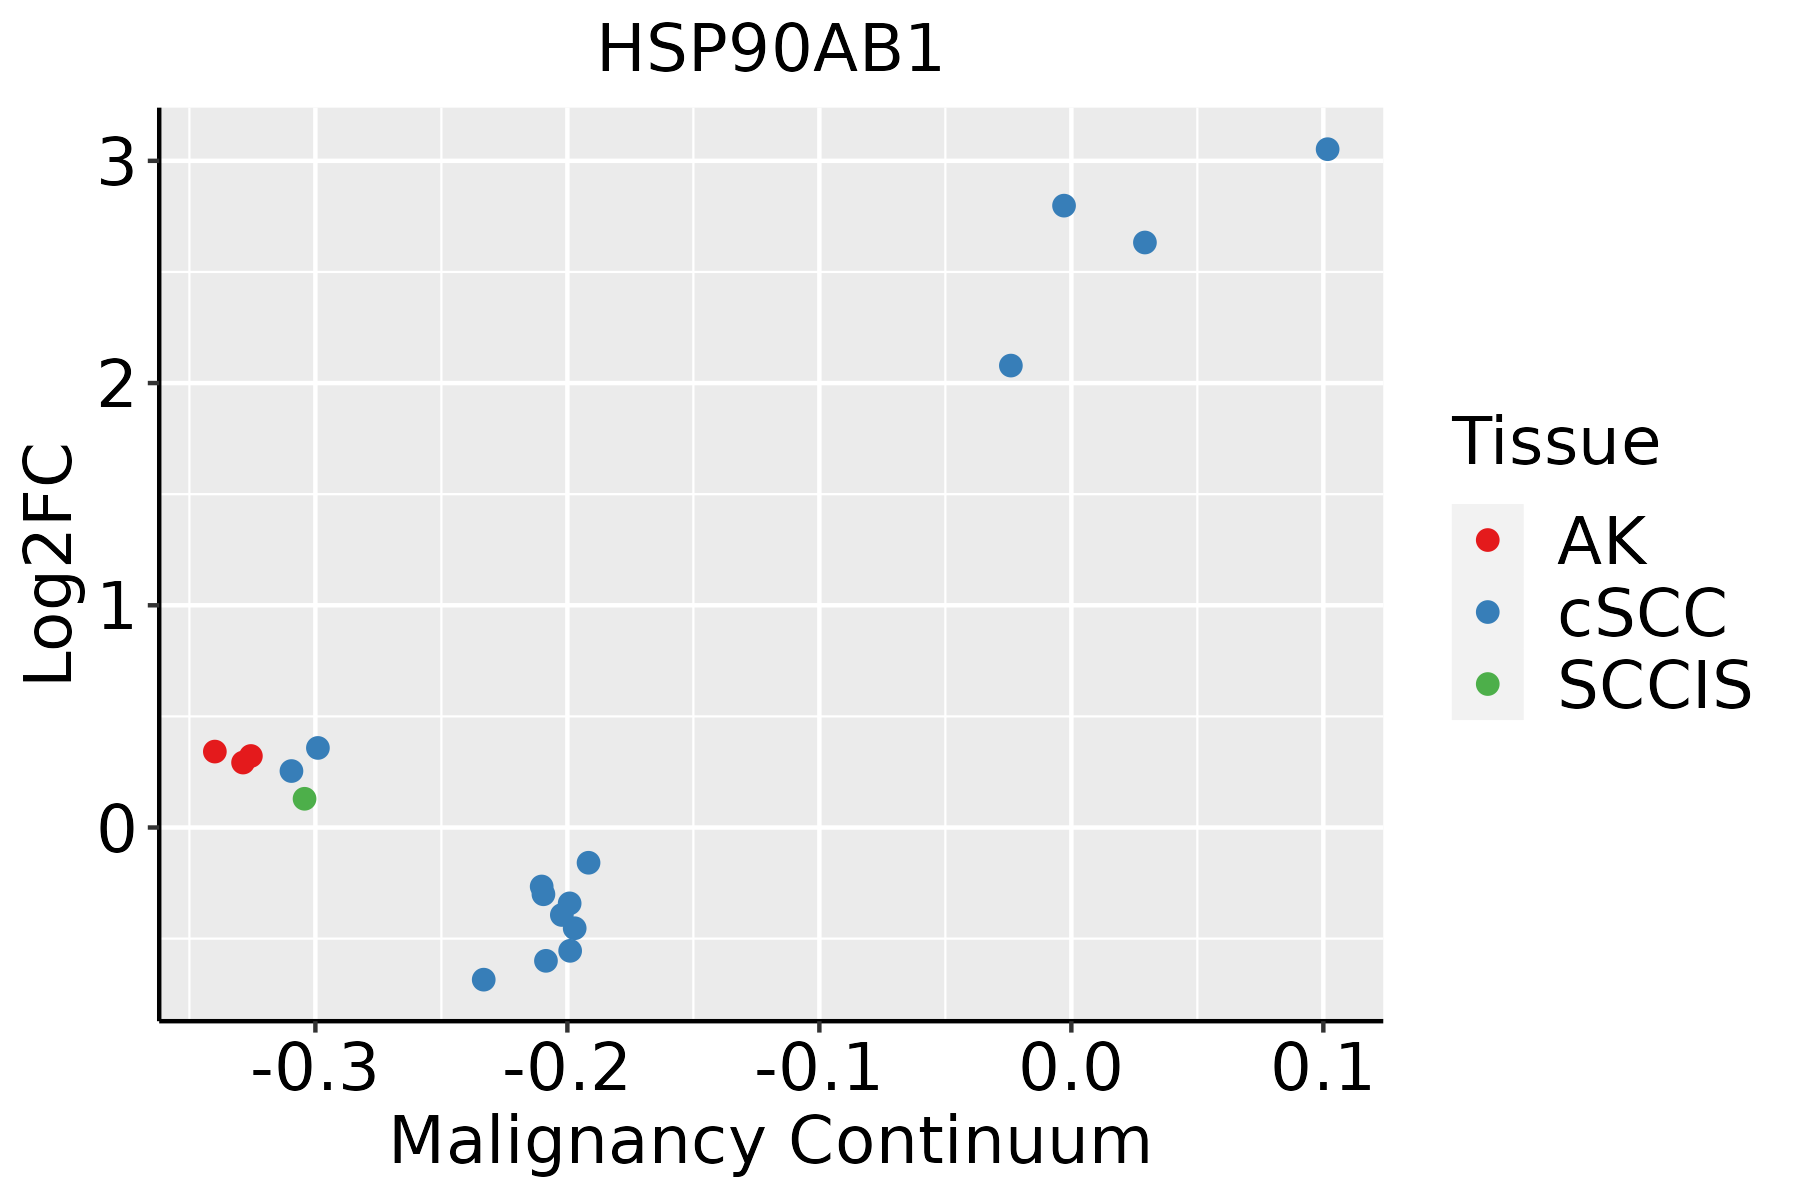 | AK: Actinic keratosis |
| cSCC: Cutaneous squamous cell carcinoma |
| SCCIS:squamous cell carcinoma in situ |
| Thyroid | 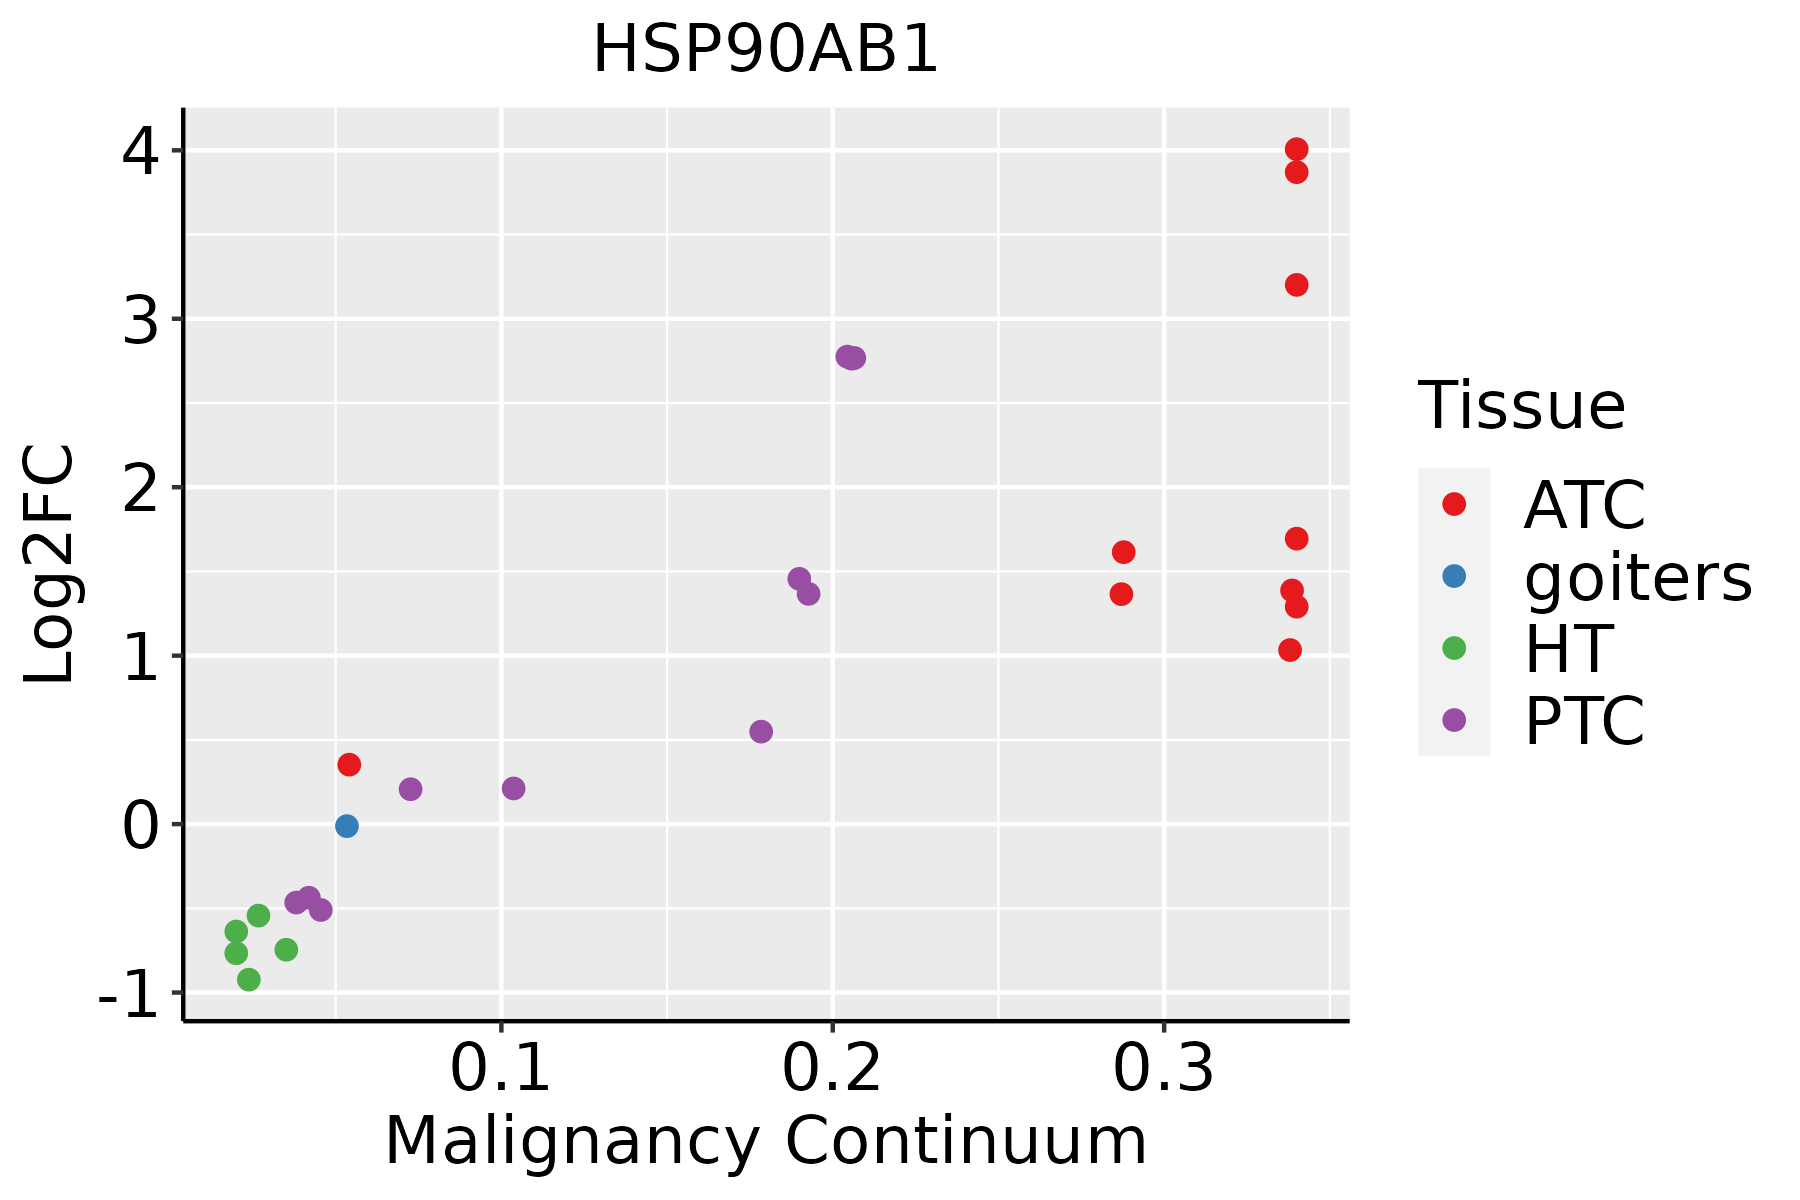 | ATC: Anaplastic thyroid cancer |
| HT: Hashimoto's thyroiditis |
| PTC: Papillary thyroid cancer |
| GO ID | Tissue | Disease Stage | Description | Gene Ratio | Bg Ratio | pvalue | p.adjust | Count |
| GO:001603210 | Cervix | CC | viral process | 109/2311 | 415/18723 | 5.40e-15 | 6.46e-12 | 109 |
| GO:004217610 | Cervix | CC | regulation of protein catabolic process | 104/2311 | 391/18723 | 9.39e-15 | 9.36e-12 | 104 |
| GO:001905810 | Cervix | CC | viral life cycle | 87/2311 | 317/18723 | 2.20e-13 | 1.20e-10 | 87 |
| GO:190336210 | Cervix | CC | regulation of cellular protein catabolic process | 72/2311 | 255/18723 | 5.98e-12 | 2.10e-09 | 72 |
| GO:00071639 | Cervix | CC | establishment or maintenance of cell polarity | 63/2311 | 218/18723 | 4.25e-11 | 8.76e-09 | 63 |
| GO:001049810 | Cervix | CC | proteasomal protein catabolic process | 111/2311 | 490/18723 | 8.98e-11 | 1.58e-08 | 111 |
| GO:00725949 | Cervix | CC | establishment of protein localization to organelle | 99/2311 | 422/18723 | 1.23e-10 | 2.11e-08 | 99 |
| GO:190332010 | Cervix | CC | regulation of protein modification by small protein conjugation or removal | 66/2311 | 242/18723 | 2.31e-10 | 3.46e-08 | 66 |
| GO:190382910 | Cervix | CC | positive regulation of cellular protein localization | 72/2311 | 276/18723 | 3.20e-10 | 4.46e-08 | 72 |
| GO:003139610 | Cervix | CC | regulation of protein ubiquitination | 59/2311 | 210/18723 | 5.90e-10 | 7.51e-08 | 59 |
| GO:190305010 | Cervix | CC | regulation of proteolysis involved in cellular protein catabolic process | 60/2311 | 221/18723 | 1.82e-09 | 1.98e-07 | 60 |
| GO:004440310 | Cervix | CC | biological process involved in symbiotic interaction | 71/2311 | 290/18723 | 7.94e-09 | 6.98e-07 | 71 |
| GO:003367410 | Cervix | CC | positive regulation of kinase activity | 101/2311 | 467/18723 | 8.66e-09 | 7.22e-07 | 101 |
| GO:200005810 | Cervix | CC | regulation of ubiquitin-dependent protein catabolic process | 47/2311 | 164/18723 | 1.63e-08 | 1.25e-06 | 47 |
| GO:004316110 | Cervix | CC | proteasome-mediated ubiquitin-dependent protein catabolic process | 91/2311 | 412/18723 | 1.65e-08 | 1.25e-06 | 91 |
| GO:005122210 | Cervix | CC | positive regulation of protein transport | 72/2311 | 303/18723 | 2.36e-08 | 1.70e-06 | 72 |
| GO:004586110 | Cervix | CC | negative regulation of proteolysis | 80/2311 | 351/18723 | 2.88e-08 | 1.98e-06 | 80 |
| GO:00069139 | Cervix | CC | nucleocytoplasmic transport | 71/2311 | 301/18723 | 4.04e-08 | 2.54e-06 | 71 |
| GO:00511699 | Cervix | CC | nuclear transport | 71/2311 | 301/18723 | 4.04e-08 | 2.54e-06 | 71 |
| GO:00300108 | Cervix | CC | establishment of cell polarity | 42/2311 | 143/18723 | 4.30e-08 | 2.62e-06 | 42 |
| Pathway ID | Tissue | Disease Stage | Description | Gene Ratio | Bg Ratio | pvalue | p.adjust | qvalue | Count |
| hsa0541820 | Cervix | CC | Fluid shear stress and atherosclerosis | 50/1267 | 139/8465 | 5.71e-10 | 1.32e-08 | 7.81e-09 | 50 |
| hsa0461220 | Cervix | CC | Antigen processing and presentation | 34/1267 | 78/8465 | 1.06e-09 | 2.14e-08 | 1.26e-08 | 34 |
| hsa0513220 | Cervix | CC | Salmonella infection | 74/1267 | 249/8465 | 1.33e-09 | 2.54e-08 | 1.50e-08 | 74 |
| hsa0541720 | Cervix | CC | Lipid and atherosclerosis | 65/1267 | 215/8465 | 6.47e-09 | 1.10e-07 | 6.52e-08 | 65 |
| hsa0414120 | Cervix | CC | Protein processing in endoplasmic reticulum | 55/1267 | 174/8465 | 1.74e-08 | 2.68e-07 | 1.58e-07 | 55 |
| hsa0491520 | Cervix | CC | Estrogen signaling pathway | 44/1267 | 138/8465 | 3.55e-07 | 3.97e-06 | 2.35e-06 | 44 |
| hsa0465718 | Cervix | CC | IL-17 signaling pathway | 31/1267 | 94/8465 | 8.71e-06 | 7.43e-05 | 4.39e-05 | 31 |
| hsa052157 | Cervix | CC | Prostate cancer | 27/1267 | 97/8465 | 7.54e-04 | 3.39e-03 | 2.01e-03 | 27 |
| hsa046596 | Cervix | CC | Th17 cell differentiation | 28/1267 | 108/8465 | 1.99e-03 | 7.98e-03 | 4.72e-03 | 28 |
| hsa046213 | Cervix | CC | NOD-like receptor signaling pathway | 41/1267 | 186/8465 | 5.90e-03 | 1.95e-02 | 1.15e-02 | 41 |
| hsa05418110 | Cervix | CC | Fluid shear stress and atherosclerosis | 50/1267 | 139/8465 | 5.71e-10 | 1.32e-08 | 7.81e-09 | 50 |
| hsa04612110 | Cervix | CC | Antigen processing and presentation | 34/1267 | 78/8465 | 1.06e-09 | 2.14e-08 | 1.26e-08 | 34 |
| hsa05132110 | Cervix | CC | Salmonella infection | 74/1267 | 249/8465 | 1.33e-09 | 2.54e-08 | 1.50e-08 | 74 |
| hsa05417110 | Cervix | CC | Lipid and atherosclerosis | 65/1267 | 215/8465 | 6.47e-09 | 1.10e-07 | 6.52e-08 | 65 |
| hsa04141110 | Cervix | CC | Protein processing in endoplasmic reticulum | 55/1267 | 174/8465 | 1.74e-08 | 2.68e-07 | 1.58e-07 | 55 |
| hsa04915110 | Cervix | CC | Estrogen signaling pathway | 44/1267 | 138/8465 | 3.55e-07 | 3.97e-06 | 2.35e-06 | 44 |
| hsa0465719 | Cervix | CC | IL-17 signaling pathway | 31/1267 | 94/8465 | 8.71e-06 | 7.43e-05 | 4.39e-05 | 31 |
| hsa0521512 | Cervix | CC | Prostate cancer | 27/1267 | 97/8465 | 7.54e-04 | 3.39e-03 | 2.01e-03 | 27 |
| hsa0465911 | Cervix | CC | Th17 cell differentiation | 28/1267 | 108/8465 | 1.99e-03 | 7.98e-03 | 4.72e-03 | 28 |
| hsa0462112 | Cervix | CC | NOD-like receptor signaling pathway | 41/1267 | 186/8465 | 5.90e-03 | 1.95e-02 | 1.15e-02 | 41 |
| Hugo Symbol | Variant Class | Variant Classification | dbSNP RS | HGVSc | HGVSp | HGVSp Short | SWISSPROT | BIOTYPE | SIFT | PolyPhen | Tumor Sample Barcode | Tissue | Histology | Sex | Age | Stage | Therapy Types | Drugs | Outcome |
| HSP90AB1 | SNV | Missense_Mutation | | c.1994C>G | p.Ser665Cys | p.S665C | P08238 | protein_coding | deleterious(0.03) | benign(0.078) | TCGA-AC-A23H-01 | Breast | breast invasive carcinoma | Female | >=65 | I/II | Unknown | Unknown | PD |
| HSP90AB1 | SNV | Missense_Mutation | rs756933263 | c.1655N>T | p.Lys552Met | p.K552M | P08238 | protein_coding | deleterious(0.01) | probably_damaging(0.951) | TCGA-D8-A1Y1-01 | Breast | breast invasive carcinoma | Female | >=65 | III/IV | Hormone Therapy | tamoxiphen | PD |
| HSP90AB1 | SNV | Missense_Mutation | | c.1367N>T | p.Arg456Leu | p.R456L | P08238 | protein_coding | deleterious(0) | possibly_damaging(0.906) | TCGA-E2-A1IJ-01 | Breast | breast invasive carcinoma | Female | <65 | I/II | Hormone Therapy | arimidex | SD |
| HSP90AB1 | SNV | Missense_Mutation | novel | c.748N>G | p.Ile250Val | p.I250V | P08238 | protein_coding | tolerated(0.42) | benign(0) | TCGA-LL-A7T0-01 | Breast | breast invasive carcinoma | Female | >=65 | I/II | Unknown | Unknown | SD |
| HSP90AB1 | deletion | Frame_Shift_Del | novel | c.217_233delATTGACATCATCCCCAA | p.Ile73ProfsTer19 | p.I73Pfs*19 | P08238 | protein_coding | | | TCGA-A8-A08O-01 | Breast | breast invasive carcinoma | Female | <65 | III/IV | Chemotherapy | docetaxel | PD |
| HSP90AB1 | SNV | Missense_Mutation | rs770945397 | c.1346G>A | p.Arg449His | p.R449H | P08238 | protein_coding | tolerated(0.07) | benign(0.003) | TCGA-2W-A8YY-01 | Cervix | cervical & endocervical cancer | Female | <65 | I/II | Chemotherapy | cisplatin | CR |
| HSP90AB1 | SNV | Missense_Mutation | | c.87N>G | p.Ile29Met | p.I29M | P08238 | protein_coding | deleterious(0.01) | possibly_damaging(0.863) | TCGA-EK-A3GK-01 | Cervix | cervical & endocervical cancer | Female | <65 | I/II | Unknown | Unknown | SD |
| HSP90AB1 | SNV | Missense_Mutation | | c.52N>G | p.Gln18Glu | p.Q18E | P08238 | protein_coding | deleterious(0.02) | possibly_damaging(0.48) | TCGA-VS-A958-01 | Cervix | cervical & endocervical cancer | Female | <65 | I/II | Chemotherapy | cisplatin | CR |
| HSP90AB1 | SNV | Missense_Mutation | | c.52N>G | p.Gln18Glu | p.Q18E | P08238 | protein_coding | deleterious(0.02) | possibly_damaging(0.48) | TCGA-ZJ-AAXU-01 | Cervix | cervical & endocervical cancer | Female | <65 | I/II | Unknown | Unknown | SD |
| HSP90AB1 | SNV | Missense_Mutation | rs370988754 | c.502C>T | p.Arg168Cys | p.R168C | P08238 | protein_coding | deleterious(0.03) | benign(0.007) | TCGA-AA-3949-01 | Colorectum | colon adenocarcinoma | Female | >=65 | III/IV | Unknown | Unknown | SD |
| Entrez ID | Symbol | Category | Interaction Types | Drug Claim Name | Drug Name | PMIDs |
| 3326 | HSP90AB1 | TRANSCRIPTION FACTOR, DRUGGABLE GENOME, CLINICALLY ACTIONABLE, CELL SURFACE, TUMOR SUPPRESSOR | | ZERANOL | ZERANOL | |
| 3326 | HSP90AB1 | TRANSCRIPTION FACTOR, DRUGGABLE GENOME, CLINICALLY ACTIONABLE, CELL SURFACE, TUMOR SUPPRESSOR | | ZEARALENONE | ZEARALENONE | |
| 3326 | HSP90AB1 | TRANSCRIPTION FACTOR, DRUGGABLE GENOME, CLINICALLY ACTIONABLE, CELL SURFACE, TUMOR SUPPRESSOR | | RADANAMYCIN | RADANAMYCIN | 16464590 |
| 3326 | HSP90AB1 | TRANSCRIPTION FACTOR, DRUGGABLE GENOME, CLINICALLY ACTIONABLE, CELL SURFACE, TUMOR SUPPRESSOR | | GAMBOGIC ACID | GAMBOGIC ACID | 21486005 |
| 3326 | HSP90AB1 | TRANSCRIPTION FACTOR, DRUGGABLE GENOME, CLINICALLY ACTIONABLE, CELL SURFACE, TUMOR SUPPRESSOR | inhibitor | AUY922 | | |
| 3326 | HSP90AB1 | TRANSCRIPTION FACTOR, DRUGGABLE GENOME, CLINICALLY ACTIONABLE, CELL SURFACE, TUMOR SUPPRESSOR | | RHEIN | RHEIN | |
| 3326 | HSP90AB1 | TRANSCRIPTION FACTOR, DRUGGABLE GENOME, CLINICALLY ACTIONABLE, CELL SURFACE, TUMOR SUPPRESSOR | inhibitor | 354702300 | GELDANAMYCIN | |
| 3326 | HSP90AB1 | TRANSCRIPTION FACTOR, DRUGGABLE GENOME, CLINICALLY ACTIONABLE, CELL SURFACE, TUMOR SUPPRESSOR | | IPI-504 | RETASPIMYCIN HYDROCHLORIDE | |
| 3326 | HSP90AB1 | TRANSCRIPTION FACTOR, DRUGGABLE GENOME, CLINICALLY ACTIONABLE, CELL SURFACE, TUMOR SUPPRESSOR | | MPC-3100 | | |
| 3326 | HSP90AB1 | TRANSCRIPTION FACTOR, DRUGGABLE GENOME, CLINICALLY ACTIONABLE, CELL SURFACE, TUMOR SUPPRESSOR | | CELASTROL | CELASTROL | 25756299,21129982 |


