
|
|||||
|
 | |
| |
| |
| |
| |
| |
|
Gene: HSF2 |
Gene summary for HSF2 |
| Gene information | Species | Human | Gene symbol | HSF2 | Gene ID | 3298 |
| Gene name | heat shock transcription factor 2 | |
| Gene Alias | HSF 2 | |
| Cytomap | 6q22.31 | |
| Gene Type | protein-coding | GO ID | GO:0000003 | UniProtAcc | Q03933 |
Top |
Malignant transformation analysis |
| Identification of the aberrant gene expression in precancerous and cancerous lesions by comparing the gene expression of stem-like cells in diseased tissues with normal stem cells |
| Entrez ID | Symbol | Replicates | Species | Organ | Tissue | Adj P-value | Log2FC | Malignancy |
| 3298 | HSF2 | LZE4T | Human | Esophagus | ESCC | 3.70e-07 | 2.04e-01 | 0.0811 |
| 3298 | HSF2 | LZE7T | Human | Esophagus | ESCC | 3.32e-13 | 5.26e-01 | 0.0667 |
| 3298 | HSF2 | LZE24T | Human | Esophagus | ESCC | 1.53e-14 | 2.38e-01 | 0.0596 |
| 3298 | HSF2 | LZE21T | Human | Esophagus | ESCC | 3.41e-03 | 2.33e-01 | 0.0655 |
| 3298 | HSF2 | P2T-E | Human | Esophagus | ESCC | 2.47e-19 | 3.30e-01 | 0.1177 |
| 3298 | HSF2 | P4T-E | Human | Esophagus | ESCC | 3.21e-10 | 2.25e-01 | 0.1323 |
| 3298 | HSF2 | P5T-E | Human | Esophagus | ESCC | 1.62e-05 | 9.62e-02 | 0.1327 |
| 3298 | HSF2 | P8T-E | Human | Esophagus | ESCC | 1.25e-12 | 2.33e-01 | 0.0889 |
| 3298 | HSF2 | P9T-E | Human | Esophagus | ESCC | 6.31e-03 | 1.10e-01 | 0.1131 |
| 3298 | HSF2 | P10T-E | Human | Esophagus | ESCC | 3.69e-15 | 2.76e-01 | 0.116 |
| 3298 | HSF2 | P11T-E | Human | Esophagus | ESCC | 3.05e-03 | 1.11e-01 | 0.1426 |
| 3298 | HSF2 | P12T-E | Human | Esophagus | ESCC | 1.11e-21 | 4.04e-01 | 0.1122 |
| 3298 | HSF2 | P15T-E | Human | Esophagus | ESCC | 2.19e-09 | 2.07e-01 | 0.1149 |
| 3298 | HSF2 | P16T-E | Human | Esophagus | ESCC | 1.65e-16 | 4.17e-01 | 0.1153 |
| 3298 | HSF2 | P20T-E | Human | Esophagus | ESCC | 8.45e-04 | 1.05e-01 | 0.1124 |
| 3298 | HSF2 | P21T-E | Human | Esophagus | ESCC | 7.64e-11 | 2.46e-01 | 0.1617 |
| 3298 | HSF2 | P22T-E | Human | Esophagus | ESCC | 2.91e-05 | 9.09e-02 | 0.1236 |
| 3298 | HSF2 | P23T-E | Human | Esophagus | ESCC | 5.24e-15 | 3.28e-01 | 0.108 |
| 3298 | HSF2 | P24T-E | Human | Esophagus | ESCC | 3.26e-02 | 2.60e-02 | 0.1287 |
| 3298 | HSF2 | P26T-E | Human | Esophagus | ESCC | 4.38e-14 | 2.71e-01 | 0.1276 |
| Page: 1 2 3 4 |
| Tissue | Expression Dynamics | Abbreviation |
| Esophagus |  | ESCC: Esophageal squamous cell carcinoma |
| HGIN: High-grade intraepithelial neoplasias | ||
| LGIN: Low-grade intraepithelial neoplasias | ||
| Oral Cavity | 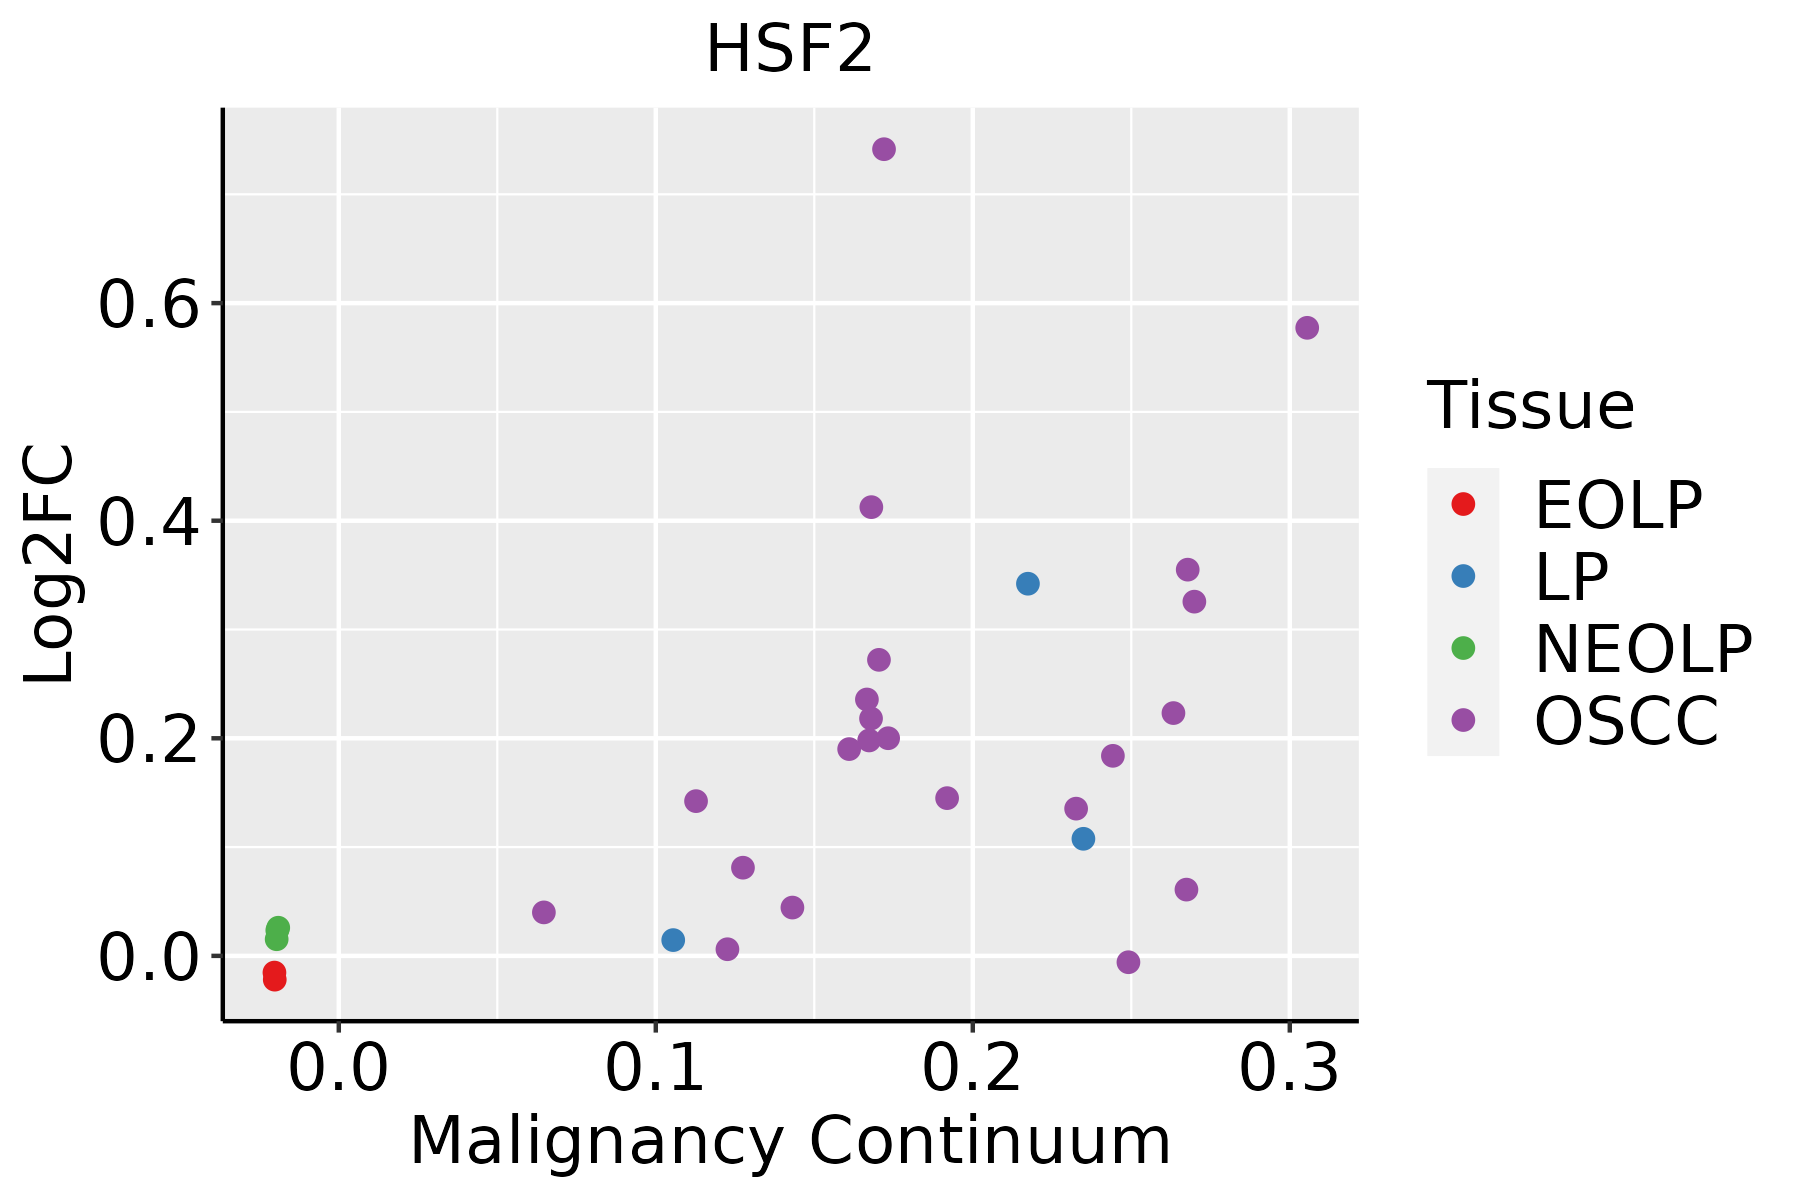 | EOLP: Erosive Oral lichen planus |
| LP: leukoplakia | ||
| NEOLP: Non-erosive oral lichen planus | ||
| OSCC: Oral squamous cell carcinoma |
| ∗log2FC in expression of this searched gene in stem-like cells from each diseased tissue sample relative to stem-like cells in normal samples in each tissue plotted against the malignancy continuum. Samples are colored based on if they are from different disease stage. |
Top |
Malignant transformation related pathway analysis |
| Find out the enriched GO biological processes and KEGG pathways involved in transition from healthy to precancer to cancer |
| Tissue | Disease Stage | Enriched GO biological Processes |
| Colorectum | AD |  |
| Colorectum | SER |  |
| Colorectum | MSS |  |
| Colorectum | MSI-H |  |
| Colorectum | FAP |  |
| ∗Top 15 enriched GO BP terms are showed in the bar plot of each disease state in each tissue. Each row represents a significant GO biological process which is colored according to the -log10(p.adjust). |
| Page: 1 2 3 4 5 6 7 8 9 |
| GO ID | Tissue | Disease Stage | Description | Gene Ratio | Bg Ratio | pvalue | p.adjust | Count |
| Page: 1 |
| Pathway ID | Tissue | Disease Stage | Description | Gene Ratio | Bg Ratio | pvalue | p.adjust | qvalue | Count |
| Page: 1 |
Top |
Cell-cell communication analysis |
| Identification of potential cell-cell interactions between two cell types and their ligand-receptor pairs for different disease states |
| Ligand | Receptor | LRpair | Pathway | Tissue | Disease Stage |
| Page: 1 |
Top |
Single-cell gene regulatory network inference analysis |
| Find out the significant the regulons (TFs) and the target genes of each regulon across cell types for different disease states |
| TF | Cell Type | Tissue | Disease Stage | Target Gene | RSS | Regulon Activity |
| HSF2 | STM | Breast | DCIS | DOK5,RORC,PCGF6, etc. | 2.24e-01 |  |
| HSF2 | INCAF | Cervix | ADJ | RGS2,CITED4,BDKRB2, etc. | 8.89e-02 |  |
| HSF2 | FIB | Cervix | CC | RGS2,CITED4,BDKRB2, etc. | 2.87e-02 |  |
| HSF2 | ECM | Cervix | CC | RGS2,CITED4,BDKRB2, etc. | 2.33e-02 | |
| HSF2 | ECM | Cervix | HSIL_HPV | RGS2,CITED4,BDKRB2, etc. | 4.41e-02 |  |
| HSF2 | FIB | Cervix | N_HPV | RGS2,CITED4,BDKRB2, etc. | 6.46e-03 |  |
| HSF2 | TUF | Colorectum | Healthy | OIP5,AC093152.1,TYK2, etc. | 6.23e-03 |  |
| HSF2 | TFH | Colorectum | ADJ | CACHD1,LTB,UBR5-AS1, etc. | 1.32e-01 |  |
| HSF2 | CD4TN | Colorectum | ADJ | CACHD1,LTB,UBR5-AS1, etc. | 2.29e-01 | |
| HSF2 | CD4TN | Colorectum | CRC | CACHD1,LTB,UBR5-AS1, etc. | 5.42e-02 |  |
| ∗The dot plots of a searched regulon are shown for all cell subpopulations in each disease state of each tissue based on the regulon specific score inferred using pySCENIC and by calculating the average expression. |
| Page: 1 2 3 |
Top |
Somatic mutation of malignant transformation related genes |
| Annotation of somatic variants for genes involved in malignant transformation |
| Hugo Symbol | Variant Class | Variant Classification | dbSNP RS | HGVSc | HGVSp | HGVSp Short | SWISSPROT | BIOTYPE | SIFT | PolyPhen | Tumor Sample Barcode | Tissue | Histology | Sex | Age | Stage | Therapy Types | Drugs | Outcome |
| HSF2 | deletion | Frame_Shift_Del | c.626_639delNNNNNNNNNNNNNN | p.Lys209ThrfsTer9 | p.K209Tfs*9 | Q03933 | protein_coding | TCGA-A8-A08F-01 | Breast | breast invasive carcinoma | Female | <65 | III/IV | Chemotherapy | 5-fluorouracil | CR | |||
| HSF2 | SNV | Missense_Mutation | novel | c.787G>T | p.Val263Phe | p.V263F | Q03933 | protein_coding | deleterious(0.03) | benign(0.299) | TCGA-2W-A8YY-01 | Cervix | cervical & endocervical cancer | Female | <65 | I/II | Chemotherapy | cisplatin | CR |
| HSF2 | SNV | Missense_Mutation | novel | c.376N>A | p.Leu126Ile | p.L126I | Q03933 | protein_coding | tolerated(0.07) | benign(0.033) | TCGA-VS-A8QH-01 | Cervix | cervical & endocervical cancer | Female | >=65 | I/II | Chemotherapy | gemcitabine | PD |
| HSF2 | SNV | Missense_Mutation | novel | c.378N>C | p.Leu126Phe | p.L126F | Q03933 | protein_coding | deleterious(0) | benign(0.137) | TCGA-VS-A8QH-01 | Cervix | cervical & endocervical cancer | Female | >=65 | I/II | Chemotherapy | gemcitabine | PD |
| HSF2 | SNV | Missense_Mutation | novel | c.1236N>T | p.Glu412Asp | p.E412D | Q03933 | protein_coding | tolerated(0.35) | benign(0.145) | TCGA-AA-3510-01 | Colorectum | colon adenocarcinoma | Male | >=65 | I/II | Unknown | Unknown | SD |
| HSF2 | SNV | Missense_Mutation | c.648N>G | p.Ile216Met | p.I216M | Q03933 | protein_coding | deleterious(0.05) | benign(0.029) | TCGA-AA-3966-01 | Colorectum | colon adenocarcinoma | Female | >=65 | I/II | Unknown | Unknown | SD | |
| HSF2 | SNV | Missense_Mutation | rs144007130 | c.364C>T | p.Arg122Cys | p.R122C | Q03933 | protein_coding | tolerated(0.14) | benign(0.009) | TCGA-AA-A00N-01 | Colorectum | colon adenocarcinoma | Male | >=65 | I/II | Unknown | Unknown | PD |
| HSF2 | SNV | Missense_Mutation | novel | c.123N>T | p.Glu41Asp | p.E41D | Q03933 | protein_coding | deleterious(0.01) | possibly_damaging(0.777) | TCGA-AA-A010-01 | Colorectum | colon adenocarcinoma | Female | <65 | I/II | Chemotherapy | folinic | CR |
| HSF2 | SNV | Missense_Mutation | rs144007130 | c.364N>T | p.Arg122Cys | p.R122C | Q03933 | protein_coding | tolerated(0.14) | benign(0.009) | TCGA-AZ-4315-01 | Colorectum | colon adenocarcinoma | Male | <65 | I/II | Unknown | Unknown | SD |
| HSF2 | SNV | Missense_Mutation | rs267600788 | c.844N>T | p.Pro282Ser | p.P282S | Q03933 | protein_coding | tolerated(0.27) | benign(0.212) | TCGA-CA-6717-01 | Colorectum | colon adenocarcinoma | Male | <65 | I/II | Chemotherapy | oxaliplatin | CR |
| Page: 1 2 3 4 5 |
Top |
Related drugs of malignant transformation related genes |
| Identification of chemicals and drugs interact with genes involved in malignant transfromation |
| (DGIdb 4.0) |
| Entrez ID | Symbol | Category | Interaction Types | Drug Claim Name | Drug Name | PMIDs |
| Page: 1 |

Copyright 2023-Present -The University of Texas Health Science Center at Houston |