
|
|||||
|
 | |
| |
| |
| |
| |
| |
|
Gene: HSD3B7 |
Gene summary for HSD3B7 |
| Gene information | Species | Human | Gene symbol | HSD3B7 | Gene ID | 80270 |
| Gene name | hydroxy-delta-5-steroid dehydrogenase, 3 beta- and steroid delta-isomerase 7 | |
| Gene Alias | CBAS1 | |
| Cytomap | 16p11.2 | |
| Gene Type | protein-coding | GO ID | GO:0002376 | UniProtAcc | Q9H2F3 |
Top |
Malignant transformation analysis |
| Identification of the aberrant gene expression in precancerous and cancerous lesions by comparing the gene expression of stem-like cells in diseased tissues with normal stem cells |
| Entrez ID | Symbol | Replicates | Species | Organ | Tissue | Adj P-value | Log2FC | Malignancy |
| 80270 | HSD3B7 | LZE7T | Human | Esophagus | ESCC | 1.25e-02 | 1.44e-01 | 0.0667 |
| 80270 | HSD3B7 | LZE24T | Human | Esophagus | ESCC | 4.63e-03 | 9.24e-02 | 0.0596 |
| 80270 | HSD3B7 | P4T-E | Human | Esophagus | ESCC | 2.30e-08 | 2.59e-01 | 0.1323 |
| 80270 | HSD3B7 | P5T-E | Human | Esophagus | ESCC | 3.33e-11 | 2.14e-01 | 0.1327 |
| 80270 | HSD3B7 | P8T-E | Human | Esophagus | ESCC | 2.20e-07 | 1.85e-01 | 0.0889 |
| 80270 | HSD3B7 | P9T-E | Human | Esophagus | ESCC | 1.59e-03 | 2.07e-01 | 0.1131 |
| 80270 | HSD3B7 | P10T-E | Human | Esophagus | ESCC | 9.67e-07 | 4.35e-02 | 0.116 |
| 80270 | HSD3B7 | P11T-E | Human | Esophagus | ESCC | 3.52e-11 | 3.22e-01 | 0.1426 |
| 80270 | HSD3B7 | P12T-E | Human | Esophagus | ESCC | 1.47e-05 | 1.14e-01 | 0.1122 |
| 80270 | HSD3B7 | P15T-E | Human | Esophagus | ESCC | 2.58e-06 | 1.95e-01 | 0.1149 |
| 80270 | HSD3B7 | P20T-E | Human | Esophagus | ESCC | 2.58e-11 | 2.36e-01 | 0.1124 |
| 80270 | HSD3B7 | P21T-E | Human | Esophagus | ESCC | 5.42e-11 | 1.42e-01 | 0.1617 |
| 80270 | HSD3B7 | P22T-E | Human | Esophagus | ESCC | 1.31e-04 | 8.41e-02 | 0.1236 |
| 80270 | HSD3B7 | P23T-E | Human | Esophagus | ESCC | 9.25e-09 | 1.57e-01 | 0.108 |
| 80270 | HSD3B7 | P24T-E | Human | Esophagus | ESCC | 2.03e-07 | 2.28e-01 | 0.1287 |
| 80270 | HSD3B7 | P26T-E | Human | Esophagus | ESCC | 6.21e-04 | 1.56e-01 | 0.1276 |
| 80270 | HSD3B7 | P28T-E | Human | Esophagus | ESCC | 2.09e-13 | 2.50e-01 | 0.1149 |
| 80270 | HSD3B7 | P32T-E | Human | Esophagus | ESCC | 2.36e-11 | 1.97e-01 | 0.1666 |
| 80270 | HSD3B7 | P36T-E | Human | Esophagus | ESCC | 4.85e-05 | 2.42e-01 | 0.1187 |
| 80270 | HSD3B7 | P37T-E | Human | Esophagus | ESCC | 1.47e-06 | 2.04e-01 | 0.1371 |
| Page: 1 2 3 4 |
| Tissue | Expression Dynamics | Abbreviation |
| Esophagus |  | ESCC: Esophageal squamous cell carcinoma |
| HGIN: High-grade intraepithelial neoplasias | ||
| LGIN: Low-grade intraepithelial neoplasias | ||
| Liver | 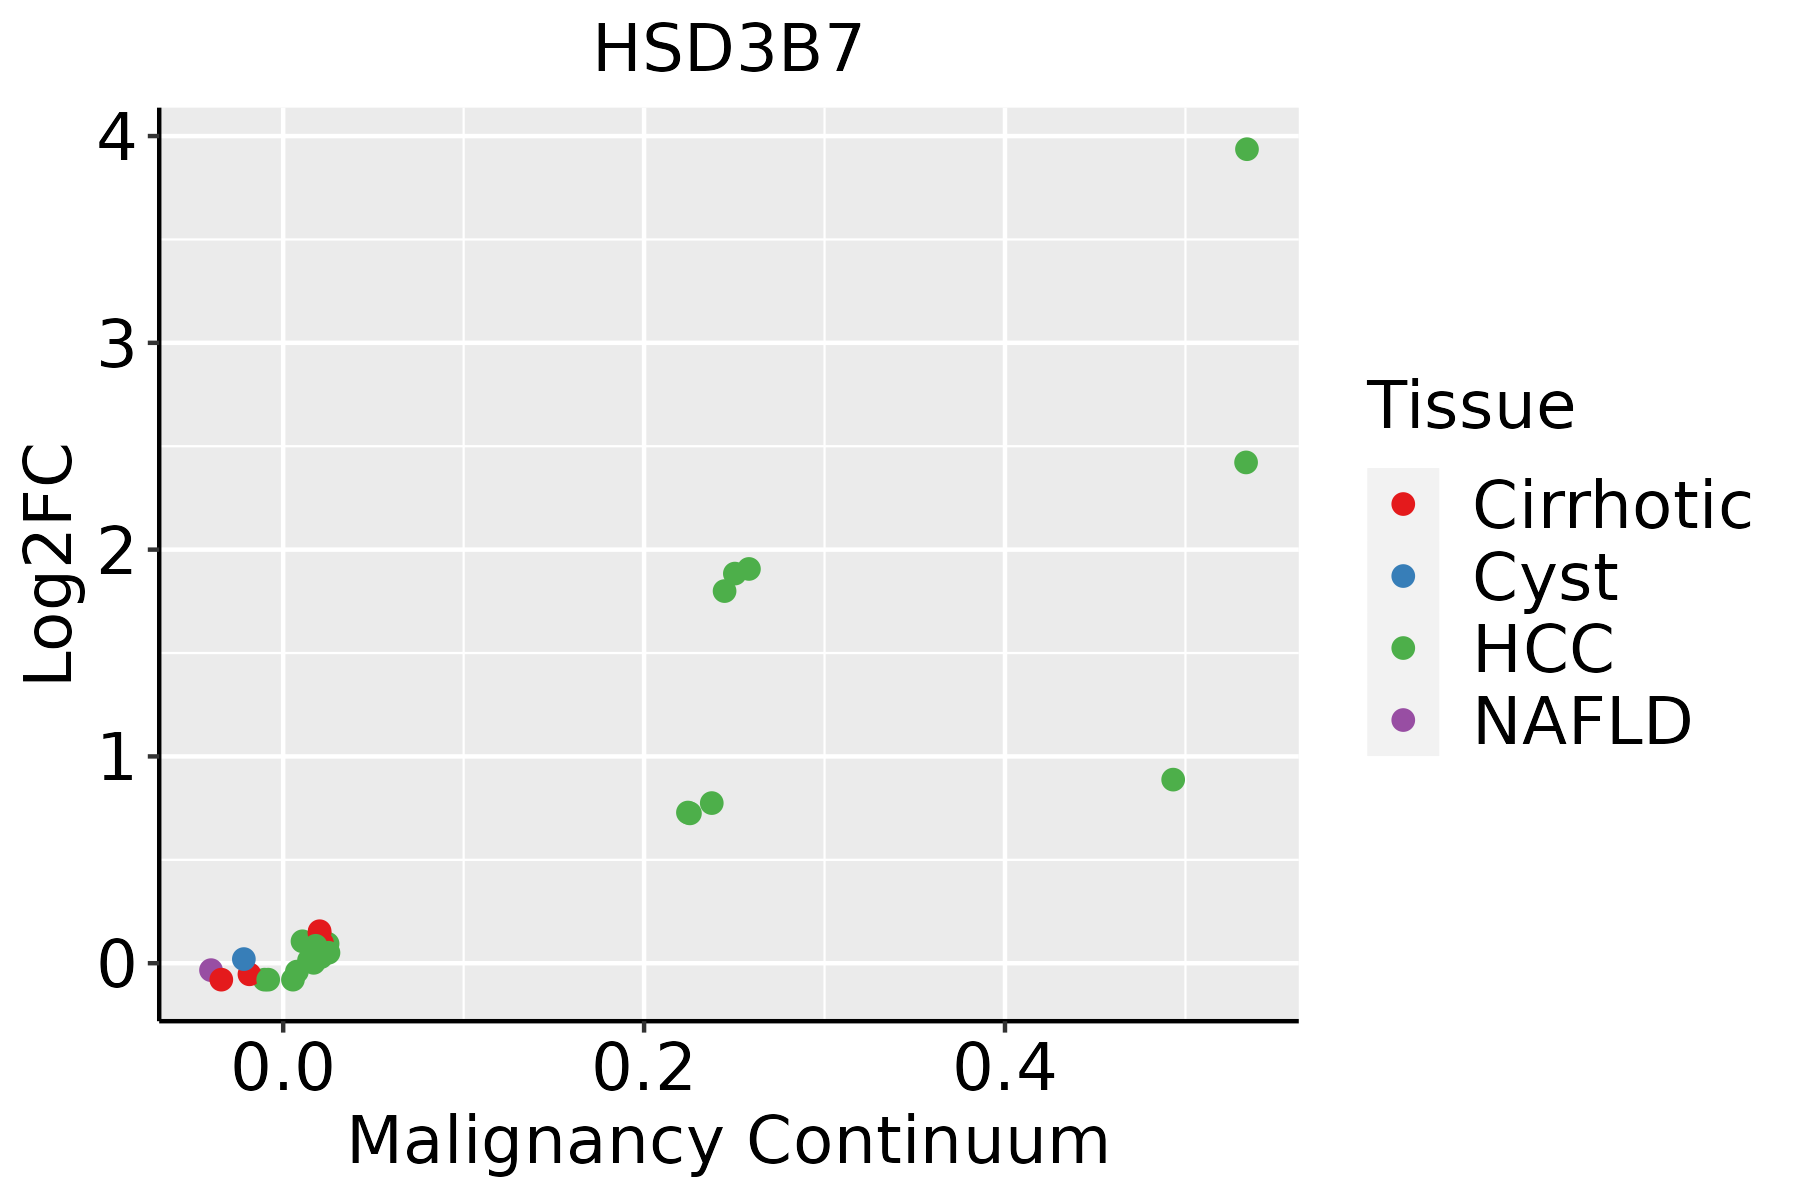 | HCC: Hepatocellular carcinoma |
| NAFLD: Non-alcoholic fatty liver disease | ||
| Oral Cavity | 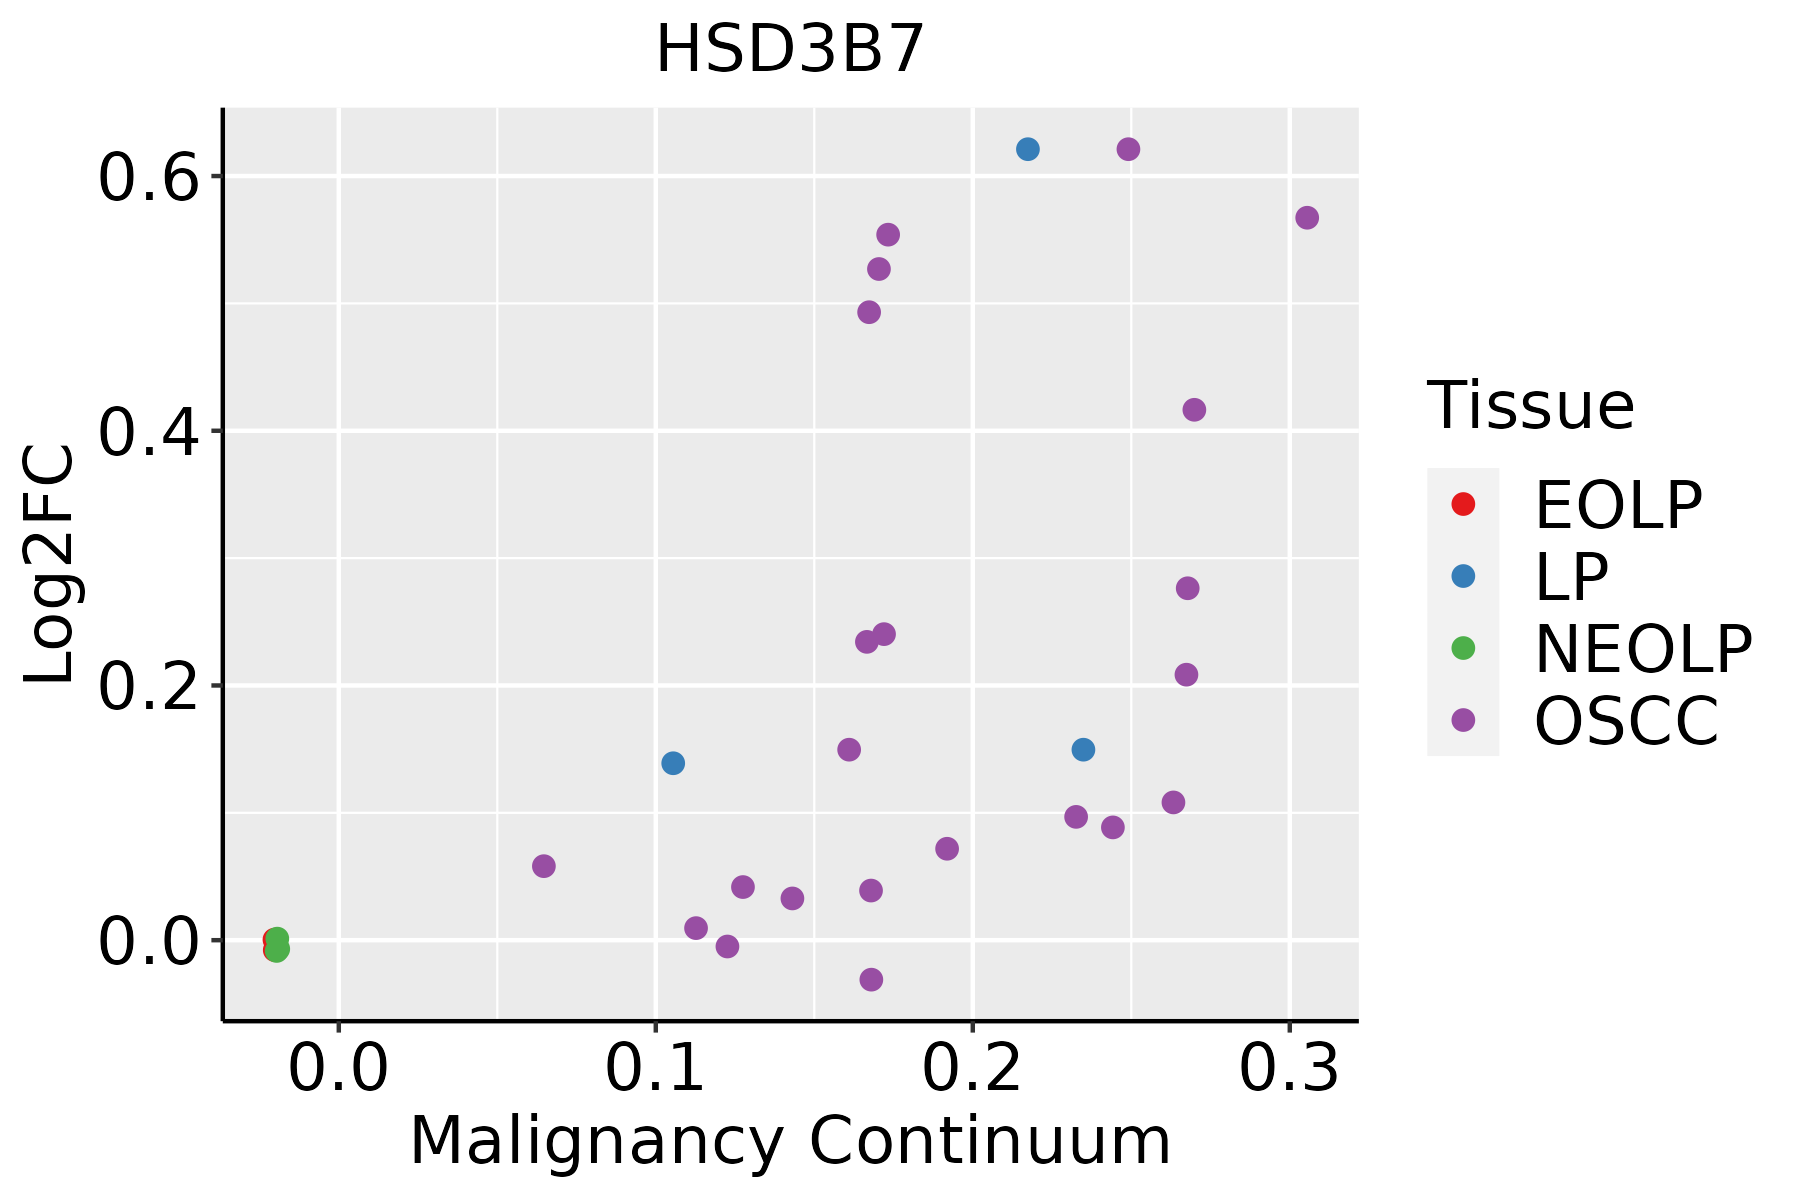 | EOLP: Erosive Oral lichen planus |
| LP: leukoplakia | ||
| NEOLP: Non-erosive oral lichen planus | ||
| OSCC: Oral squamous cell carcinoma | ||
| Thyroid | 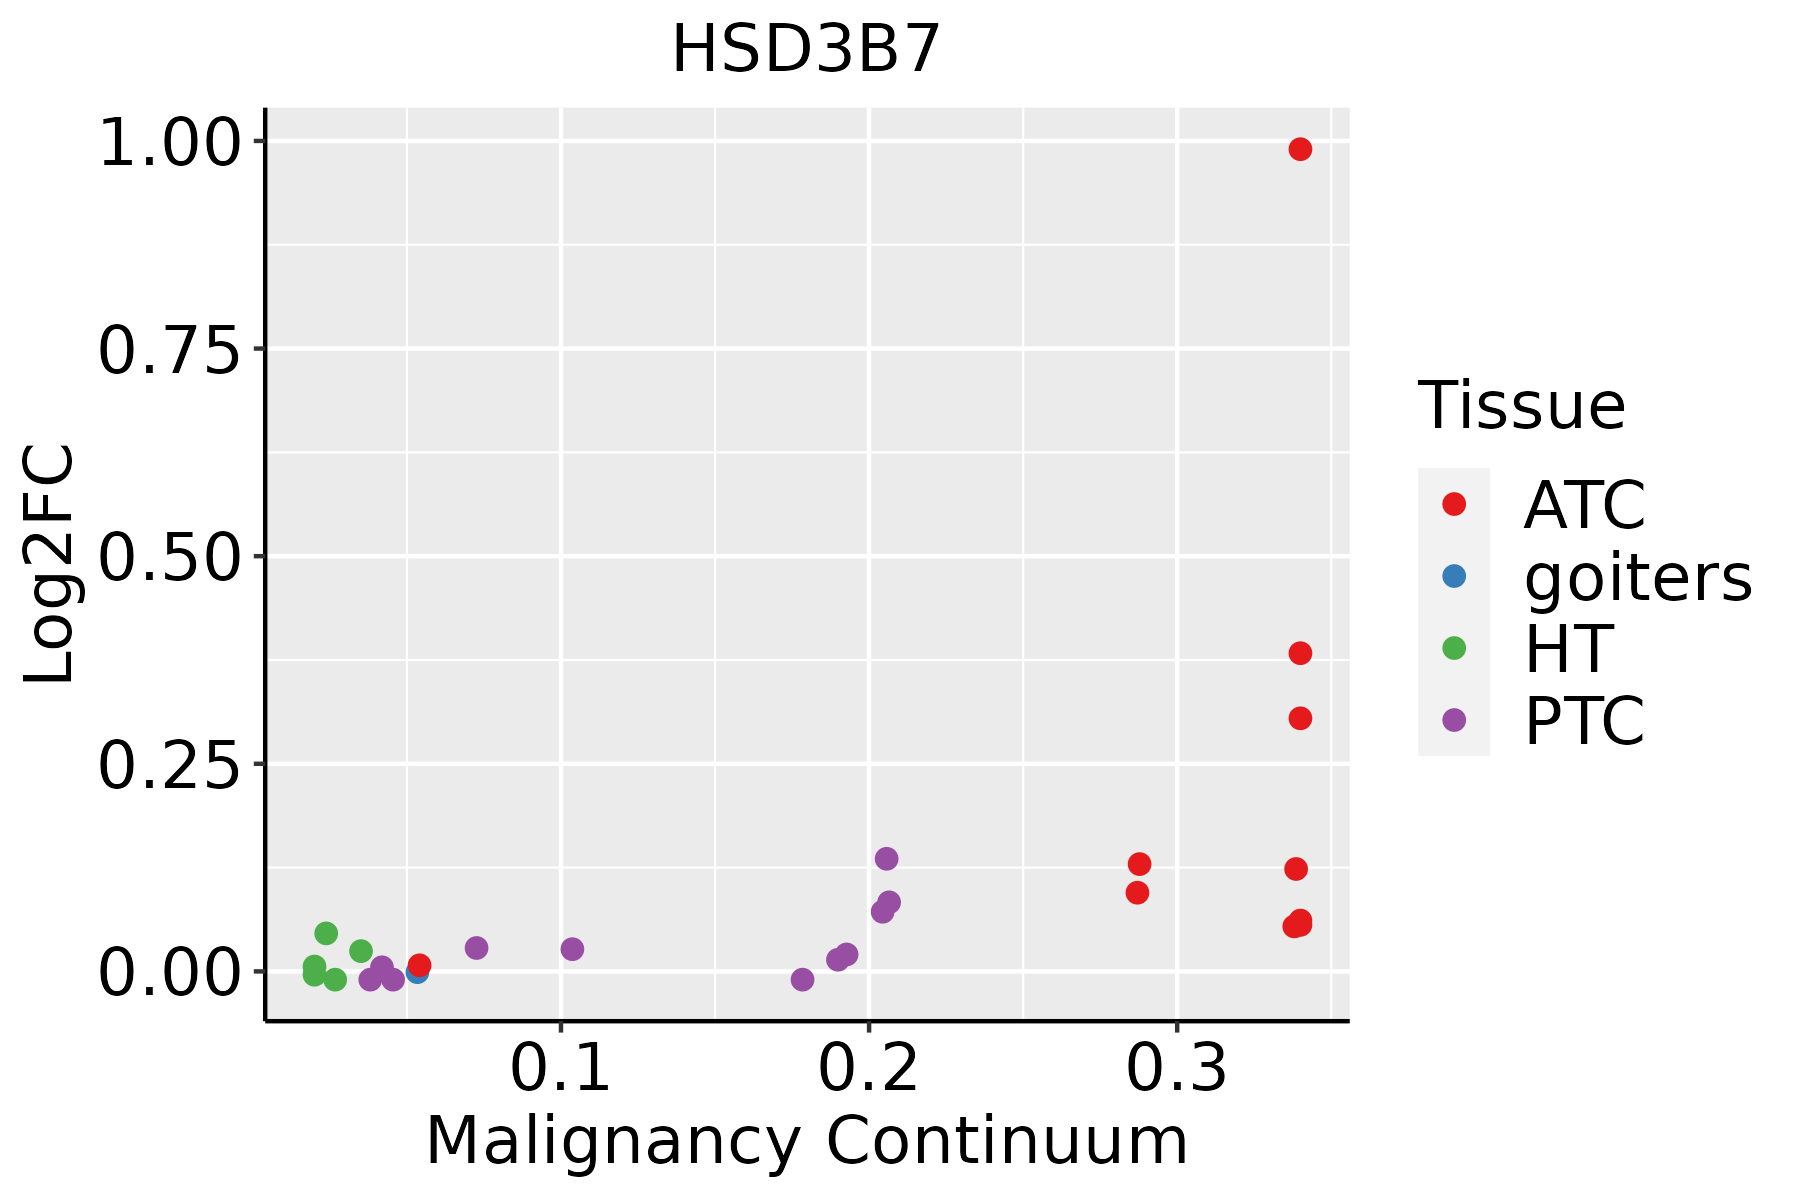 | ATC: Anaplastic thyroid cancer |
| HT: Hashimoto's thyroiditis | ||
| PTC: Papillary thyroid cancer |
| ∗log2FC in expression of this searched gene in stem-like cells from each diseased tissue sample relative to stem-like cells in normal samples in each tissue plotted against the malignancy continuum. Samples are colored based on if they are from different disease stage. |
Top |
Malignant transformation related pathway analysis |
| Find out the enriched GO biological processes and KEGG pathways involved in transition from healthy to precancer to cancer |
| Tissue | Disease Stage | Enriched GO biological Processes |
| Colorectum | AD |  |
| Colorectum | SER |  |
| Colorectum | MSS |  |
| Colorectum | MSI-H |  |
| Colorectum | FAP |  |
| ∗Top 15 enriched GO BP terms are showed in the bar plot of each disease state in each tissue. Each row represents a significant GO biological process which is colored according to the -log10(p.adjust). |
| Page: 1 2 3 4 5 6 7 8 9 |
| GO ID | Tissue | Disease Stage | Description | Gene Ratio | Bg Ratio | pvalue | p.adjust | Count |
| GO:00463948 | Esophagus | ESCC | carboxylic acid biosynthetic process | 175/8552 | 314/18723 | 1.98e-04 | 1.26e-03 | 175 |
| GO:00160538 | Esophagus | ESCC | organic acid biosynthetic process | 175/8552 | 316/18723 | 3.04e-04 | 1.82e-03 | 175 |
| GO:00066946 | Esophagus | ESCC | steroid biosynthetic process | 98/8552 | 173/18723 | 2.34e-03 | 1.03e-02 | 98 |
| GO:19016174 | Esophagus | ESCC | organic hydroxy compound biosynthetic process | 128/8552 | 237/18723 | 5.86e-03 | 2.16e-02 | 128 |
| GO:000820211 | Liver | Cirrhotic | steroid metabolic process | 143/4634 | 319/18723 | 2.79e-15 | 3.18e-13 | 143 |
| GO:001605312 | Liver | Cirrhotic | organic acid biosynthetic process | 139/4634 | 316/18723 | 4.28e-14 | 3.83e-12 | 139 |
| GO:004639412 | Liver | Cirrhotic | carboxylic acid biosynthetic process | 137/4634 | 314/18723 | 1.40e-13 | 1.14e-11 | 137 |
| GO:007233011 | Liver | Cirrhotic | monocarboxylic acid biosynthetic process | 93/4634 | 214/18723 | 1.43e-09 | 6.16e-08 | 93 |
| GO:00066941 | Liver | Cirrhotic | steroid biosynthetic process | 77/4634 | 173/18723 | 1.02e-08 | 3.91e-07 | 77 |
| GO:19016171 | Liver | Cirrhotic | organic hydroxy compound biosynthetic process | 81/4634 | 237/18723 | 6.73e-04 | 5.06e-03 | 81 |
| GO:00082061 | Liver | Cirrhotic | bile acid metabolic process | 22/4634 | 49/18723 | 1.64e-03 | 1.05e-02 | 22 |
| GO:00066991 | Liver | Cirrhotic | bile acid biosynthetic process | 17/4634 | 36/18723 | 2.82e-03 | 1.63e-02 | 17 |
| GO:001605321 | Liver | HCC | organic acid biosynthetic process | 200/7958 | 316/18723 | 5.24e-14 | 3.22e-12 | 200 |
| GO:004639421 | Liver | HCC | carboxylic acid biosynthetic process | 198/7958 | 314/18723 | 1.19e-13 | 6.78e-12 | 198 |
| GO:00082022 | Liver | HCC | steroid metabolic process | 188/7958 | 319/18723 | 1.96e-09 | 5.63e-08 | 188 |
| GO:007233021 | Liver | HCC | monocarboxylic acid biosynthetic process | 129/7958 | 214/18723 | 1.08e-07 | 2.09e-06 | 129 |
| GO:00066942 | Liver | HCC | steroid biosynthetic process | 104/7958 | 173/18723 | 2.13e-06 | 2.91e-05 | 104 |
| GO:00082062 | Liver | HCC | bile acid metabolic process | 34/7958 | 49/18723 | 1.28e-04 | 1.06e-03 | 34 |
| GO:19016172 | Liver | HCC | organic hydroxy compound biosynthetic process | 129/7958 | 237/18723 | 1.32e-04 | 1.08e-03 | 129 |
| GO:00066992 | Liver | HCC | bile acid biosynthetic process | 26/7958 | 36/18723 | 2.93e-04 | 2.10e-03 | 26 |
| Page: 1 2 |
| Pathway ID | Tissue | Disease Stage | Description | Gene Ratio | Bg Ratio | pvalue | p.adjust | qvalue | Count |
| hsa001202 | Liver | HCC | Primary bile acid biosynthesis | 14/4020 | 17/8465 | 3.49e-03 | 1.12e-02 | 6.22e-03 | 14 |
| hsa001203 | Liver | HCC | Primary bile acid biosynthesis | 14/4020 | 17/8465 | 3.49e-03 | 1.12e-02 | 6.22e-03 | 14 |
| Page: 1 |
Top |
Cell-cell communication analysis |
| Identification of potential cell-cell interactions between two cell types and their ligand-receptor pairs for different disease states |
| Ligand | Receptor | LRpair | Pathway | Tissue | Disease Stage |
| Page: 1 |
Top |
Single-cell gene regulatory network inference analysis |
| Find out the significant the regulons (TFs) and the target genes of each regulon across cell types for different disease states |
| TF | Cell Type | Tissue | Disease Stage | Target Gene | RSS | Regulon Activity |
| ∗The dot plots of a searched regulon are shown for all cell subpopulations in each disease state of each tissue based on the regulon specific score inferred using pySCENIC and by calculating the average expression. |
| Page: 1 |
Top |
Somatic mutation of malignant transformation related genes |
| Annotation of somatic variants for genes involved in malignant transformation |
| Hugo Symbol | Variant Class | Variant Classification | dbSNP RS | HGVSc | HGVSp | HGVSp Short | SWISSPROT | BIOTYPE | SIFT | PolyPhen | Tumor Sample Barcode | Tissue | Histology | Sex | Age | Stage | Therapy Types | Drugs | Outcome |
| HSD3B7 | SNV | Missense_Mutation | rs745605788 | c.80G>A | p.Arg27Gln | p.R27Q | Q9H2F3 | protein_coding | tolerated(0.11) | benign(0.313) | TCGA-2W-A8YY-01 | Cervix | cervical & endocervical cancer | Female | <65 | I/II | Chemotherapy | cisplatin | CR |
| HSD3B7 | SNV | Missense_Mutation | novel | c.583T>C | p.Tyr195His | p.Y195H | Q9H2F3 | protein_coding | deleterious(0) | probably_damaging(0.996) | TCGA-C5-A8XK-01 | Cervix | cervical & endocervical cancer | Female | <65 | I/II | Chemotherapy | cisplatin | SD |
| HSD3B7 | SNV | Missense_Mutation | c.587N>A | p.Gly196Asp | p.G196D | Q9H2F3 | protein_coding | deleterious(0) | probably_damaging(1) | TCGA-IR-A3LK-01 | Cervix | cervical & endocervical cancer | Female | >=65 | I/II | Chemotherapy | cisplatin | PD | |
| HSD3B7 | SNV | Missense_Mutation | c.496G>A | p.Ala166Thr | p.A166T | Q9H2F3 | protein_coding | deleterious(0) | probably_damaging(0.929) | TCGA-AA-3710-01 | Colorectum | colon adenocarcinoma | Female | >=65 | I/II | Unknown | Unknown | SD | |
| HSD3B7 | SNV | Missense_Mutation | rs560826820 | c.499G>A | p.Glu167Lys | p.E167K | Q9H2F3 | protein_coding | deleterious(0) | possibly_damaging(0.725) | TCGA-AD-5900-01 | Colorectum | colon adenocarcinoma | Male | >=65 | I/II | Unknown | Unknown | SD |
| HSD3B7 | SNV | Missense_Mutation | c.591A>C | p.Glu197Asp | p.E197D | Q9H2F3 | protein_coding | tolerated(0.05) | possibly_damaging(0.859) | TCGA-G4-6588-01 | Colorectum | colon adenocarcinoma | Female | <65 | I/II | Unknown | Unknown | SD | |
| HSD3B7 | SNV | Missense_Mutation | rs765855524 | c.1067G>A | p.Arg356His | p.R356H | Q9H2F3 | protein_coding | deleterious(0.03) | possibly_damaging(0.717) | TCGA-AP-A051-01 | Endometrium | uterine corpus endometrioid carcinoma | Female | >=65 | I/II | Unknown | Unknown | SD |
| HSD3B7 | SNV | Missense_Mutation | novel | c.24G>T | p.Gln8His | p.Q8H | Q9H2F3 | protein_coding | tolerated(0.09) | benign(0.087) | TCGA-AP-A1DV-01 | Endometrium | uterine corpus endometrioid carcinoma | Female | <65 | I/II | Unknown | Unknown | SD |
| HSD3B7 | SNV | Missense_Mutation | rs779021008 | c.1018N>T | p.Arg340Cys | p.R340C | Q9H2F3 | protein_coding | deleterious(0) | possibly_damaging(0.886) | TCGA-AX-A06H-01 | Endometrium | uterine corpus endometrioid carcinoma | Female | <65 | III/IV | Chemotherapy | paclitaxel | SD |
| HSD3B7 | SNV | Missense_Mutation | rs775593829 | c.968N>T | p.Thr323Met | p.T323M | Q9H2F3 | protein_coding | deleterious(0) | possibly_damaging(0.791) | TCGA-AX-A0J1-01 | Endometrium | uterine corpus endometrioid carcinoma | Female | >=65 | I/II | Unknown | Unknown | SD |
| Page: 1 2 3 4 |
Top |
Related drugs of malignant transformation related genes |
| Identification of chemicals and drugs interact with genes involved in malignant transfromation |
| (DGIdb 4.0) |
| Entrez ID | Symbol | Category | Interaction Types | Drug Claim Name | Drug Name | PMIDs |
| 80270 | HSD3B7 | ENZYME, DRUGGABLE GENOME | cholic acid |
| Page: 1 |

Copyright 2023-Present -The University of Texas Health Science Center at Houston |