
|
|||||
|
 | |
| |
| |
| |
| |
| |
|
Gene: HSD17B8 |
Gene summary for HSD17B8 |
| Gene information | Species | Human | Gene symbol | HSD17B8 | Gene ID | 7923 |
| Gene name | hydroxysteroid 17-beta dehydrogenase 8 | |
| Gene Alias | D6S2245E | |
| Cytomap | 6p21.32 | |
| Gene Type | protein-coding | GO ID | GO:0006082 | UniProtAcc | A0A1U9X7U3 |
Top |
Malignant transformation analysis |
| Identification of the aberrant gene expression in precancerous and cancerous lesions by comparing the gene expression of stem-like cells in diseased tissues with normal stem cells |
| Entrez ID | Symbol | Replicates | Species | Organ | Tissue | Adj P-value | Log2FC | Malignancy |
| 7923 | HSD17B8 | LZE4T | Human | Esophagus | ESCC | 3.03e-10 | 3.02e-01 | 0.0811 |
| 7923 | HSD17B8 | LZE7T | Human | Esophagus | ESCC | 4.82e-02 | 1.26e-01 | 0.0667 |
| 7923 | HSD17B8 | LZE20T | Human | Esophagus | ESCC | 5.22e-03 | 2.05e-01 | 0.0662 |
| 7923 | HSD17B8 | LZE22T | Human | Esophagus | ESCC | 2.99e-03 | 2.75e-01 | 0.068 |
| 7923 | HSD17B8 | LZE24T | Human | Esophagus | ESCC | 1.62e-22 | 6.40e-01 | 0.0596 |
| 7923 | HSD17B8 | LZE21T | Human | Esophagus | ESCC | 8.29e-04 | 2.78e-01 | 0.0655 |
| 7923 | HSD17B8 | P1T-E | Human | Esophagus | ESCC | 2.13e-08 | 3.76e-01 | 0.0875 |
| 7923 | HSD17B8 | P2T-E | Human | Esophagus | ESCC | 4.75e-25 | 6.77e-01 | 0.1177 |
| 7923 | HSD17B8 | P4T-E | Human | Esophagus | ESCC | 3.30e-36 | 9.05e-01 | 0.1323 |
| 7923 | HSD17B8 | P5T-E | Human | Esophagus | ESCC | 1.71e-30 | 6.53e-01 | 0.1327 |
| 7923 | HSD17B8 | P8T-E | Human | Esophagus | ESCC | 3.21e-15 | 3.79e-01 | 0.0889 |
| 7923 | HSD17B8 | P9T-E | Human | Esophagus | ESCC | 2.05e-11 | 3.65e-01 | 0.1131 |
| 7923 | HSD17B8 | P10T-E | Human | Esophagus | ESCC | 1.73e-24 | 4.19e-01 | 0.116 |
| 7923 | HSD17B8 | P11T-E | Human | Esophagus | ESCC | 2.26e-03 | 2.89e-01 | 0.1426 |
| 7923 | HSD17B8 | P12T-E | Human | Esophagus | ESCC | 7.17e-29 | 6.47e-01 | 0.1122 |
| 7923 | HSD17B8 | P15T-E | Human | Esophagus | ESCC | 2.75e-13 | 2.94e-01 | 0.1149 |
| 7923 | HSD17B8 | P16T-E | Human | Esophagus | ESCC | 2.17e-22 | 4.52e-01 | 0.1153 |
| 7923 | HSD17B8 | P17T-E | Human | Esophagus | ESCC | 5.32e-12 | 4.98e-01 | 0.1278 |
| 7923 | HSD17B8 | P20T-E | Human | Esophagus | ESCC | 7.68e-11 | 2.04e-01 | 0.1124 |
| 7923 | HSD17B8 | P21T-E | Human | Esophagus | ESCC | 1.43e-12 | 2.45e-01 | 0.1617 |
| Page: 1 2 3 4 5 |
| Tissue | Expression Dynamics | Abbreviation |
| Esophagus |  | ESCC: Esophageal squamous cell carcinoma |
| HGIN: High-grade intraepithelial neoplasias | ||
| LGIN: Low-grade intraepithelial neoplasias | ||
| Liver |  | HCC: Hepatocellular carcinoma |
| NAFLD: Non-alcoholic fatty liver disease | ||
| Oral Cavity | 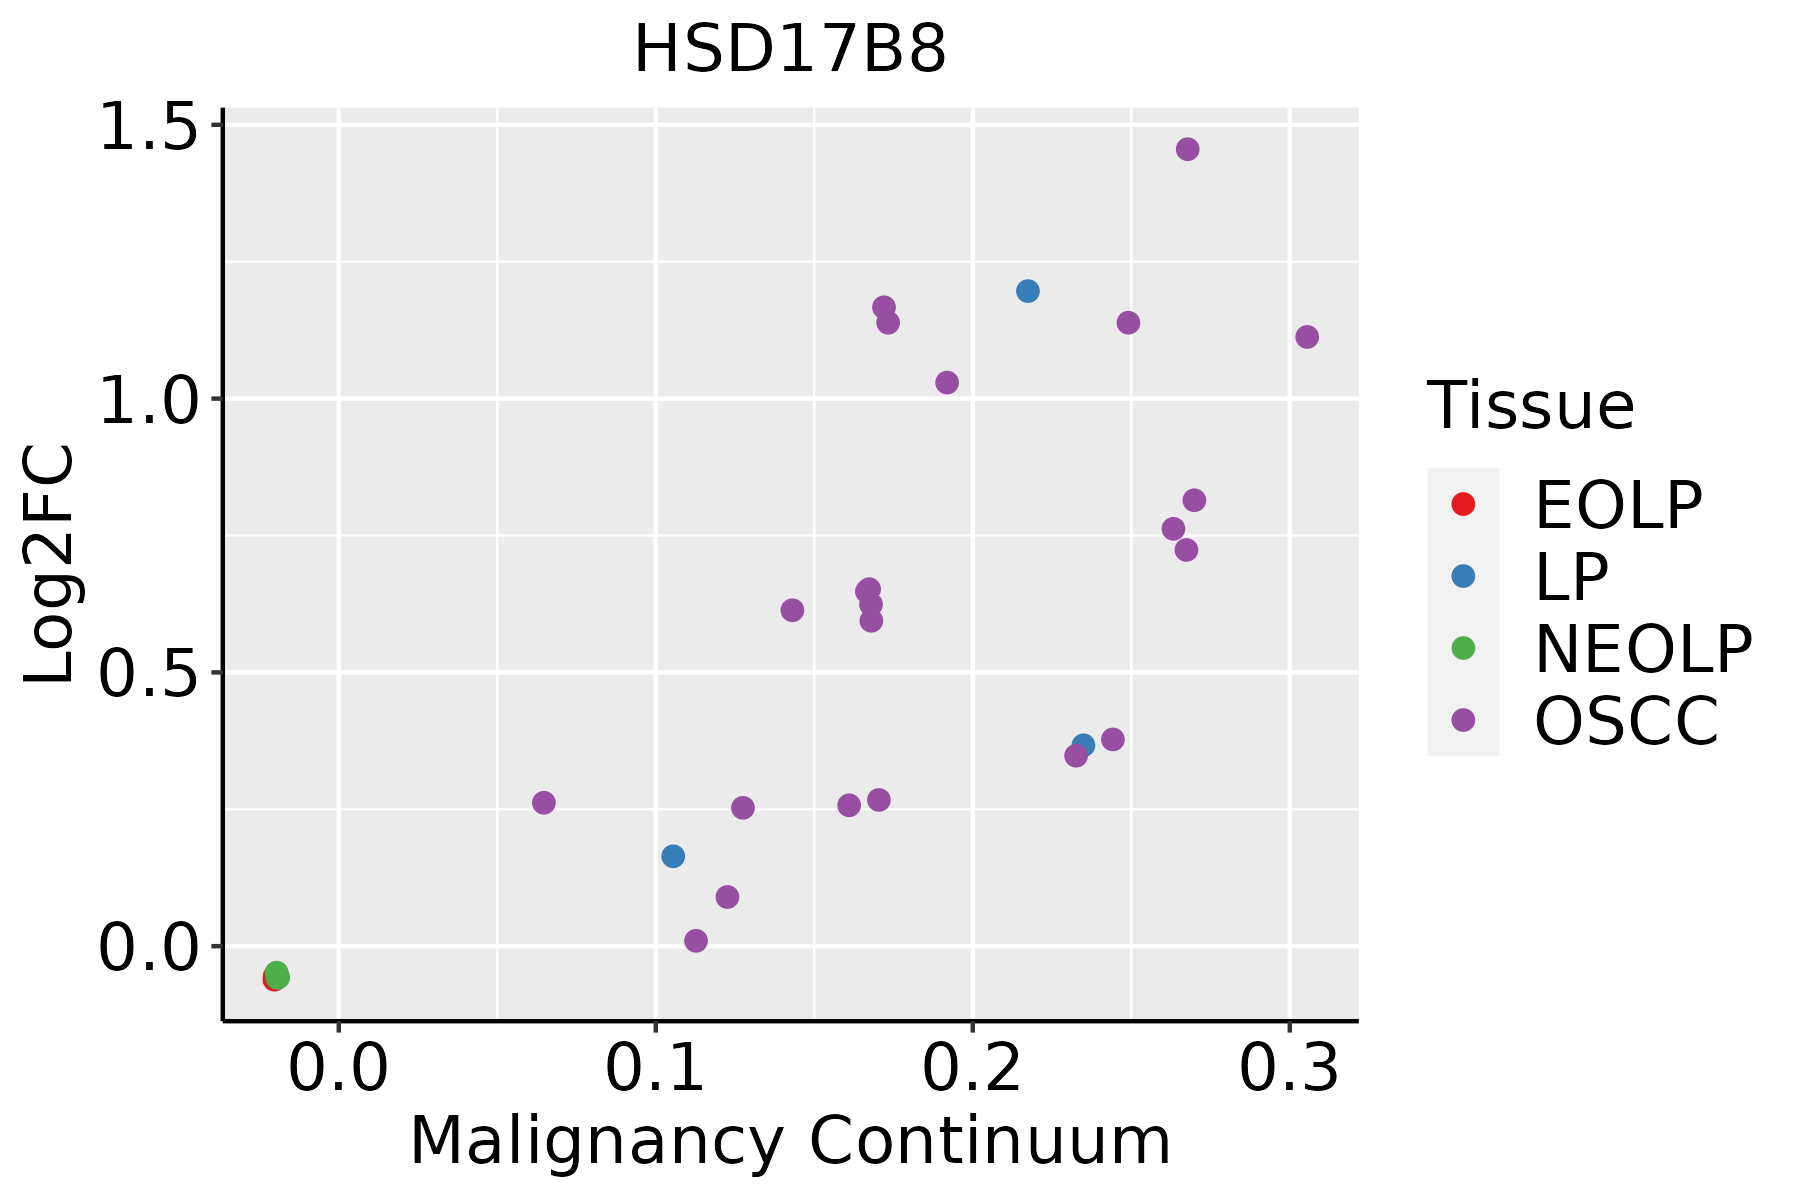 | EOLP: Erosive Oral lichen planus |
| LP: leukoplakia | ||
| NEOLP: Non-erosive oral lichen planus | ||
| OSCC: Oral squamous cell carcinoma | ||
| Thyroid | 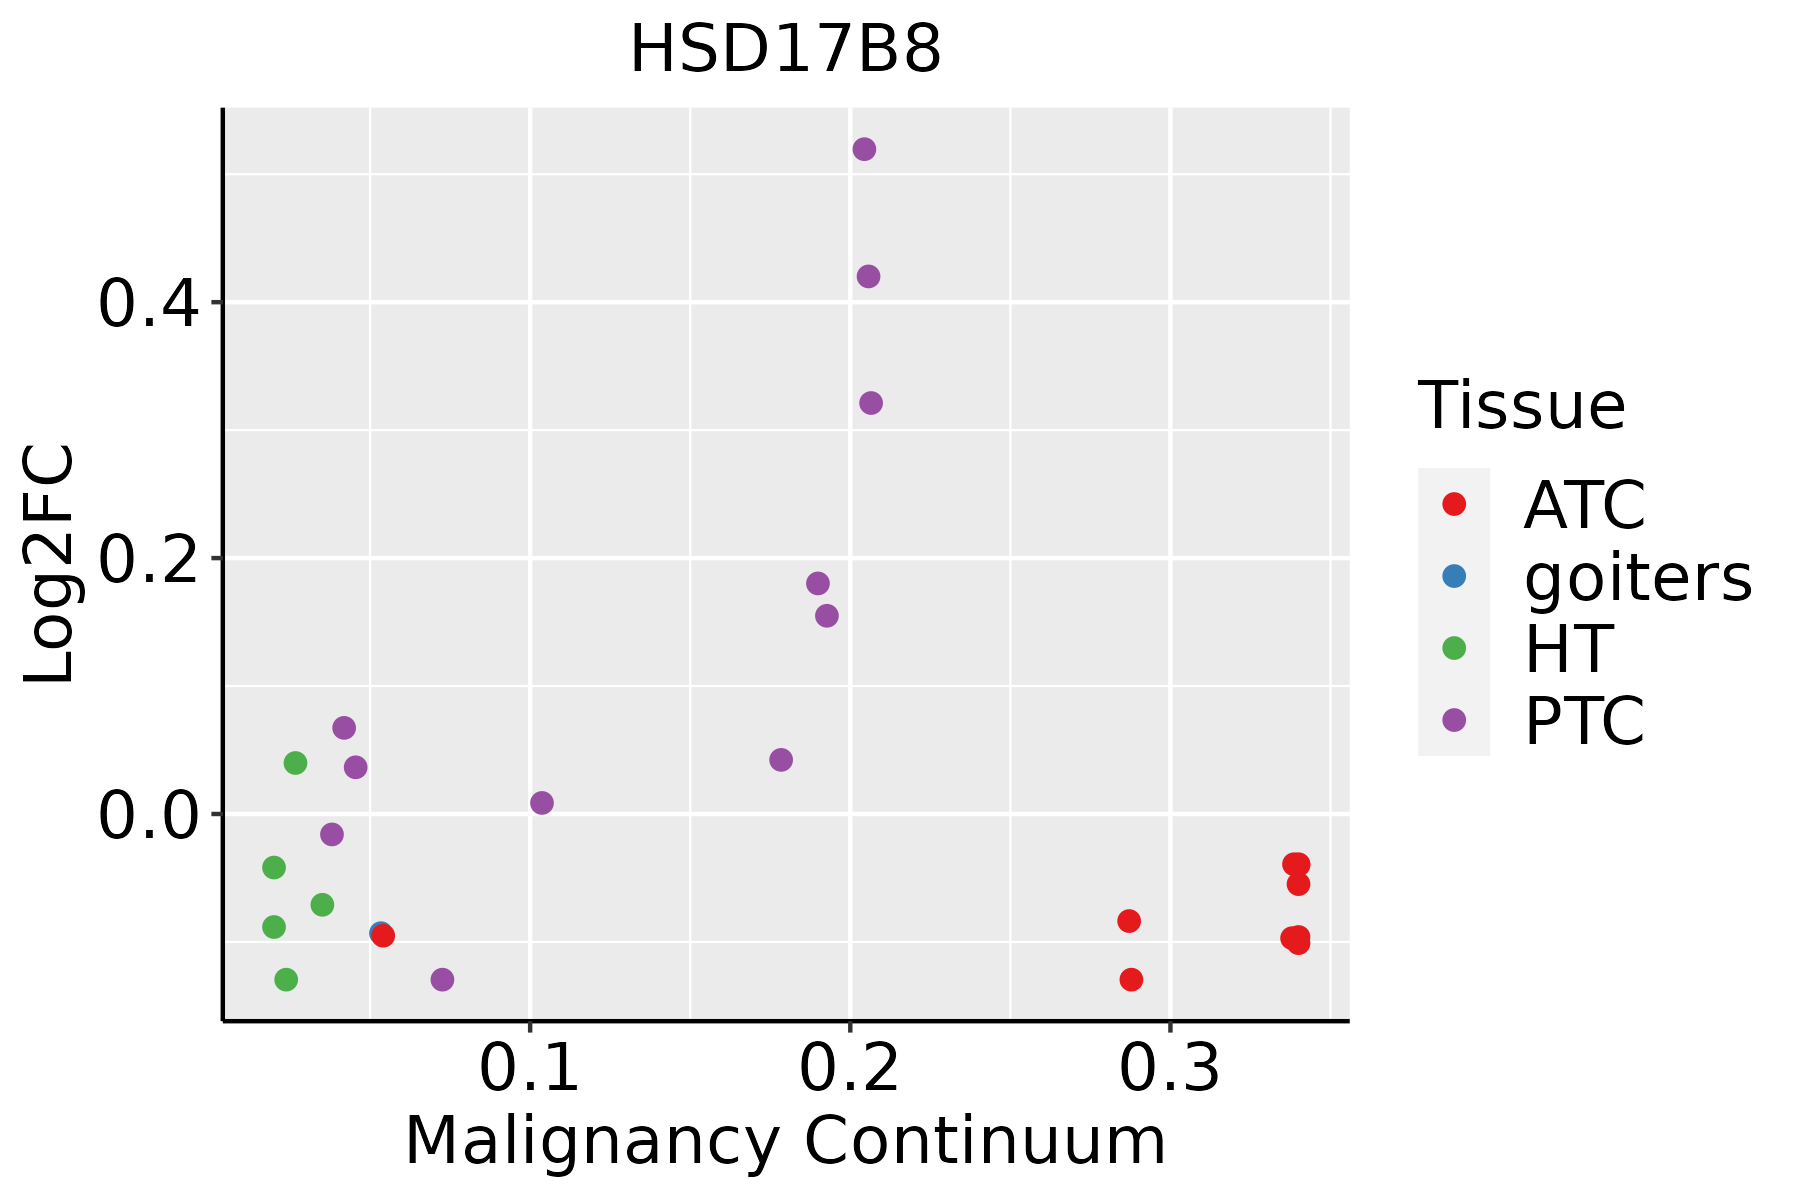 | ATC: Anaplastic thyroid cancer |
| HT: Hashimoto's thyroiditis | ||
| PTC: Papillary thyroid cancer |
| ∗log2FC in expression of this searched gene in stem-like cells from each diseased tissue sample relative to stem-like cells in normal samples in each tissue plotted against the malignancy continuum. Samples are colored based on if they are from different disease stage. |
Top |
Malignant transformation related pathway analysis |
| Find out the enriched GO biological processes and KEGG pathways involved in transition from healthy to precancer to cancer |
| Tissue | Disease Stage | Enriched GO biological Processes |
| Colorectum | AD |  |
| Colorectum | SER |  |
| Colorectum | MSS |  |
| Colorectum | MSI-H |  |
| Colorectum | FAP |  |
| ∗Top 15 enriched GO BP terms are showed in the bar plot of each disease state in each tissue. Each row represents a significant GO biological process which is colored according to the -log10(p.adjust). |
| Page: 1 2 3 4 5 6 7 8 9 |
| GO ID | Tissue | Disease Stage | Description | Gene Ratio | Bg Ratio | pvalue | p.adjust | Count |
| GO:00066318 | Esophagus | ESCC | fatty acid metabolic process | 217/8552 | 390/18723 | 4.21e-05 | 3.39e-04 | 217 |
| GO:00463948 | Esophagus | ESCC | carboxylic acid biosynthetic process | 175/8552 | 314/18723 | 1.98e-04 | 1.26e-03 | 175 |
| GO:00160538 | Esophagus | ESCC | organic acid biosynthetic process | 175/8552 | 316/18723 | 3.04e-04 | 1.82e-03 | 175 |
| GO:00512623 | Esophagus | ESCC | protein tetramerization | 54/8552 | 87/18723 | 1.50e-03 | 7.06e-03 | 54 |
| GO:00066946 | Esophagus | ESCC | steroid biosynthetic process | 98/8552 | 173/18723 | 2.34e-03 | 1.03e-02 | 98 |
| GO:00512592 | Esophagus | ESCC | protein complex oligomerization | 130/8552 | 238/18723 | 3.29e-03 | 1.36e-02 | 130 |
| GO:000820211 | Liver | Cirrhotic | steroid metabolic process | 143/4634 | 319/18723 | 2.79e-15 | 3.18e-13 | 143 |
| GO:000663112 | Liver | Cirrhotic | fatty acid metabolic process | 165/4634 | 390/18723 | 1.29e-14 | 1.26e-12 | 165 |
| GO:001605312 | Liver | Cirrhotic | organic acid biosynthetic process | 139/4634 | 316/18723 | 4.28e-14 | 3.83e-12 | 139 |
| GO:004639412 | Liver | Cirrhotic | carboxylic acid biosynthetic process | 137/4634 | 314/18723 | 1.40e-13 | 1.14e-11 | 137 |
| GO:007233011 | Liver | Cirrhotic | monocarboxylic acid biosynthetic process | 93/4634 | 214/18723 | 1.43e-09 | 6.16e-08 | 93 |
| GO:00066941 | Liver | Cirrhotic | steroid biosynthetic process | 77/4634 | 173/18723 | 1.02e-08 | 3.91e-07 | 77 |
| GO:000663311 | Liver | Cirrhotic | fatty acid biosynthetic process | 70/4634 | 163/18723 | 2.57e-07 | 6.41e-06 | 70 |
| GO:00082101 | Liver | Cirrhotic | estrogen metabolic process | 18/4634 | 38/18723 | 2.05e-03 | 1.27e-02 | 18 |
| GO:004244511 | Liver | Cirrhotic | hormone metabolic process | 73/4634 | 218/18723 | 2.22e-03 | 1.36e-02 | 73 |
| GO:0008209 | Liver | Cirrhotic | androgen metabolic process | 15/4634 | 30/18723 | 2.45e-03 | 1.47e-02 | 15 |
| GO:001605321 | Liver | HCC | organic acid biosynthetic process | 200/7958 | 316/18723 | 5.24e-14 | 3.22e-12 | 200 |
| GO:000663122 | Liver | HCC | fatty acid metabolic process | 238/7958 | 390/18723 | 8.24e-14 | 4.84e-12 | 238 |
| GO:004639421 | Liver | HCC | carboxylic acid biosynthetic process | 198/7958 | 314/18723 | 1.19e-13 | 6.78e-12 | 198 |
| GO:00082022 | Liver | HCC | steroid metabolic process | 188/7958 | 319/18723 | 1.96e-09 | 5.63e-08 | 188 |
| Page: 1 2 |
| Pathway ID | Tissue | Disease Stage | Description | Gene Ratio | Bg Ratio | pvalue | p.adjust | qvalue | Count |
| hsa012129 | Esophagus | ESCC | Fatty acid metabolism | 41/4205 | 57/8465 | 5.13e-04 | 1.75e-03 | 8.98e-04 | 41 |
| hsa0121214 | Esophagus | ESCC | Fatty acid metabolism | 41/4205 | 57/8465 | 5.13e-04 | 1.75e-03 | 8.98e-04 | 41 |
| hsa012122 | Liver | Cirrhotic | Fatty acid metabolism | 32/2530 | 57/8465 | 3.12e-05 | 2.47e-04 | 1.52e-04 | 32 |
| hsa012123 | Liver | Cirrhotic | Fatty acid metabolism | 32/2530 | 57/8465 | 3.12e-05 | 2.47e-04 | 1.52e-04 | 32 |
| hsa012124 | Liver | HCC | Fatty acid metabolism | 45/4020 | 57/8465 | 1.05e-06 | 1.10e-05 | 6.09e-06 | 45 |
| hsa00061 | Liver | HCC | Fatty acid biosynthesis | 14/4020 | 18/8465 | 8.82e-03 | 2.36e-02 | 1.32e-02 | 14 |
| hsa012125 | Liver | HCC | Fatty acid metabolism | 45/4020 | 57/8465 | 1.05e-06 | 1.10e-05 | 6.09e-06 | 45 |
| hsa000611 | Liver | HCC | Fatty acid biosynthesis | 14/4020 | 18/8465 | 8.82e-03 | 2.36e-02 | 1.32e-02 | 14 |
| hsa012128 | Oral cavity | OSCC | Fatty acid metabolism | 35/3704 | 57/8465 | 5.37e-03 | 1.29e-02 | 6.55e-03 | 35 |
| hsa0121213 | Oral cavity | OSCC | Fatty acid metabolism | 35/3704 | 57/8465 | 5.37e-03 | 1.29e-02 | 6.55e-03 | 35 |
| Page: 1 |
Top |
Cell-cell communication analysis |
| Identification of potential cell-cell interactions between two cell types and their ligand-receptor pairs for different disease states |
| Ligand | Receptor | LRpair | Pathway | Tissue | Disease Stage |
| Page: 1 |
Top |
Single-cell gene regulatory network inference analysis |
| Find out the significant the regulons (TFs) and the target genes of each regulon across cell types for different disease states |
| TF | Cell Type | Tissue | Disease Stage | Target Gene | RSS | Regulon Activity |
| ∗The dot plots of a searched regulon are shown for all cell subpopulations in each disease state of each tissue based on the regulon specific score inferred using pySCENIC and by calculating the average expression. |
| Page: 1 |
Top |
Somatic mutation of malignant transformation related genes |
| Annotation of somatic variants for genes involved in malignant transformation |
| Hugo Symbol | Variant Class | Variant Classification | dbSNP RS | HGVSc | HGVSp | HGVSp Short | SWISSPROT | BIOTYPE | SIFT | PolyPhen | Tumor Sample Barcode | Tissue | Histology | Sex | Age | Stage | Therapy Types | Drugs | Outcome |
| HSD17B8 | SNV | Missense_Mutation | novel | c.314N>C | p.Gly105Ala | p.G105A | Q92506 | protein_coding | deleterious(0) | probably_damaging(0.999) | TCGA-E9-A54Y-01 | Breast | breast invasive carcinoma | Female | <65 | III/IV | Unknown | Unknown | SD |
| HSD17B8 | SNV | Missense_Mutation | novel | c.554G>T | p.Arg185Leu | p.R185L | Q92506 | protein_coding | tolerated(0.26) | benign(0.364) | TCGA-OL-A6VO-01 | Breast | breast invasive carcinoma | Female | <65 | I/II | Chemotherapy | taxotere | CR |
| HSD17B8 | SNV | Missense_Mutation | c.775C>A | p.Leu259Ile | p.L259I | Q92506 | protein_coding | tolerated(0.06) | benign(0.363) | TCGA-AA-3977-01 | Colorectum | colon adenocarcinoma | Male | >=65 | I/II | Unknown | Unknown | SD | |
| HSD17B8 | SNV | Missense_Mutation | c.511G>A | p.Ala171Thr | p.A171T | Q92506 | protein_coding | deleterious(0) | benign(0.364) | TCGA-AJ-A3EK-01 | Endometrium | uterine corpus endometrioid carcinoma | Female | <65 | I/II | Chemotherapy | carboplatin | CR | |
| HSD17B8 | SNV | Missense_Mutation | novel | c.622C>G | p.Gln208Glu | p.Q208E | Q92506 | protein_coding | tolerated(0.9) | benign(0) | TCGA-AP-A1DO-01 | Endometrium | uterine corpus endometrioid carcinoma | Female | <65 | I/II | Unknown | Unknown | SD |
| HSD17B8 | SNV | Missense_Mutation | rs767608627 | c.547G>A | p.Ala183Thr | p.A183T | Q92506 | protein_coding | deleterious(0.05) | benign(0.031) | TCGA-AP-A1DV-01 | Endometrium | uterine corpus endometrioid carcinoma | Female | <65 | I/II | Unknown | Unknown | SD |
| HSD17B8 | SNV | Missense_Mutation | rs144565618 | c.578G>A | p.Arg193His | p.R193H | Q92506 | protein_coding | deleterious(0) | probably_damaging(0.996) | TCGA-AX-A05Z-01 | Endometrium | uterine corpus endometrioid carcinoma | Female | <65 | III/IV | Chemotherapy | adriamycin | SD |
| HSD17B8 | SNV | Missense_Mutation | c.286C>T | p.Pro96Ser | p.P96S | Q92506 | protein_coding | deleterious(0.05) | probably_damaging(0.94) | TCGA-B5-A11E-01 | Endometrium | uterine corpus endometrioid carcinoma | Female | <65 | I/II | Unknown | Unknown | SD | |
| HSD17B8 | SNV | Missense_Mutation | novel | c.407A>G | p.Gln136Arg | p.Q136R | Q92506 | protein_coding | deleterious(0.04) | probably_damaging(1) | TCGA-B5-A1MX-01 | Endometrium | uterine corpus endometrioid carcinoma | Female | <65 | I/II | Hormone Therapy | megace | SD |
| HSD17B8 | SNV | Missense_Mutation | novel | c.314G>A | p.Gly105Asp | p.G105D | Q92506 | protein_coding | deleterious(0) | probably_damaging(1) | TCGA-B5-A3FA-01 | Endometrium | uterine corpus endometrioid carcinoma | Female | >=65 | I/II | Unknown | Unknown | SD |
| Page: 1 2 |
Top |
Related drugs of malignant transformation related genes |
| Identification of chemicals and drugs interact with genes involved in malignant transfromation |
| (DGIdb 4.0) |
| Entrez ID | Symbol | Category | Interaction Types | Drug Claim Name | Drug Name | PMIDs |
| Page: 1 |

Copyright 2023-Present -The University of Texas Health Science Center at Houston |